0673
Identifying the source of spurious echoes in single voxel 1H MR Spectroscopy1Department of radiology, University Medical Center Utrecht, Utrecht, Netherlands, 2Danish Research Centre for Magnetic Resonance, Centre for Functional and Diagnostic Imaging and Research, Copenhagen University Hospital Hvidovre, Hvidovre, Denmark
Synopsis
In this work, we proposed a new strategy to identify the source of potential artifacts in single voxel 1H MRS by taking into account the intrinsic B0 field gradients in the human brain. We mapped the intrinsic gradient fields inside the human head to assess the level of signal crushing of each pathway in the entire field of view of the receiver coil. This will enable subject and location specific design of optimal crusher gradient scheme in SV MRS.
Introduction
Single voxel MR spectroscopy (SV-MRS) requires robust volume localization in combination with optimized crusher and phase cycling schemes to reduce artifacts in the volume of interest1–3. However, due to intrinsic B0 field inhomogeneities, there is a possibility that the dephasing of the local magnetic field offset cancels the dephasing of the crusher gradients during the acquisition window. This can lead to artifacts in the spectrum. Here, we provide a mechanism to identify the locations from where potential artifacts could arise in the semi-LASER sequence.Theory and Methods
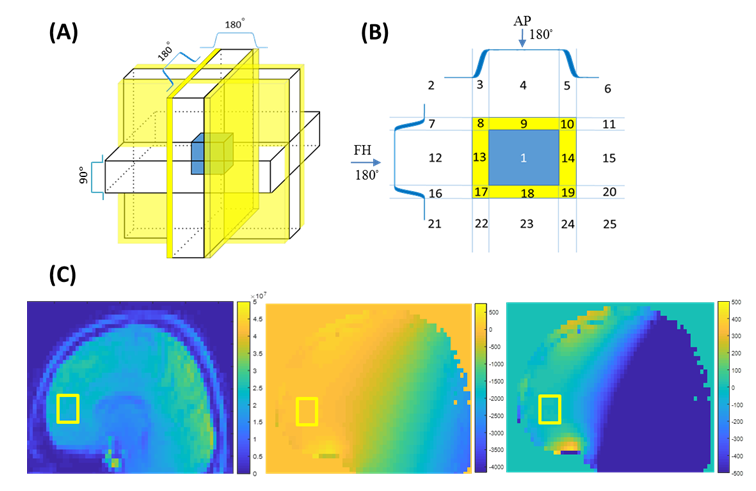
We identified 25 spatial areas that experience a different combination of pulses (Figure 1) in a semi-LASER sequence. Then, we defined 87 possible coherence pathways originating from these regions based on extended phase graph theory4. In order to investigate how B0 inhomogeneity gradients could result in signal rephasing in an acquisition window of 100 ms, the total gradient-time integrals along the anterior-posterior (AP), right-left (RL) and feet-head (FH) directions were calculated using a 3D B0 map from the human head. Crushing amount (φcrush) as well as the intrinsic gradient-time integral (φinhom.gradient) along each axis can be expressed as:φcrush=C.Garea
φinhom.gradient =γ C.t ⨂ dB0
where C, Garea and dB0 represent coherence pathways vector, crusher areas along each spatial axis and directional gradient of the B0 map respectively, and ⨂ is the elementwise product operator. The elements of the time vector t=[tRF1-texc;tRF2-tRF1;tRF3-tRF2;tRF4-tRF3;T-tRF4] correspond to the RF pulse time intervals. We computed φinhom.gradient for T=TE=31ms up to T=TE+100=131ms. If the magnitude of φcrush matches the magnitude of φinhom.gradient for the same pathway in all three dimensions simultaneously, it causes unwanted signal rephrasing. Maximum intensity projection (MIP) maps were created to show the number of pathways where φcrush matched the range in φinhom.gradient per B0 map voxel. We performed the measurements on a 7T MR scanner (Philips). We adapted the DOTCOPS5,6 algorithm to optimize the crusher and phase cycling schemes for the semi-LASER sequence, considering that the relatively long slice selective gradients act as crushers7. In a second acquistion, we reversed gradients polarities along FH direction. Other parameters were: TE/TR=31ms/5s, NSA=32, maximum crusher area=11 (mTm-1ms), voxel size 8cm3. B0 in the MRS voxel was optimized using FASTMAP8. A B0 map was acquired with a 3D FFE sequence (isotropic resolution of 3.5mm). To illustrate the presence of artifacts in the SV MR spectrum, we acquired 3D CSI data with the same localization as the SV experiment: excitation volume=27cm3, NSA=1. We repeated the SV-MRS acquisition, but with a voxel size of 27cm3, NSA=16, maximum crusher area=19.8 (mTm-1ms), and no phase cycling (similar to the 3D CSI).
Results
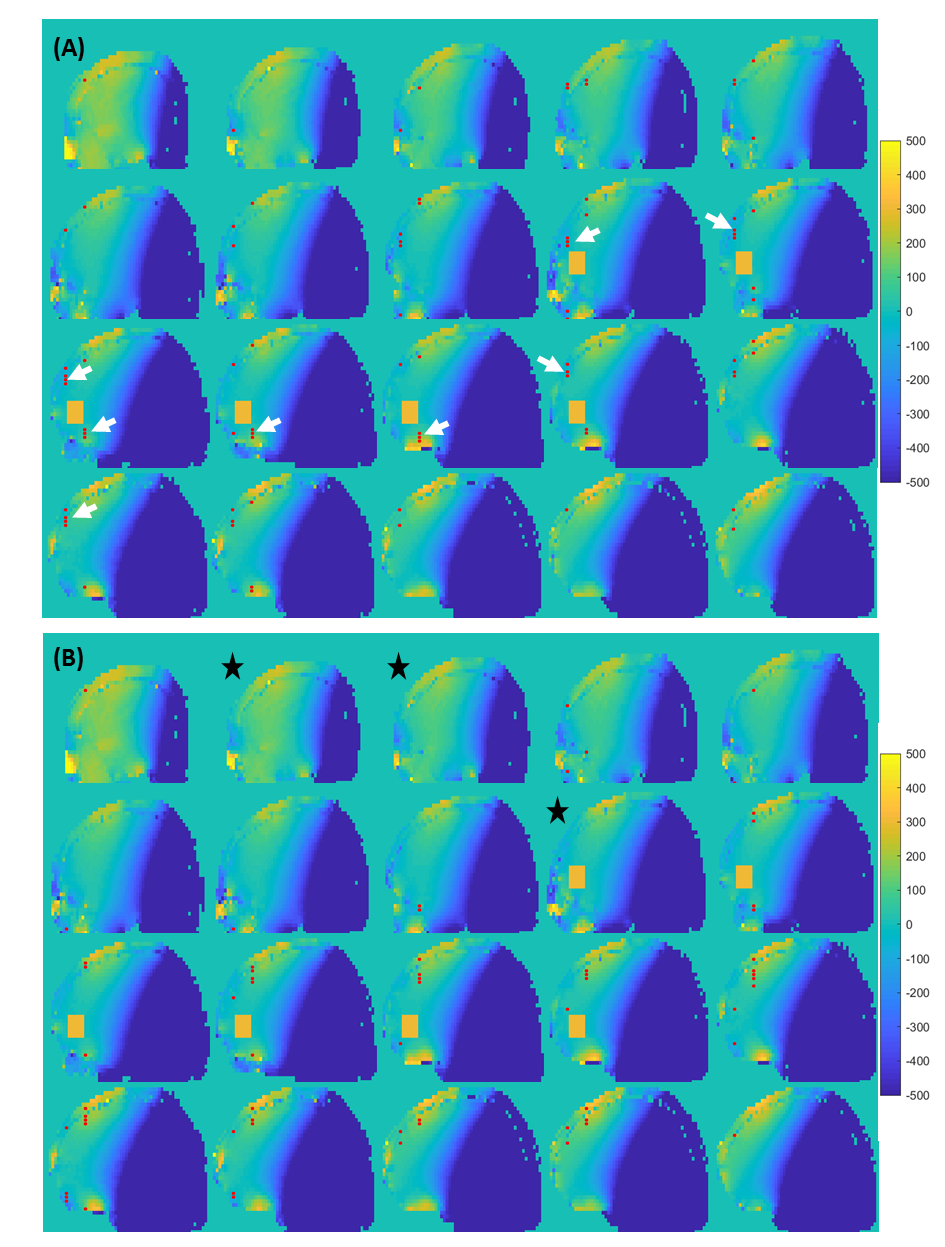
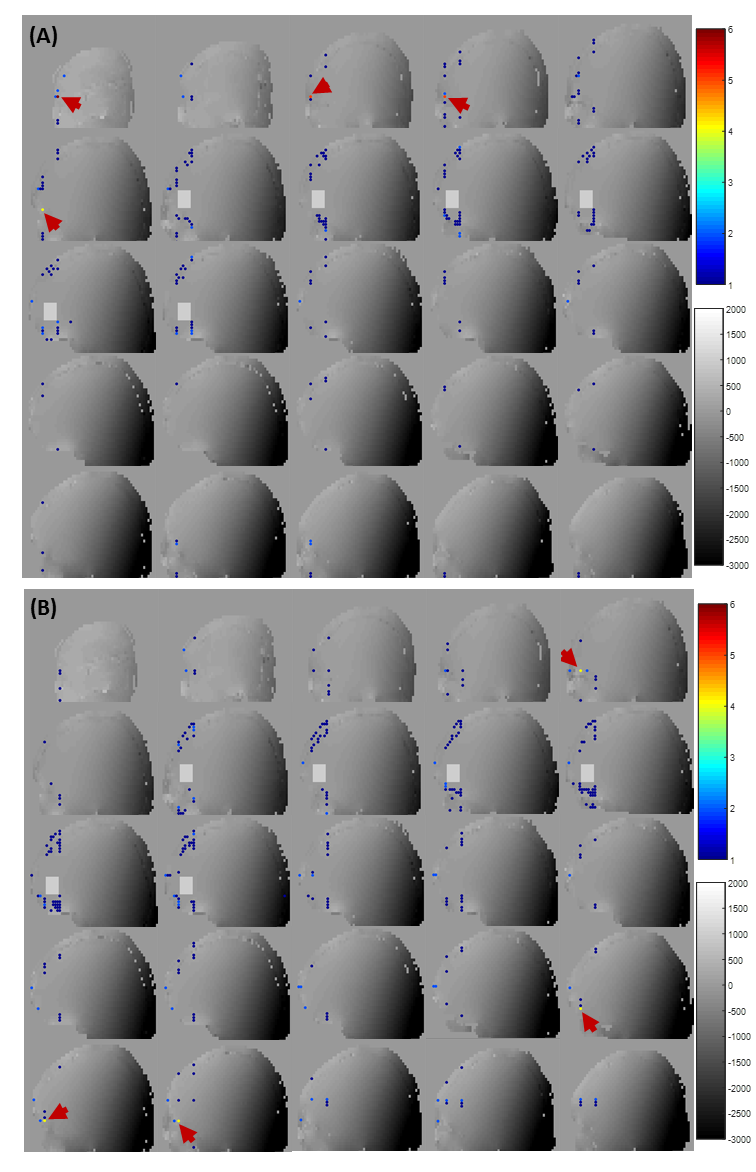
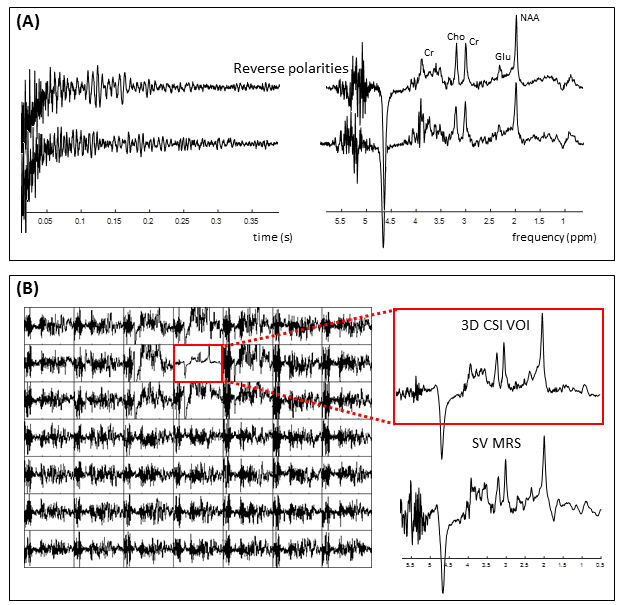
We first concentrate only on pathway [0 0 1 1 1] as this is the coherence pathway with the least total crushing amount, originating from areas 8-10-17-19 and 3-5-22-24 (Figure 1B). Figure 2A shows the locations where φinhom.gradient and φcrush of this pathway from regions 3-5-22-24 were canceled. In the slices close to and within the MRS voxel, clustered points are found in the transition areas. In the other slices, the voxels causing potential artifact are most densely packed in the vicinity of the skull or in the high B0-gradient area of the air cavity. Less voxels of potential artifact were detected by reversing the polarity (Figure 2B). To quantify the effect of all coherence pathways, MIPs are shown in Figure 3. The highest number of voxels causing potential artifacts are located in the areas 8,10,17 and 19, where also most of the pathways originate from. By reversing the polarities, the voxels that lit up in more than five pathways disappeared. New artifact locations, however, emerged throughout the brain. Inverting the polarities of the gradients along one axis had led to a better spectral quality upfield of the water signal (Figure 4A). But, the peak height difference between Choline and Creatine between these two spectra is notable. The spectrum before polarity reversal exhibited a more genuine Choline and Creatine ratio. Furthermore, Figure 4A shows that stimulated echo artifacts are present in the time domain of the reverse polarity signal as well. The CSI data revealed that there are significant artifacts in the SV-MRS, even with an optimized crusher scheme. The CSI data confirmed that even when taking the point spread function into account, the artifacts in SV-MRS originate from outside of the VOI (volume of interest) (Figure 4B).Discussion and Conclusion
Our analysis allows to relate spurious echoes to their specific locations in B0 maps and therefore opens a new window to change the acquisition strategy based on the B0 map. By knowing where artifacts can possibly come from, one can decide on changing the gradient polarities (probably for some positions of the VOI), shim differently or increase crusher strength at the cost of echo-time and increased chance of peripheral nerve stimulation. This prior knowledge will help designing a crusher scheme that effectively sorts out the artifact from experimental data. Reversing all gradients polarities in a specific direction should not matter in theory. However, we showed that it can play a significant role in achieving improved localization, if the spatial B0 information is incorporated. Our method can facilitate MRS sequence design to be more robust to spurious echoes.Acknowledgements
We thank Eurostars IMAGINE for financial support.References
[1] Bain A. D. Coherence levels and coherence pathways in NMR. A simple way to design phase cycling procedures.J.Magn.Reson. 1984; 56, 418–427.
[2] Keeler J. Understanding NMR spectroscopy. Choice Rev. Online. 2006; 43, 43–5896–43–5896.
[3] de Graaf R. A. In Vivo NMR Spectroscopy. In Vivo NMR Spectroscopy (John Wiley & Sons, Ltd). 2019.
[4] Hennig J. Echoes—how to generate, recognize, use or avoid them in MR-imaging sequences. Part II: Echoes in imaging sequences. Concepts Magn. Reson. 1991; 3, 179–192.
[5] Landheer K. & Juchem C. Dephasing optimization through coherence order pathway selection (DOTCOPS) for improved crusher schemes in MR spectroscopy. Magn. Reson. Med. 2019; 81, 2209–2222.
[6] Landheer K. & Juchem C. Simultaneous optimization of crusher and phase cycling schemes for magnetic resonance spectroscopy: an extension of dephasing optimization through coherence order pathway selection. Magn. Reson. Med. 2020; 83, 391–402.
[7] Shams Z., Boer V.O., et al. Optimal and efficient crushing for semi-LASER at 7T – a comparison. in Proceedings of the 30th Annual Meeting ISMRM.2020; 4808.
[8] Gruetter, R. Automatic, localized in Vivo adjustment of all first‐and second‐order shim coils. Magn. Reson. Med. 29, 804–811(1993).
Figures