0665
Left-Right Intensity Asymmetries Systematically Vary Across MR Scanners and Introduce Diagnostic Uncertainty1Mayo Clinic, Rochester, MN, United States
Synopsis
In magnetic resonance imaging (MRI) many factors can contribute to non-tissue specific image intensity inhomogeneity. However, the potential clinical impact or systematic biases of these effects have not been extensively investigated across multiple MRI vendors and models for neuroimaging applications. Specifically, left-right intensity comparisons are commonly used by radiologists to verify/identify pathology. If significant systematic left-right intensity asymmetries (LRIA) exist, it may lead to diagnostic uncertainty and result in unnecessary imaging follow-up and patient burden. This study shows that LRIA are common, system specific, systematic, can mimic disease, create diagnostic uncertainty, and can impact multiple sequences (T1-weighted and FLAIR).
Introduction
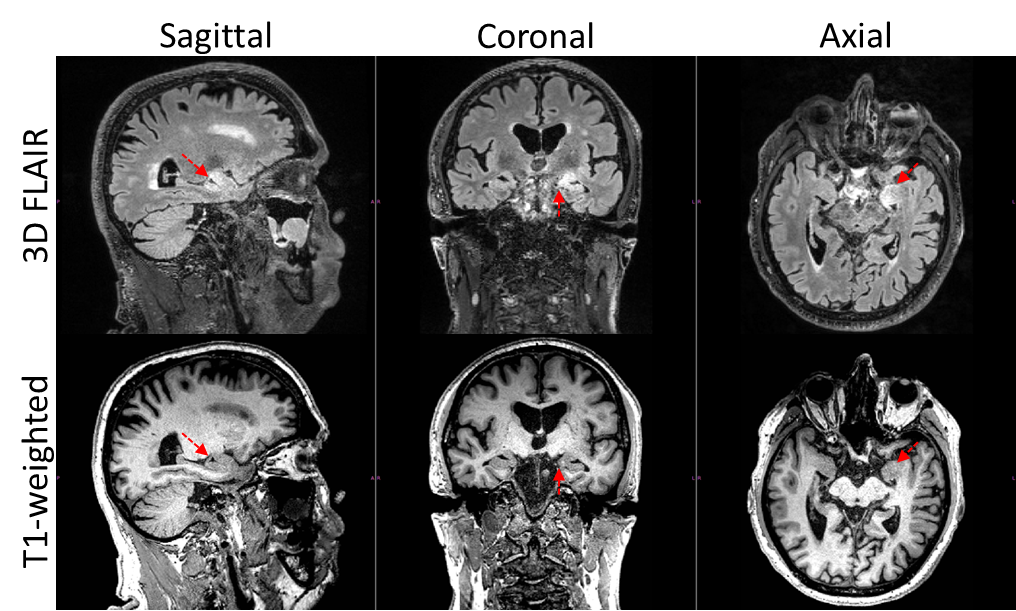
Localized regions of inhomogeneity were observed at our institution on a Mayo Clinic Study of Aging (MCSA) participant, on both T2 3D FLAIR and T1-weighted (T1-w) diagnostic images (Figure 1). These images lead to suspicion of potential herpes encephalitis and required unnecessary follow-up imaging. In magnetic resonance imaging (MRI) many factors can contribute to non-tissue specific image intensity inhomogeneity including static field inhomogeneity (Bo), non-linear gradients(1), gradient induced eddy currents, bandwidth filtering of data, and radio frequency transmission and reception inhomogeneity(2). Efforts to correct MRI intensity inhomogeneity date back to 1986(3,4); however, the potential clinical impact or the systematic biases that may occur on different MRI systems and models have not been extensively investigated for neuroimaging applications. Specifically, left-right intensity comparisons are commonly used by neuro-radiologists to identify pathology. Therefore, if significant non-biological systematic left-right intensities asymmetries (LRIA) exist, it may lead to diagnostic uncertainty and unnecessary patient burden. The first objective of this manuscript is to investigate if significant systematic LRIA exist for a range of scanner models in study participants from the Alzheimer’s Disease Neuroimaging Initiative (ADNI), where such variations are not expected to be pathological. The second objective of this study is to investigate if LRIA can introduce diagnostic uncertainty.Methods
T1-w and T2 FLAIR MRI were obtained from the ADNI phases 2, GO, and 3 (www.adni-info.org). We used all available pairs of 3T FLAIR MRI and 3T T1-weighted MRI. ADNI MRI acquisition protocols have been previously published (5-7). Images were downloaded, converted to NIfTI format, and 3D gradient inhomogeneity correction was additionally applied for images where it was not already applied on-scanner (1). For atlas segmentation purposes, T1-w MR images were corrected for intensity inhomogeneity and tissue-class probabilities were estimated by Unified Segmentation (8) in SPM12 with tissue priors and settings from the Mayo Clinic Adult Lifespan Template (MCALT; https://www.nitrc.org/projects/mcalt/) (9). Atlas regions were localized using Advanced Normalization Tools (ANTs) Symmetric Normalization (10) with the MCALT T1 template and ADIR122 atlas. To localize regions in FLAIR images, they were rigid-registered to T1-w images in SPM12. We additionally tested inhomogeneity correction using the ADNI “N3m” preprocessing pipeline that was used to preprocess T1-w images in ADNI 1-2 and refer to these as T1m images from hereon. This pipeline uses the N3 algorithm for intensity homogeneity (11), followed by additional correction using Unified Segmentation (8) in SPM5. To be consistent within this work, we used the same regional parcellations from the above SPM12/ANTs-based pipeline for estimating regional intensity values from these SPM5-based N3m images. Region mean intensity values for each image volume were used to calculate the percent difference (200*(left-right)/(left+right)) in each ROI. For each scanner model the percent difference value for each exam was computed separately for the following image types: 3D FLAIR, 2D FLAIR, T1-w, and T1m. To understand if asymmetry in left-right signal intensity impacted diagnostic uncertainty we conducted a diagnostic survey. Two radiologists (CRJ, JH) were shown thirty participants’ 3D FLAIR scans with hippocampal percent differences ranging from -22% to 33% as determined from the ROI analysis. Each radiologist gave separate scores (with a primary focus on the hippocampus) on the severity of LRIA (1(no-asymmetry) – 5 (severe asymmetry)) and assessed whether they would recommend clinical follow-up based on this LRIA.Results
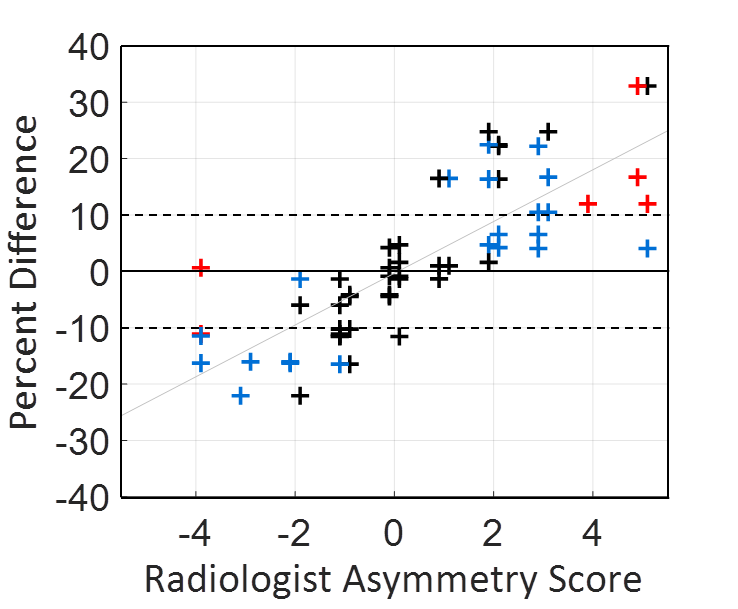
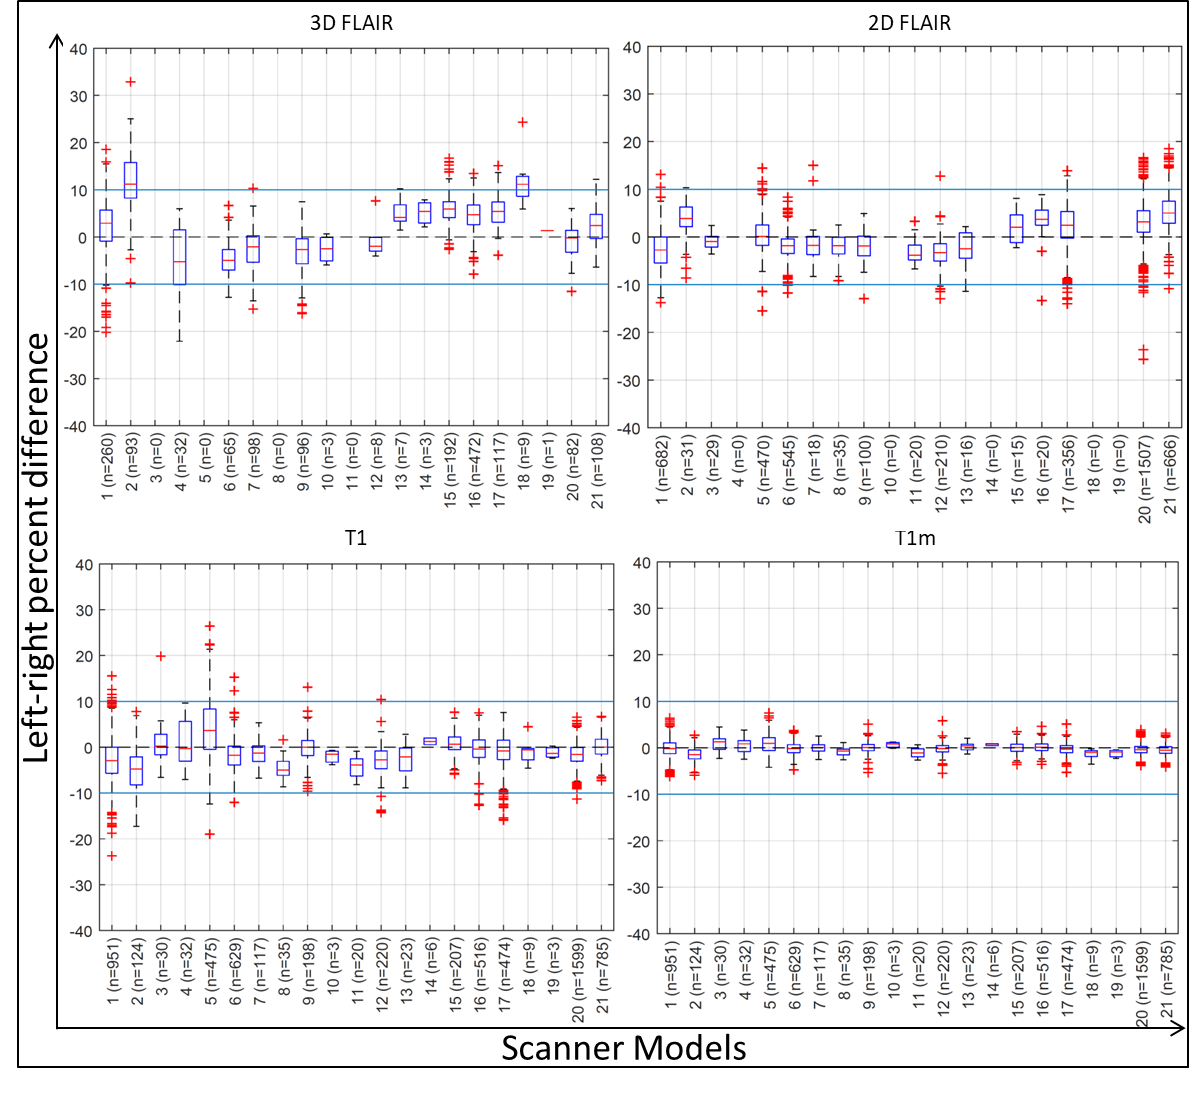
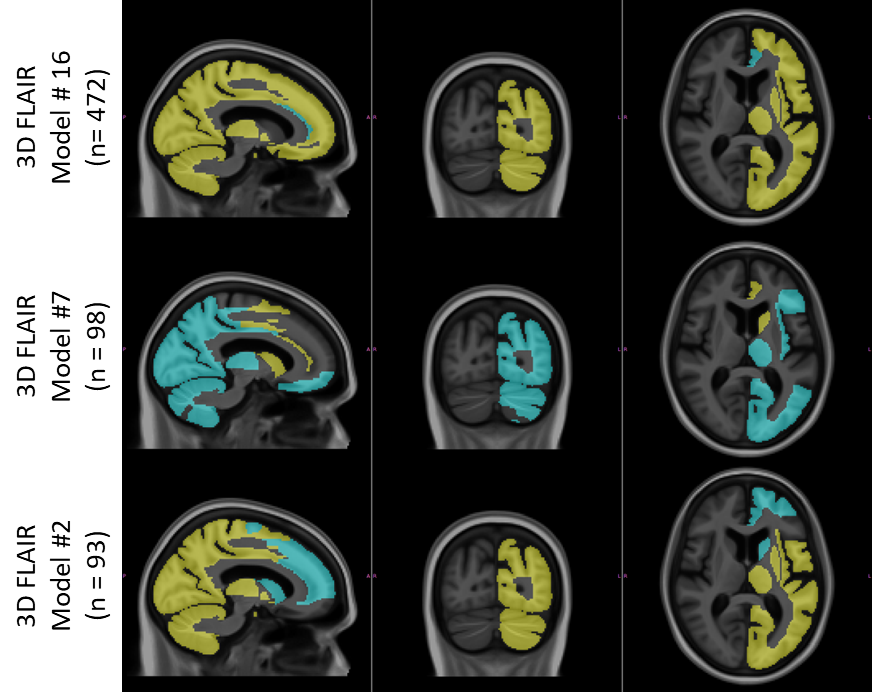
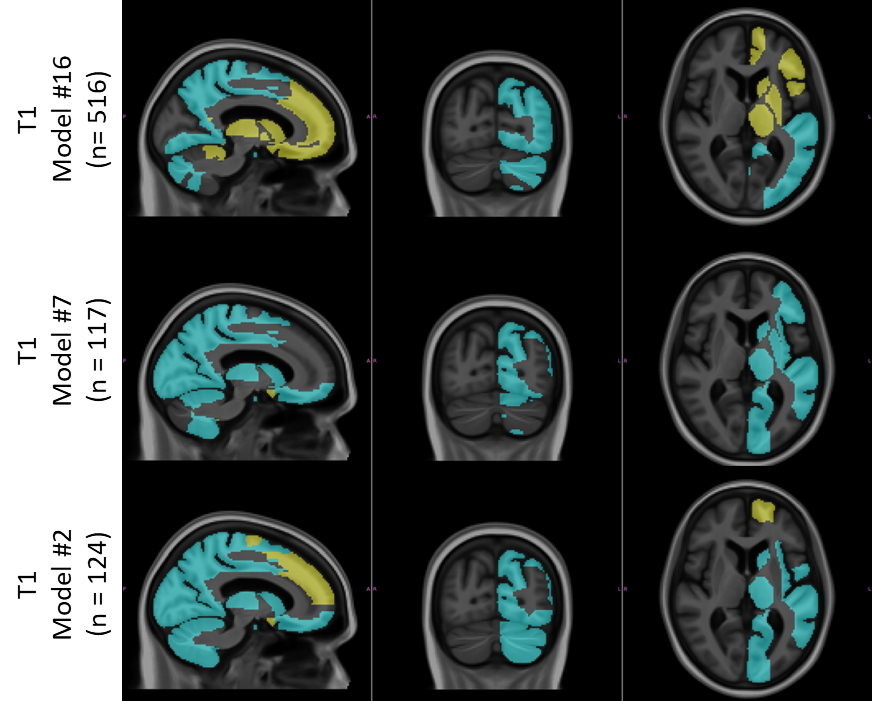
The radiologists’ assessment of LRIA and follow-up recommendations are shown in Figure 2. These results show that both clinicians were uncertain or would recommend definite diagnostic follow-up in 45% of cases, with 70% of these cases occurring when LRIA was above 10%. These images were all from a sample where this type of pathology is not expected. Percent difference in hippocampal intensities across different scanner models used in ADNI is shown in Figure 3. Twenty-one scanner models were used and the number of scans used in each box plot (n) has been reported in brackets. The boxes represent the 1st quartile, median, and 3rd quartiles, and the whiskers represent 1.5 standard deviations from the mean. Data points that fell outside 1.5 standard deviations from the mean are plotted (+). For 3 different scanner models the ROIs with statistically significant LRIA, after Bonferroni correction, are shown for 3D FLAIR (Figure 4) and T1-w (Figure 5) images. The yellow and blue overlays represent statistically significant left side intensity hyper- and hypo-intensities, respectively.Discussion and Conclusions
This study shows that LRIA can mimic disease and create uncertainty in diagnosis, resulting in unnecessary patient burden. Statistically significant LRIA exist across patients within specific scanner models for both T1-w and T2 FLAIR images. These results also suggest that the polarity of the left-right asymmetry can change, depending on the scanner model. The post-processing techniques used to obtain T1m volumes were shown to be capable of significantly improving LRIA (Figure 3), though they could potentially also remove some true pathology. Hardware and software physics-aware on-scanner inhomogeneity corrections, and lower tolerances in scanner calibrations, could potentially reduce the impacts of this phenomenon. Until that is possible, it is important that clinicians be aware of this phenomenon in order to reduce the risk of unnecessary patient burden.Acknowledgements
This work was supported by National Institutes of Health grants K12HD65987-11 and U19AG24904-15.References
1. Jovicich J, Czanner S, Greve D,
Haley E, van der Kouwe A, Gollub R, Kennedy D, Schmitt F, Brown G, MacFall J,
Fischl B, Dale A. Reliability in multi-site structural MRI studies: Effects of
gradient non-linearity correction on phantom and human data. NeuroImage
2006;30(2):436-443.
2. Vovk U, Pernus F, Likar B. A Review
of Methods for Correction of Intensity Inhomogeneity in MRI. IEEE transactions
on medical imaging 2007;26(3):405-421.
3. Haselgrove J, Prammer M. An
algorithm for compensation of surface-coil images for sensitivity of the
surface coil. Magnetic resonance imaging 1986;4(6):469-472.
4. McVeigh ER, Bronskill MJ, Henkelman
RM. Phase and sensitivity of receiver coils in magnetic resonance imaging.
Medical physics 1986;13(6):806-814.
5. Jack CR, Bernstein MA, Borowski BJ,
Gunter JL, Fox NC, Thompson PM, Schuff N, Krueger G, Killiany RJ, DeCarli CS,
Dale AM, Carmichael OW, Tosun D, Weiner MW. Update on the Magnetic Resonance
Imaging core of the Alzheimer's Disease Neuroimaging Initiative. Alzheimer's
& Dementia 2010;6(3):212-220.
6. Jack CR, Jr., Bernstein MA, Fox NC,
Thompson P, Alexander G, Harvey D, Borowski B, Britson PJ, J LW, Ward C, Dale
AM, Felmlee JP, Gunter JL, Hill DL, Killiany R, Schuff N, Fox-Bosetti S, Lin C,
Studholme C, DeCarli CS, Krueger G, Ward HA, Metzger GJ, Scott KT, Mallozzi R,
Blezek D, Levy J, Debbins JP, Fleisher AS, Albert M, Green R, Bartzokis G, Glover
G, Mugler J, Weiner MW. The Alzheimer's Disease Neuroimaging Initiative (ADNI):
MRI methods. Journal of magnetic resonance imaging : JMRI 2008;27(4):685-691.
7. Team TAMC. ADNI MRI SCANNER
PROTOCOLS. p WWW Document.
8. Ashburner J, Friston KJ. Unified
segmentation. NeuroImage 2005;26(3):839-851.
9. Schwarz CG, Gunter JL, Ward CP,
Vemuri P, Senjem ML, Wiste HJ, Petersen RC, Knopman DS, Jack Jr. CR. [P2–415]:
THE MAYO CLINIC ADULT LIFESPAN TEMPLATE: BETTER QUANTIFICATION ACROSS THE
LIFESPAN. Alzheimer's & Dementia 2017;13(7S_Part_16):P792-P792.
10. Avants BB, Epstein CL, Grossman M, Gee
JC. Symmetric diffeomorphic image registration with cross-correlation:
Evaluating automated labeling of elderly and neurodegenerative brain. Medical
Image Analysis 2008;12(1):26-41.
11. Sled
JG, Zijdenbos AP, Evans AC. A nonparametric method for automatic correction of
intensity nonuniformity in MRI data. IEEE transactions on medical imaging
1998;17(1):87-97.
Figures