0660
Machine Learning Evaluation of the Effects of Prematurity on Regional BOLD Resting-State Activity and Connectivity, and T1-w Brain Volumes.1Department of Neuroscience, Imaging and Clinical Sciences, University G. D'Annunzio of Chieti Pescara, Chieti Scalo, Italy
Synopsis
We used Machine Learning (ML) to infer gestational age (GA) at birth, and hence, as a metric of prematurity extent, assess its effect, in 88 premature infants using T2*-w BOLD resting-state connectivity and activity, and T1-w volume in 90 brain regions. ML was able to infer GA at birth. Analysis of the spatial distribution of effects indicated that volumetric alterations, in common with BOLD activity, are partially localized to subcortical structures, but are associated with widespread alterations of connectivity. Our results suggest a potential role for ML in early prediction of neurodevelopmental outcome based on BOLD and anatomical MRI metrics.
Introduction
Recent improvements in neonatal healthcare have reduced the incidence of brain damage and increased the survival rate of premature newborns. However, even without evident alteration at standard neuroimaging, this population is still at risk of poor neurodevelopment1. Identifying improved markers of altered brain development may help to guide treatment2. Advanced MRI, for example based on functional BOLD signal, has been used to investigate regional alterations in preterm brains3. However, the literature reports discrepancies, e.g. subcortical4 vs. cortical5,6 involvement, plausibly reflecting distinct a-priori emphasis on brain regions. Machine Learning (ML)7 may overcome analysis biases and it can account for inter-regional dependencies. We used a ML framework to infer gestational age (GA) at birth, and assuming it as a metric of prematurity, assess its effect in different ROIs covering the whole brain, based on T2*-w BOLD resting-state functional connectivity (rsFC), resting-state functional connectivity density (rsFCD), functional activity (fractional ALFF, fALFF)8, and T1-w tissue volume.Methods
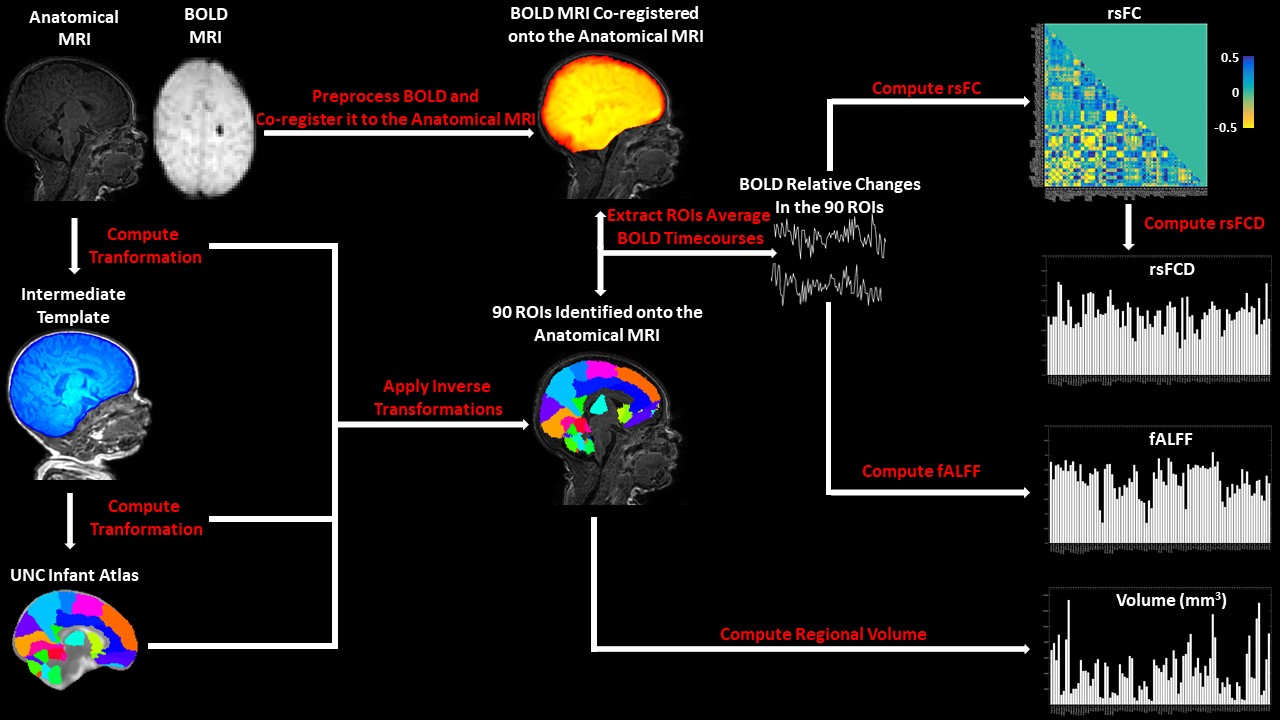
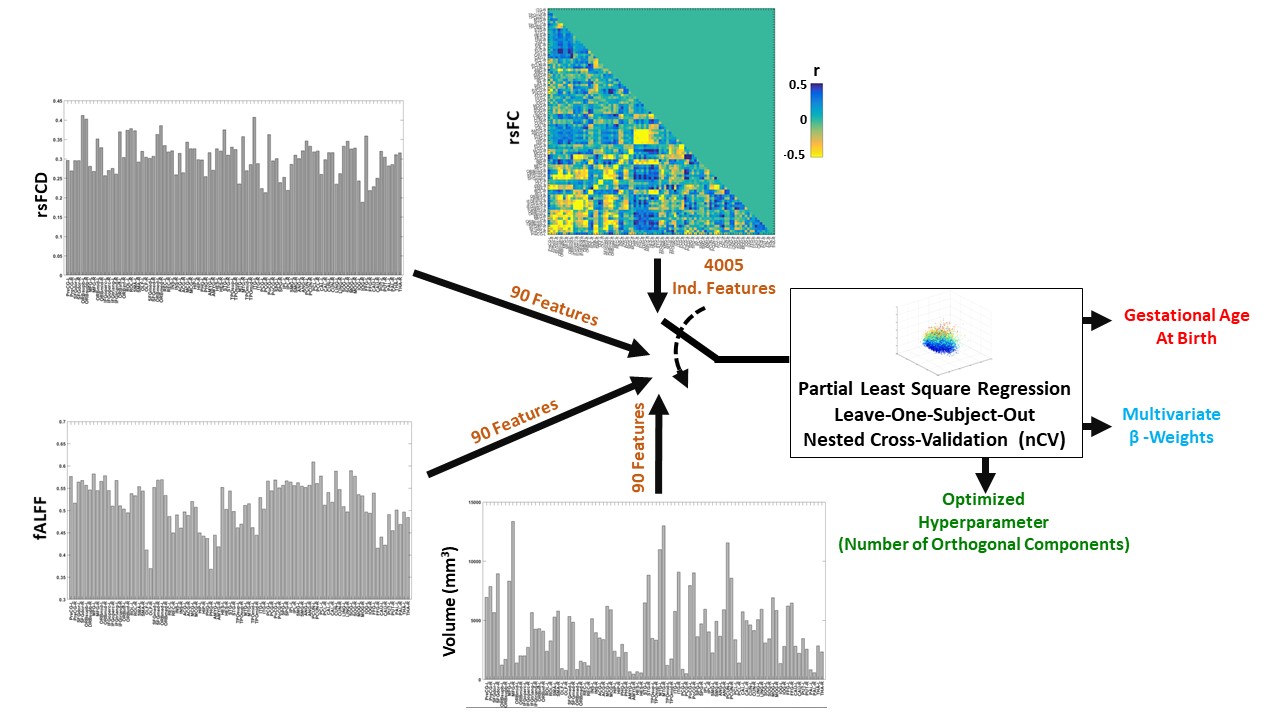
A total of 88 infants without neurological abnormalities, born between 25 and 40 weeks of gestational age (GA), (43/88 female, 15/88 >37 weeks) were recruited from the Neonatology Unit of the University Hospital of Chieti. MRI was performed at term-equivalent age with a 3 T whole-body system (Achieva3.0 T X-Series) from Philips Healthcare using an 8-channel receiver coil. Neonates were sedated with 0.05 mg/kg of oral Midazolam. A T1-w sagittal image (Flip Angle: 8°; TR: 9 ms; TE: 4.2 ms; voxel size: 1×1×1 mm3; FOV: 200×200×150 mm3) and 162, whole-brain, BOLD T2*-w EPI axial volumes (Flip Angle: 90°; TR: 1555 ms; TE: 30 ms; voxel size: 2.5×2.5×3mm3; FOV: 180×180×75 mm3; slice gap: 0 mm) were acquired at rest. MRI processing, performed using standard FSL9, AFNI10 and ANTs11 tools, is reported in Figure 1. Ninety subcortical and cortical ROIs were evaluated based on the University of North Carolina (UNC) infant atlas12 warped to each subject’s brain anatomy. RsFC matrices were built through pairwise correlations of BOLD signals among ROIs (4005 independent connections) accounting for whole-brain signal regression. RsFC density (rsFCD) was evaluated as the square root of the row average of the squared RsFC matrix. fALFF, which we describe here as ‘BOLD activity’ was evaluated as the ratio between the BOLD power within 0.01- 0.1 Hz and its total power8 . Regional volume was inferred using deformation based morphometry (DBM)13. A ML framework was implemented to infer GA at birth from the different feature spaces (Figure 2). To account for the large numerosity and collinearity of independent features, a partial least square (PLS) regression14 was used. In order to optimize the number of PLS components and to evaluate the algorithm performance, a leave-one-out nested cross validation (nCV)15 was employed.Results
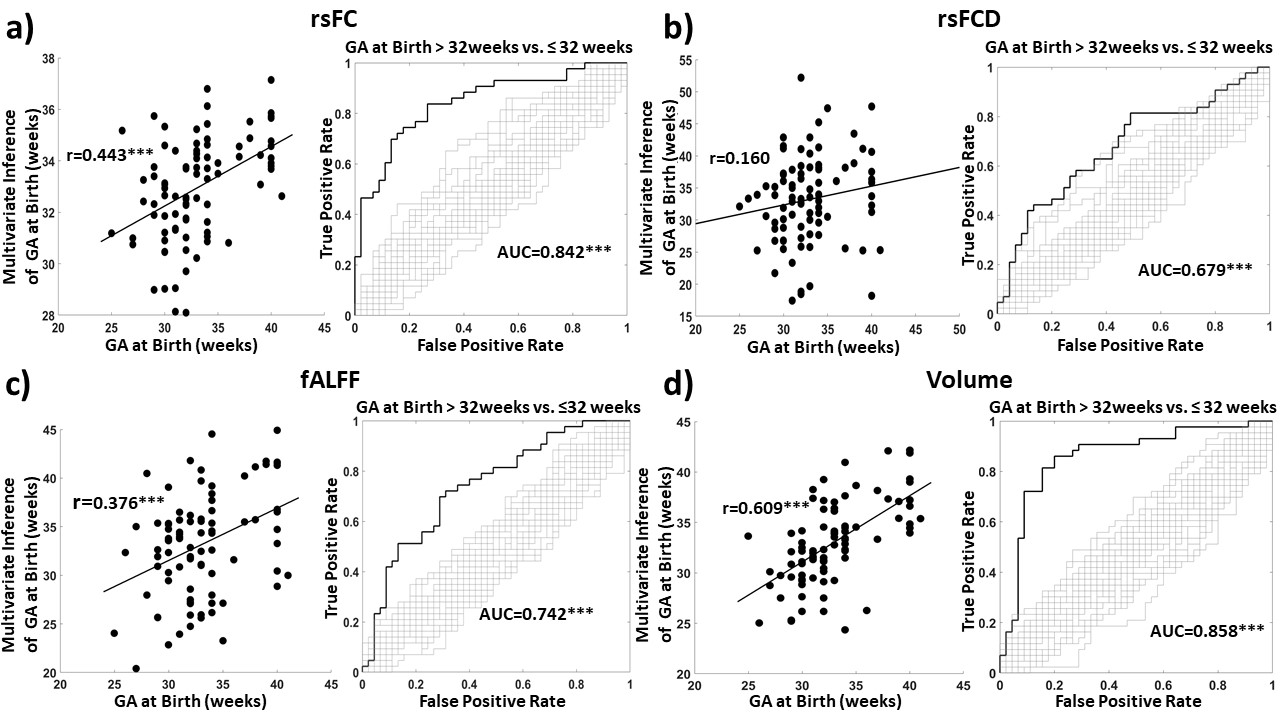
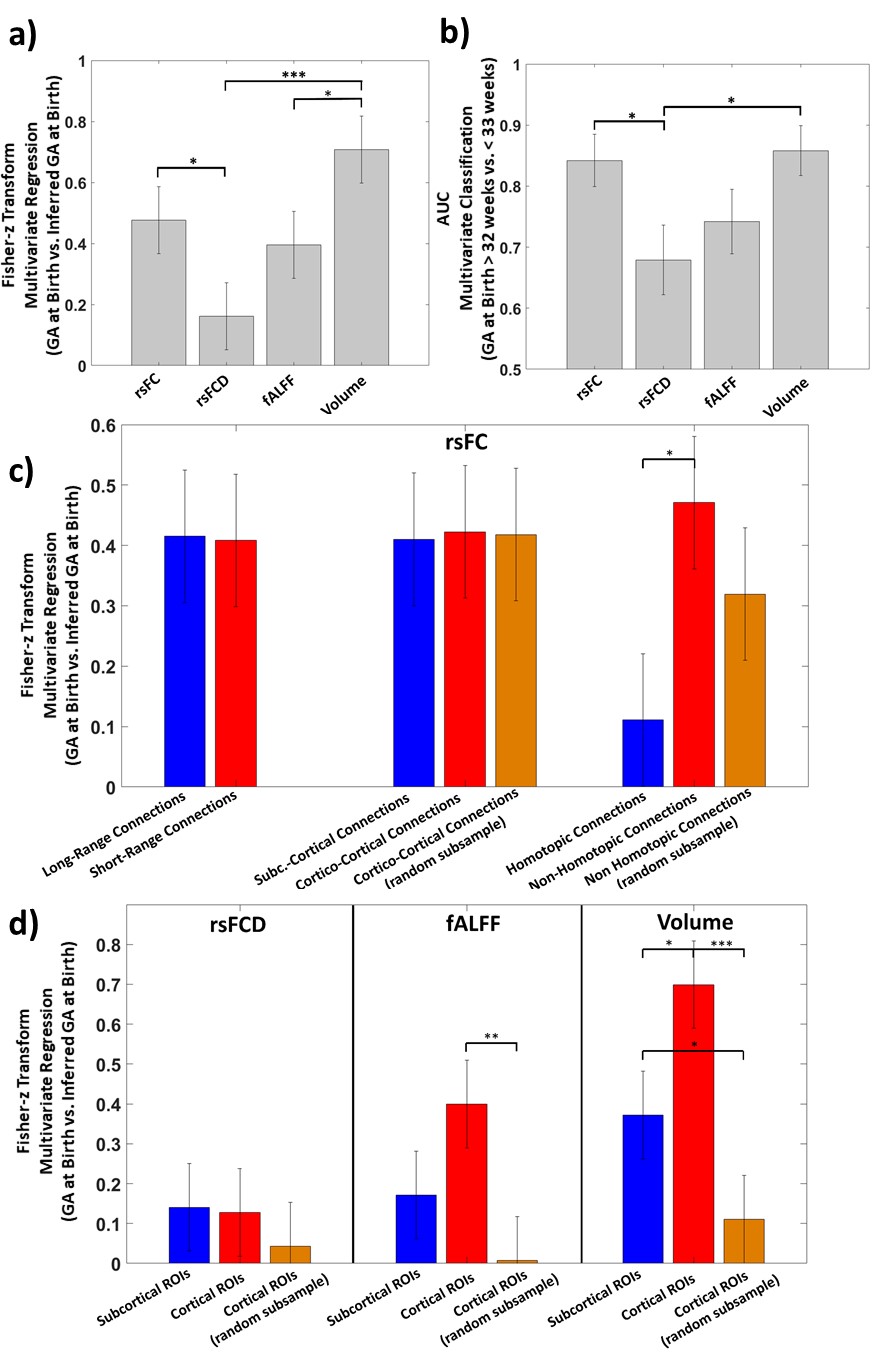
Figure 3 shows the results of the nCV ML framework used in a regression (with GA expressed in weeks) and a classification (GA at Birth > 32weeks vs. ≤ 32 weeks) analysis. ML could infer GA at birth relying on the MRI metrics. Figure 4a-b illustrates the results of performance comparison. RsFC had better regression performance compared to rsFCD (z=2.0265, p=0.0215) and the performance of regional volume was higher than that of fALFF (z=2.00, p=0.0224) and rsFCD (z=3.517, p=2.28·10-4). The comparison of classification performance indicated a significantly lower performance of rsFCD compared to both rsFC (z=-2.278, p=0.0114) and regional volume (z=-2.5474, p=5.5·10-3). Figure 4c shows the difference in performance when using subgroups of connections or ROIs. Homotopic connections (N=45) appeared to perform less well than non-homotopic connections (N=3960, z=-2.32, p=0.01), but the effect did not reach statistical significance when controlling for subgroup numerosity. Figure 3d shows the results obtained for regional metrics divided based on subcortical (N=8) and cortical (N=82) ROIs. A higher performance was obtained with volume for cortical with respect to subcortical ROIs (z=2.11, p=0.02). The effect reversed when controlling for numerosity (z=-1.69, p=0.05). A similar, albeit statistically weaker, pattern was also observed for fALFF.Discussion
ML was able to infer GA at birth (used as a metric of degree of prematurity) using T2*-w BOLD metrics of brain activity and connectivity and T1-w metrics of brain volume. ML indicated that rsFC was the BOLD feature most sensitive to prematurity. The prediction capability of rsFC vanished when collapsing the information of rsFC into rsFCD. The results suggested a highly diffused effect of prematurity on rsFC. In contrast, ML indicated that a significant alteration with prematurity was found for regional volume, albeit not exclusively, in subcortical regions and a similar pattern was obtained for fALFF.Conclusion
The present study, relying on ML, demonstrated that prematurity is associated with alterations of T2*-w BOLD functional connectivity and T1-w regional brain volume, and, to a lesser extent, with modification of BOLD brain activity. The analysis of the spatial distribution of the effects indicated that MRI structural alterations, which have some degree of locality involving subcortical structures, are associated with a widespread effect on BOLD functional connectivity. The high sensitivity of ML in identifying the complex effects of GA at birth on multiple MRI metrics of the brain suggests that ML may be a suitable method for the early prediction of neurodevelopmental outcome based on BOLD and anatomical MRI metrics.Acknowledgements
This work was partially conducted under the framework of the Departments of Excellence 2018–2022 initiative of the Italian Ministry of Education, University and Research for the Department of Neuroscience, Imaging and Clinical Sciences (DNISC) of the University of Chieti-Pescara, Italy.References
1. Mento, G. & Nosarti, C. The case of late preterm birth: sliding forwards the critical window for cognitive outcome risk. Transl. Pediatr. 4, 214–218 (2015).
2. Rogers, C. Addressing the Psychosocial Risk Factors Affecting the Developing Brain of the High-Risk Infant Bringing Science to Law and Policy. Wash. Univ. J. Law Policy 57, 117–132 (2018).
3. Zhang, H., Shen, D. & Lin, W. Resting-state functional MRI studies on infant brains: A decade of gap-filling efforts. NeuroImage 185, 664–684 (2019).
4. Ball, G. et al. Thalamocortical Connectivity Predicts Cognition in Children Born Preterm. Cereb. Cortex 25, 4310–4318 (2015).
5. Smyser, C. D. et al. Prediction of brain maturity in infants using machine-learning algorithms. NeuroImage 136, 1–9 (2016).
6. Smyser, C. D. et al. Resting-State Network Complexity and Magnitude Are Reduced in Prematurely Born Infants. Cereb. Cortex 26, 322–333 (2016).
7. Hastie, T., Tibshirani, R. & Friedman, J. The Elements of Statistical Learning: Data Mining, Inference, and Prediction, Second Edition. (Springer-Verlag, 2009).
8. Zou, Q.-H. et al. An improved approach to detection of amplitude of low-frequency fluctuation (ALFF) for resting-state fMRI: Fractional ALFF. J. Neurosci. Methods 172, 137–141 (2008).
9. Jenkinson, M., Beckmann, C. F., Behrens, T. E. J., Woolrich, M. W. & Smith, S. M. FSL. NeuroImage 62, 782–790 (2012).
10. Cox, R. W. AFNI: software for analysis and visualization of functional magnetic resonance neuroimages. Comput. Biomed. Res. Int. J. 29, 162–173 (1996).
11. Avants, B. B. et al. A reproducible evaluation of ANTs similarity metric performance in brain image registration. NeuroImage 54, 2033–2044 (2011).
12. Shi, F. et al. Infant Brain Atlases from Neonates to 1- and 2-Year-Olds. PLOS ONE 6, e18746 (2011).
13. Ashburner, J. et al. Identifying global anatomical differences: Deformation-based morphometry. Hum. Brain Mapp. 6, 348–357 (1998).
14. Abdi, H. & Williams, L. J. Partial Least Squares Methods: Partial Least Squares Correlation and Partial Least Square Regression. in Computational Toxicology: Volume II (eds. Reisfeld, B. & Mayeno, A. N.) 549–579 (Humana Press, 2013). doi:10.1007/978-1-62703-059-5_23.
15. Filzmoser, P., Liebmann, B. & Varmuza, K. Repeated double cross validation. J. Chemom. 23, 160–171 (2009).
Figures