0657
Detection of fine-scale functional networks in spinal cord and the effects of injury on intra- and inter-segmental networks1Vanderbilt University Medical Center, Nashville, TN, United States
Synopsis
The objective of this study was to identify fine-scale resting state functional networks within the spinal cord gray matter of squirrel monkeys, and measure the changes in functional connectivity within the cord after a targeted injury. Independent Component Analysis of resting state fMRI data detected robust BOLD signals localized at the bilateral intermediate and gray-commissure regions of the spinal cord as well at the ‘4 horns’. A unilateral section of dorsal column tract at C5 segment of spinal cord damaged the inter-segmental connectivity more than intra-segmental connectivity, as observed through individual connectivity measures and community structures generated by graph-theory principles.
INTRODUCTION
Robust measures of functional connectivity based on correlations between blood-oxygenation-level-dependent (BOLD) signals in a resting state have been derived from gray matter (GM) within the spinal cord (SC) in several studies recently1-3. However, connectivity in SC has been interpreted in terms of relatively simple models, mainly confined to the four dorsal and ventral horns which are known to be responsible for transmission of sensory and motor signals to and from the brain2-4. We sought to extend our knowledge of the functional networks within SC GM beyond the ‘4 horn model’ by adopting a data-driven method of analysis that does not require a priori identification of seed regions of interest (ROI). Independent Component Analysis (ICA) was used to identify clusters of voxels that show temporal synchrony in BOLD fluctuations independent of other clusters, within the gray matter of the SC of squirrel monkeys and these were used as seed locations for subsequent evaluations of connectivity within/intra and between/inter spinal segments5. Changes in network organization and connectivity at intra and inter-segmental level were also measured after a targeted injury to the spine, at various stages of recovery.METHODS
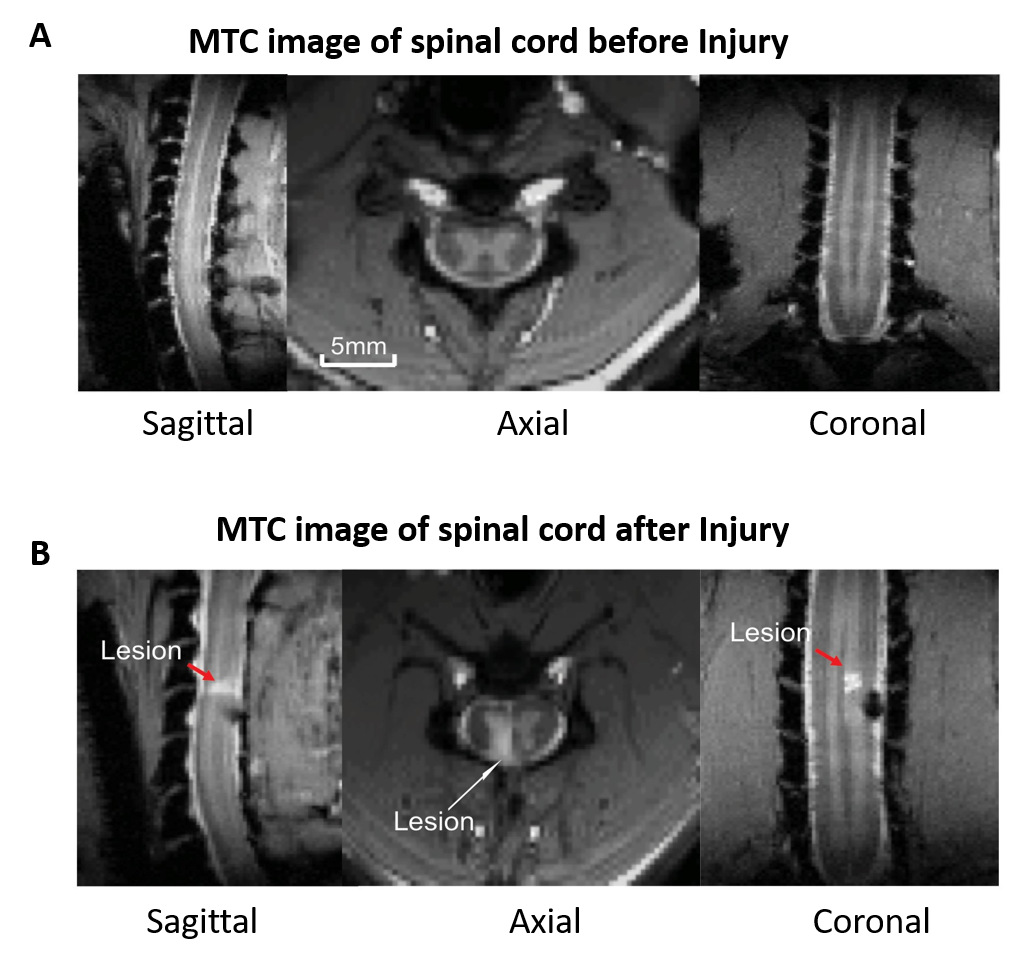
Images of five axial slices, covering C3-C7 cervical segments of anaesthetized squirrel monkeys were acquired using a custom neck coil by an Agilent 9.4T scanner. Resting state fMRI data (300 dynamics,14 runs from 5 monkeys) were acquired using a fast gradient echo sequence (flip angle = ~18°, TR = 46.88ms, TE: 6.5ms, 3s per volume). Data were acquired before and after a unilateral surgical transection of dorsal column at C5 level (Fig1). Post SC injury (SCI), data were collected at three time-points: after 2weeks, 7-8weeks and 16-22weeks. Motion, physiological signal correction (RETROICOR) and band pass filtering (0.01-0.1 Hz) were performed on the fMRI data, followed by co-registration to a customized template using FSL to facilitate group level analyses6,7. Group spatial ICA was performed by temporal concatenation of all the data using GIFT software, and thirty-five spatially independent components were extracted within the butterfly-shaped gray-matter region of SC5. Next, thirty-four ROIs were identified across the five spine segments by visual inspection of each component’s spatial profile. Connectivity was measured between ROI pairs as the correlation of time courses of IC pairs. Connectivity values between FDR corrected significant ROIs (p<0.05) were computed before and at different time points after injury, followed by statistical tests for comparison. Next, graph-theory analysis was performed to generate community structures based on connectivity measures, which depicted functional network organization within and across the spinal segments8. Finally, the connectivity matrix was rearranged such that the connectivities within each community are next to each other to illustrate the community behavior.RESULTS
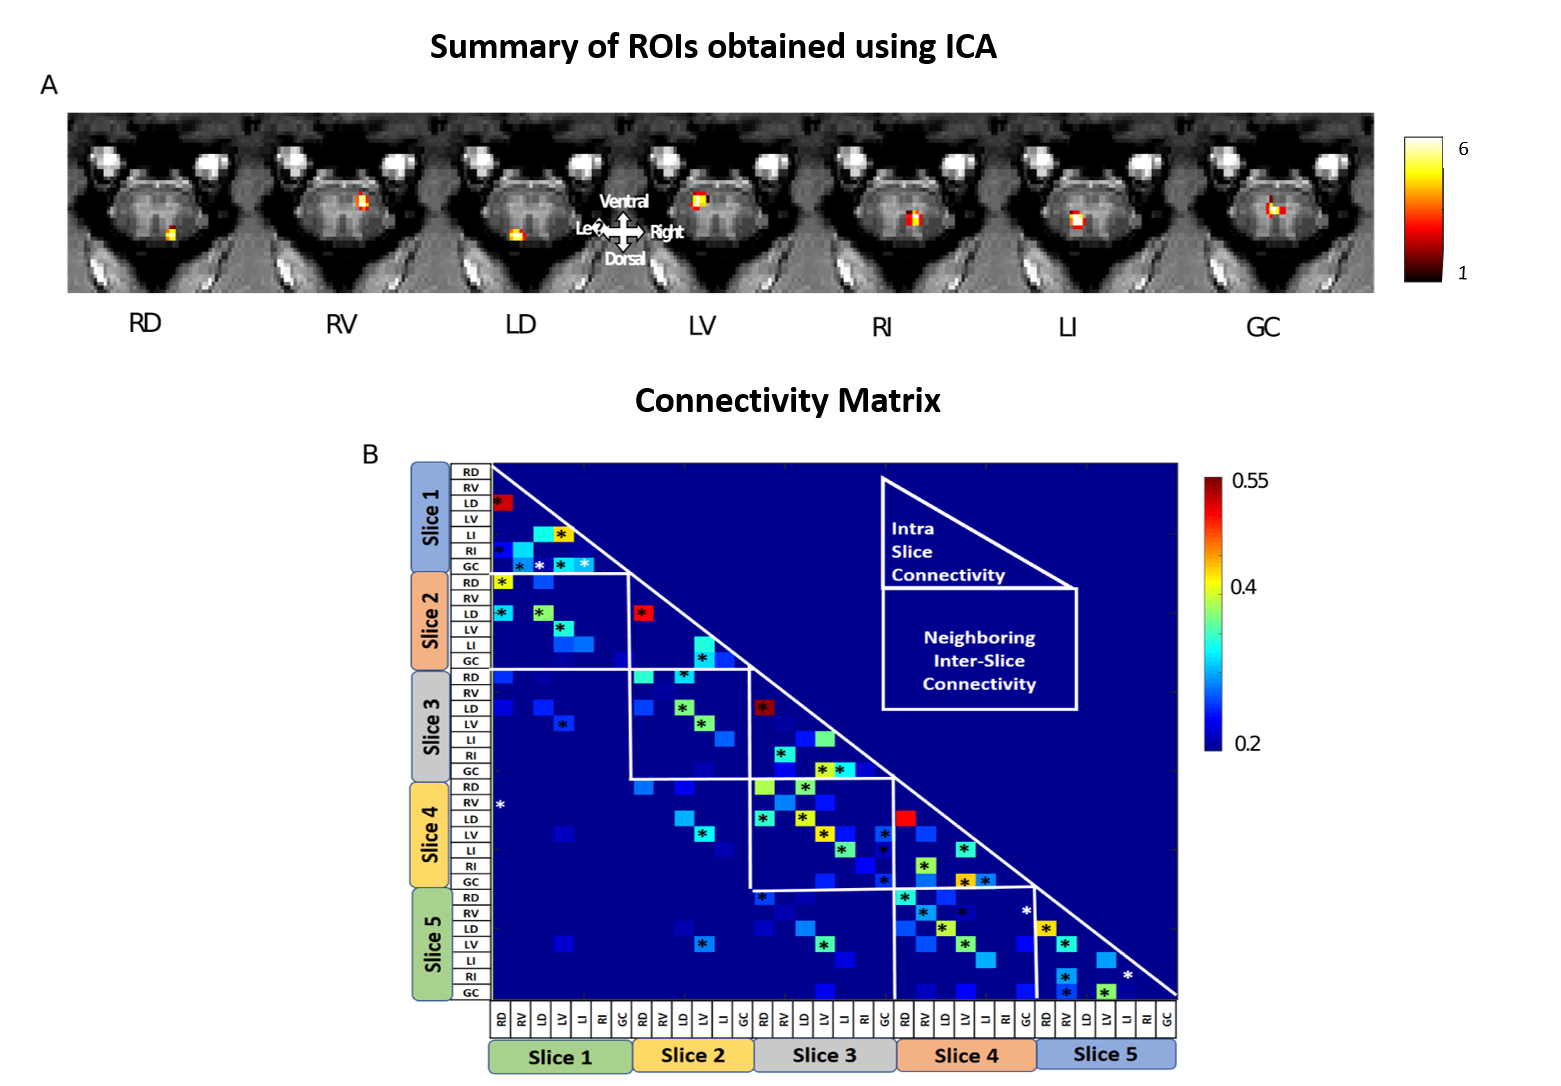
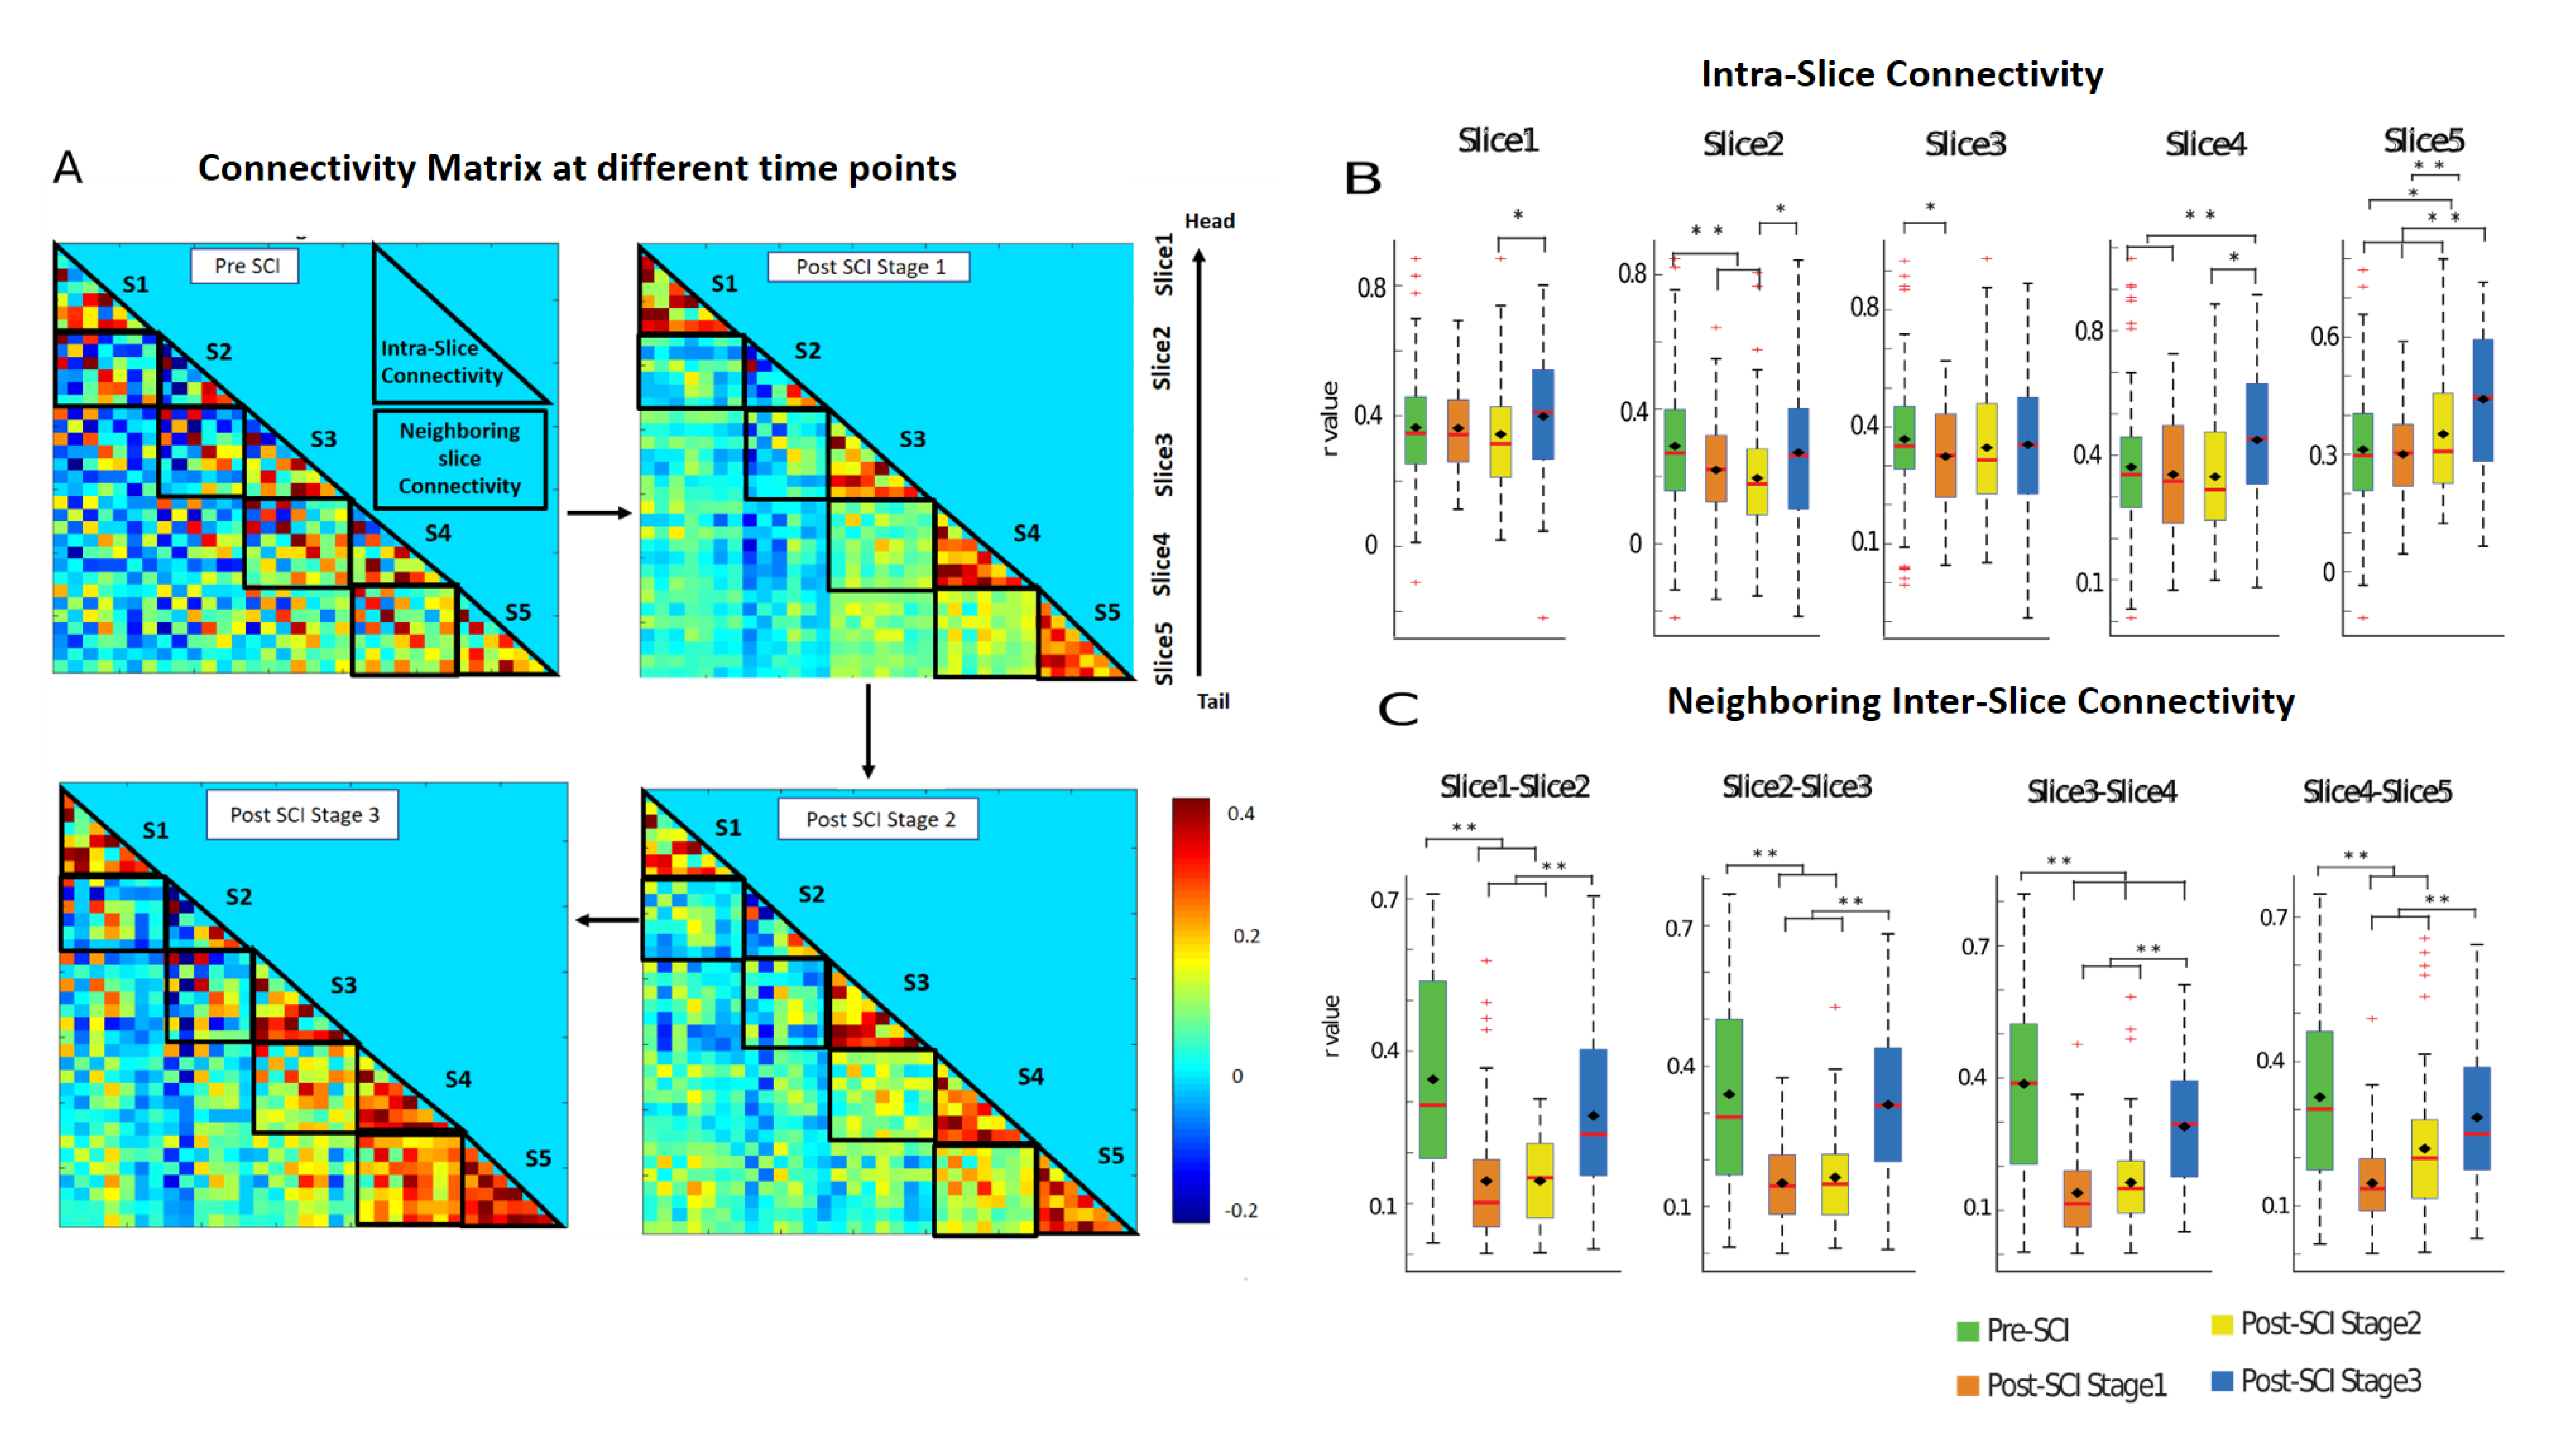
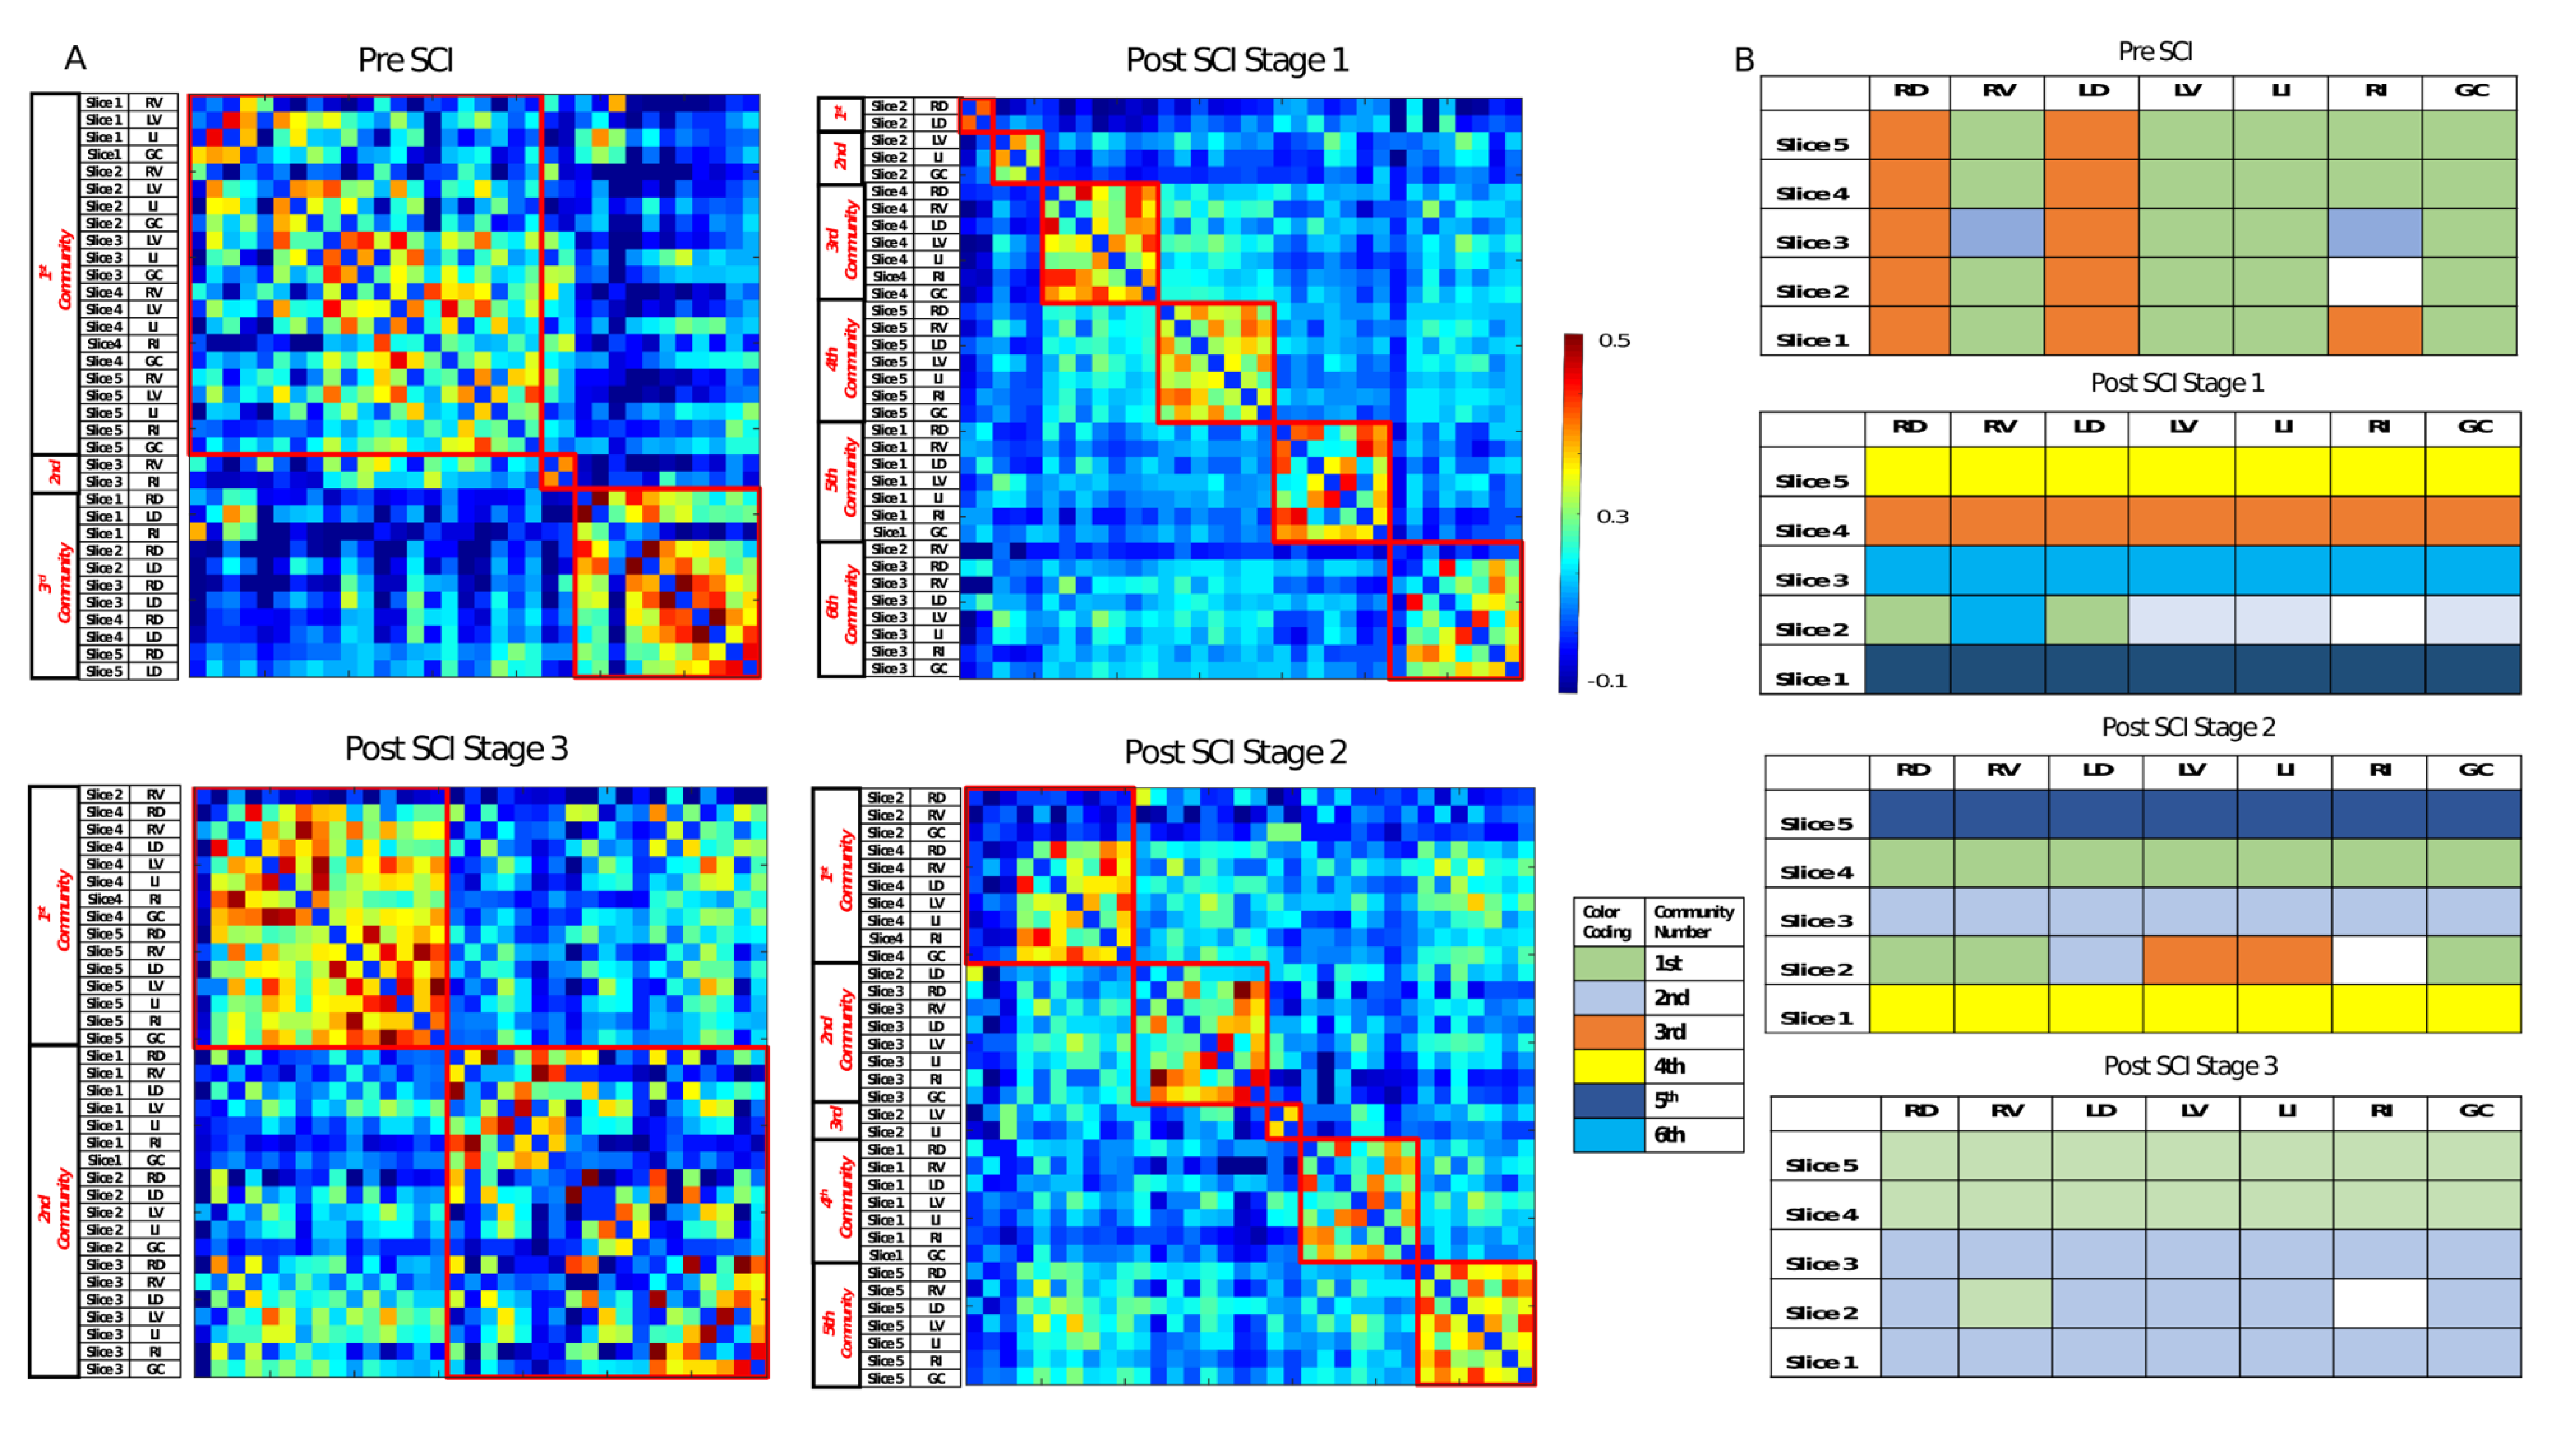
ICA decomposed resting state fMRI data into seven spatially distinct ROIs in each spinal segment: bilateral dorsal horns, bilateral ventral horns, bilateral intermediate region which extended from the dorsal to the middle part of SC, and gray-commissure region, which is the thin strip of gray matter located at the central junction between the two hemi-cords, as shown for a representative slice in Fig2A. Significant intra-slice/intra-segment and neighboring inter-slice/inter-segment connectivities were noted and used for further analysis as depicted by the connectivity matrix (Fig2B). Fig3C shows that post-SCI there was a significant (p<0.05) drop in connectivity at Stage1, for all the neighboring inter-slice connectivities, whereas this was true for only Slices 2 & 3 for intra-slice connectivities (Fig3B). There was a gradual increase in both intra-slice and neighboring inter-slice connectivity over time after injury with all of them recovering back to normal values by the last time point (except Slice3-Slice4 neighboring slice connectivity). The communities formed from graph-theory depicted higher intra-community and lower inter-community connectivity as evident visually from the connectivity values of the rearranged connectivity matrix (Fig4A). Before injury, the community structure was spread within and across multiple slices/segments (Fig4B). Post SCI at Stages 1&2 the communities become confined to ROIs within each slice before starting to reappear at the inter-segment level by the last time point.DISCUSSION
Data-driven ICA analysis observed the presence of localized BOLD fMRI coherent fluctuations at the bilateral intermediate regions of cervical SC of monkeys which agrees with our recent findings of similar activity observed using electrophysiology9. The presence of strong localized connectivity at the gray commissural region possibly mediates communications between two sides of SC9,10. Targeted dorsal column lesion had a differential effect on intra-slice and neighboring inter-slice connectivity with the reduction in connectivity being more evident in the latter. This finding was also supported by graph-theory results which found that community structures were reduced to intra-segments post injury. Overall, graph-theory results suggest that SCI primarily damages inter-segment community formation which slowly reverts to baseline structure with time.CONCLUSION
This study highlights the presence of robust, correlated BOLD signals at the bilateral intermediate regions and gray-commissure regions of cervical spinal cord, in addition to the dorsal and ventral horns. This indicates the presence of a complex fine-scale intrinsic functional network in SC. A targeted injury damages inter-segment community formation and reduces connectivity primarily between the segments than within them. The connectivity measures returned to baseline by the last time point after injury which signifies recovery.Acknowledgements
This study is supported by NIH grant NS092961 and DOD grant SC160154.References
1. Barry, R. L., Smith, S. A., Dula, A. N. & Gore, J. C. Resting state functional connectivity in the human spinal cord. Elife 2014, 1–15 (2014).
2. Kong, Y. et al. Intrinsically organized resting state networks in the human spinal cord. Proc. Natl. Acad. Sci. U. S. A. 111, 18067–18072 (2014).
3. Chen, L. M., Mishra, A., Yang, P.-F., Wang, F. & Gore, J. C. Injury alters intrinsic functional connectivity within the primate spinal cord. Proc. Natl. Acad. Sci. 112, 5991–5996 (2015).
4. Barry, R. L., Rogers, B. P., Conrad, B. N., Smith, S. A. & Gore, J. C. Reproducibility of resting state spinal cord networks in healthy volunteersvolunteers at 7 Tesla. 31–40 (2017)
5. Calhoun, V. D., Adali, T., Pearlson, G. D. & Pekar, J. J. Group ICA of Functional MRI Data: Separability, Stationarity, and Inference. Proc. ICA 2001 155–160 (2001).
6. Glover, G. H., Li, T. Q. & Ress, D. Image-based method for retrospective correction of physiological motion effects in fMRI: RETROICOR. Magn. Reson. Med. 44, 162–167 (2000)
7. Jenkinson, M. & Smith, S. A global optimisation method for robust affine registration of brain images. Med. Image Anal. 5, 143–156 (2001).
8. Rubinov, M. & Sporns, O. Complex network measures of brain connectivity: Uses and interpretations. Neuroimage 52, 1059–1069 (2010).
9. Wu, T. L. et al. Intrinsic functional architecture of the non-human primate spinal cord derived from fMRI and electrophysiology. Nat. Commun. 10, 1–10 (2019).
10. Bannatyne, B. A., Edgley, S. A., Hammar, I., Jankowska, E. & Maxwell, D. J. Networks of inhibitory and excitatory commissural interneurons mediating crossed reticulospinal actions. Eur J Neurosci. 18, 2273–2284 (2003).
Figures