0656
Atlas-based Quantification of DTI measures in Typically Developing Pediatric Spinal Cord
Shiva Shahrampour1, Benjamin De Leener2, Mahdi Alizadeh1, Devon Middleton1, Laura Krisa1, Adam Flanders1, Scott Faro1, Julien Cohen-Adad2, and Feroze Mohamed1
1Thomas Jefferson University, Philadelphia, PA, United States, 2Polytechnique Montreal, Montreal, QC, Canada
1Thomas Jefferson University, Philadelphia, PA, United States, 2Polytechnique Montreal, Montreal, QC, Canada
Synopsis
White matter microstructure, essential for efficient and coordinated transmission of neural communications, undergoes pronounced development during the first years of life. Hence, systematic evaluation of white matter microstructure in the normative pediatric spinal cord is critical for assessing early development and improving diagnosis of spinal cord related diseases.
Background and Purpose:
The purpose of this work is three folds: 1) To develop a processing pipeline for atlas-based generation of healthy pediatric spinal cord white matter (WM) tracts. 2) Derive atlas based normative values of the diffusion tensor imaging (DTI) indices for various WM pathways. 3) Investigate age-related changes in the obtained normative DTI indices along the extracted tracts.Material and Methods:
DTI and high-resolution structural scans of 30 typically developing (TD) subjects were acquired axially covering the cervical and thoracic spinal cord on a 3T MRI scanner. All the data analysis was performed within the framework of the Spinal Cord Toolbox (SCT)1.The data was initially registered to a standard template within SCT (PAM 50)2. Next a series of affine transformations was applied to co-register the PAM50 WM atlas to the individual subject space. The DTI indices for various WM regions were extracted at a single slice centered at the C3 vertebral body in all the 30 subjects. An ANOVA test was performed to examine the effect of the following: i) laterality of the selected tract, ii) functionality of the chosen pathway, and iii) effect of age with DTI-derived indices in various WM regions. Linear regression analysis was used to evaluate the correlation between age and DTI measures.Results:
A post processing pipeline was developed to delineate pediatric spinal cord WM tracts (Figure 1). The white matter columns and their associated normative DTI indices were automatically extracted for 34 regions of interest (ROI) identified in PAM50 template. This includes 30 individual labels representing sensory and motor tracts, three combined labels of dorsal funiculi (DF), lateral funiculi (LF) and ventral funiculi (VF) and one label representing the entire WM itself (Figure 2). A subset of prominent tracts (right/left corticospinal tract (CST), right/left fasciculus cuneatus (FC) and right/left fasciculus gracilis (FG)) were selected and overlaid on a b0 image (Figure 3). The results of ANOVA on FA values showed no effect for laterality (p=0.72) but an effect for functionality (p= 0.0003) when comparing the 30 primary WM labels. There was a significant difference (p<0.05) between age and left spinothalamic tract on MD, RD and AD values. The results of linear regression analysis revealed a positive correlation between age and FA in DF (r=0.002), LF(r=0.009), and VF (r=0.0126) regions (Figure 4). This correlation was negative for MD, RD and AD indices.Conclusion:
To the best of our knowledge, this work is the first to show atlas based DTI quantification of WM tracts in the typically developed pediatric spinal cord. The automated pipeline incorporates unique post-processing steps, followed by template registration and quantification of DTI metrics using atlas-based regions. This method eliminates the need for manual ROI analysis of various WM tracts and therefore increases accuracy and speed of the measurements.Acknowledgements
No acknowledgement found.References
[1]: De Leener, Benjamin, et al. "SCT: Spinal Cord Toolbox, an open-source software for processing spinal cord MRI data." Neuroimage 145 (2017):24-43.[2]: De Leener, Benjamin, et al. "PAM50: Unbiased multimodal template of the brainstem and spinal cord aligned with the ICBM152 space." Neuroimage 165 (2018): 170-179.
Figures
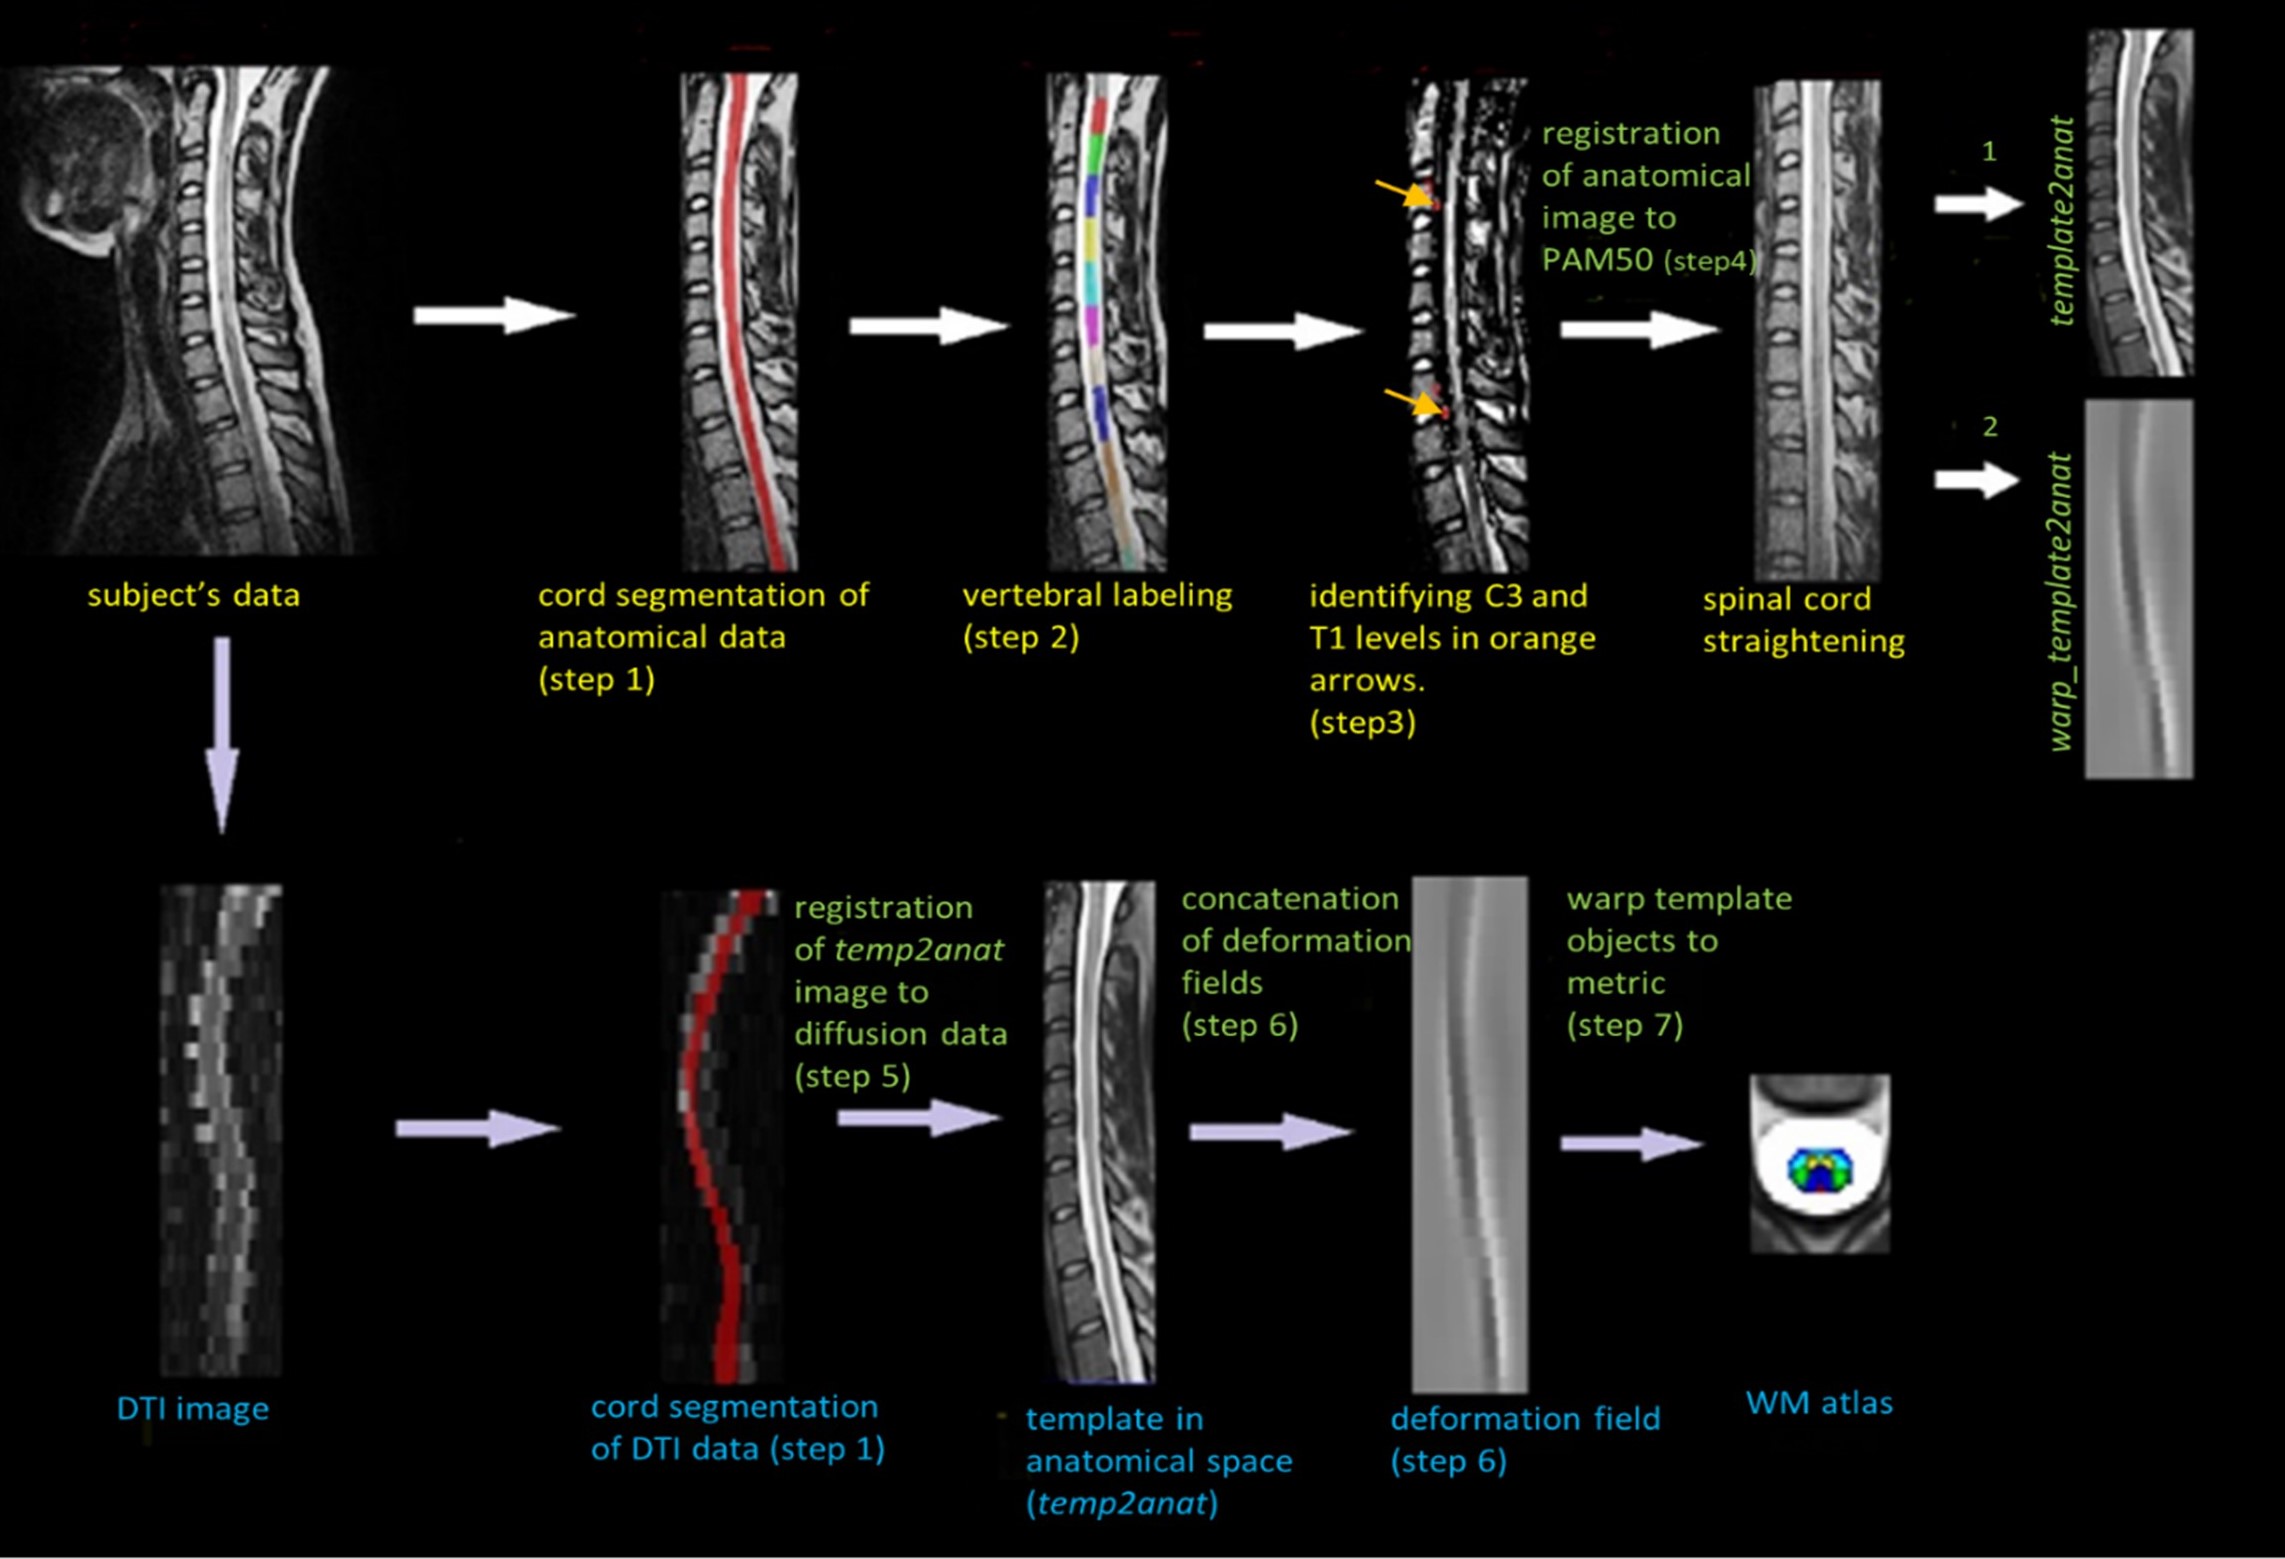
Figure 1. Overview of template registration
pipeline. Initially, T2-weighted scans are registered to the template (top
row). DTI data acquired during the same scan session are then registered to the
anatomical data and PAM 50 objects are warped to diffusion data (bottom row) to
generate the pediatric WM spine atlas.
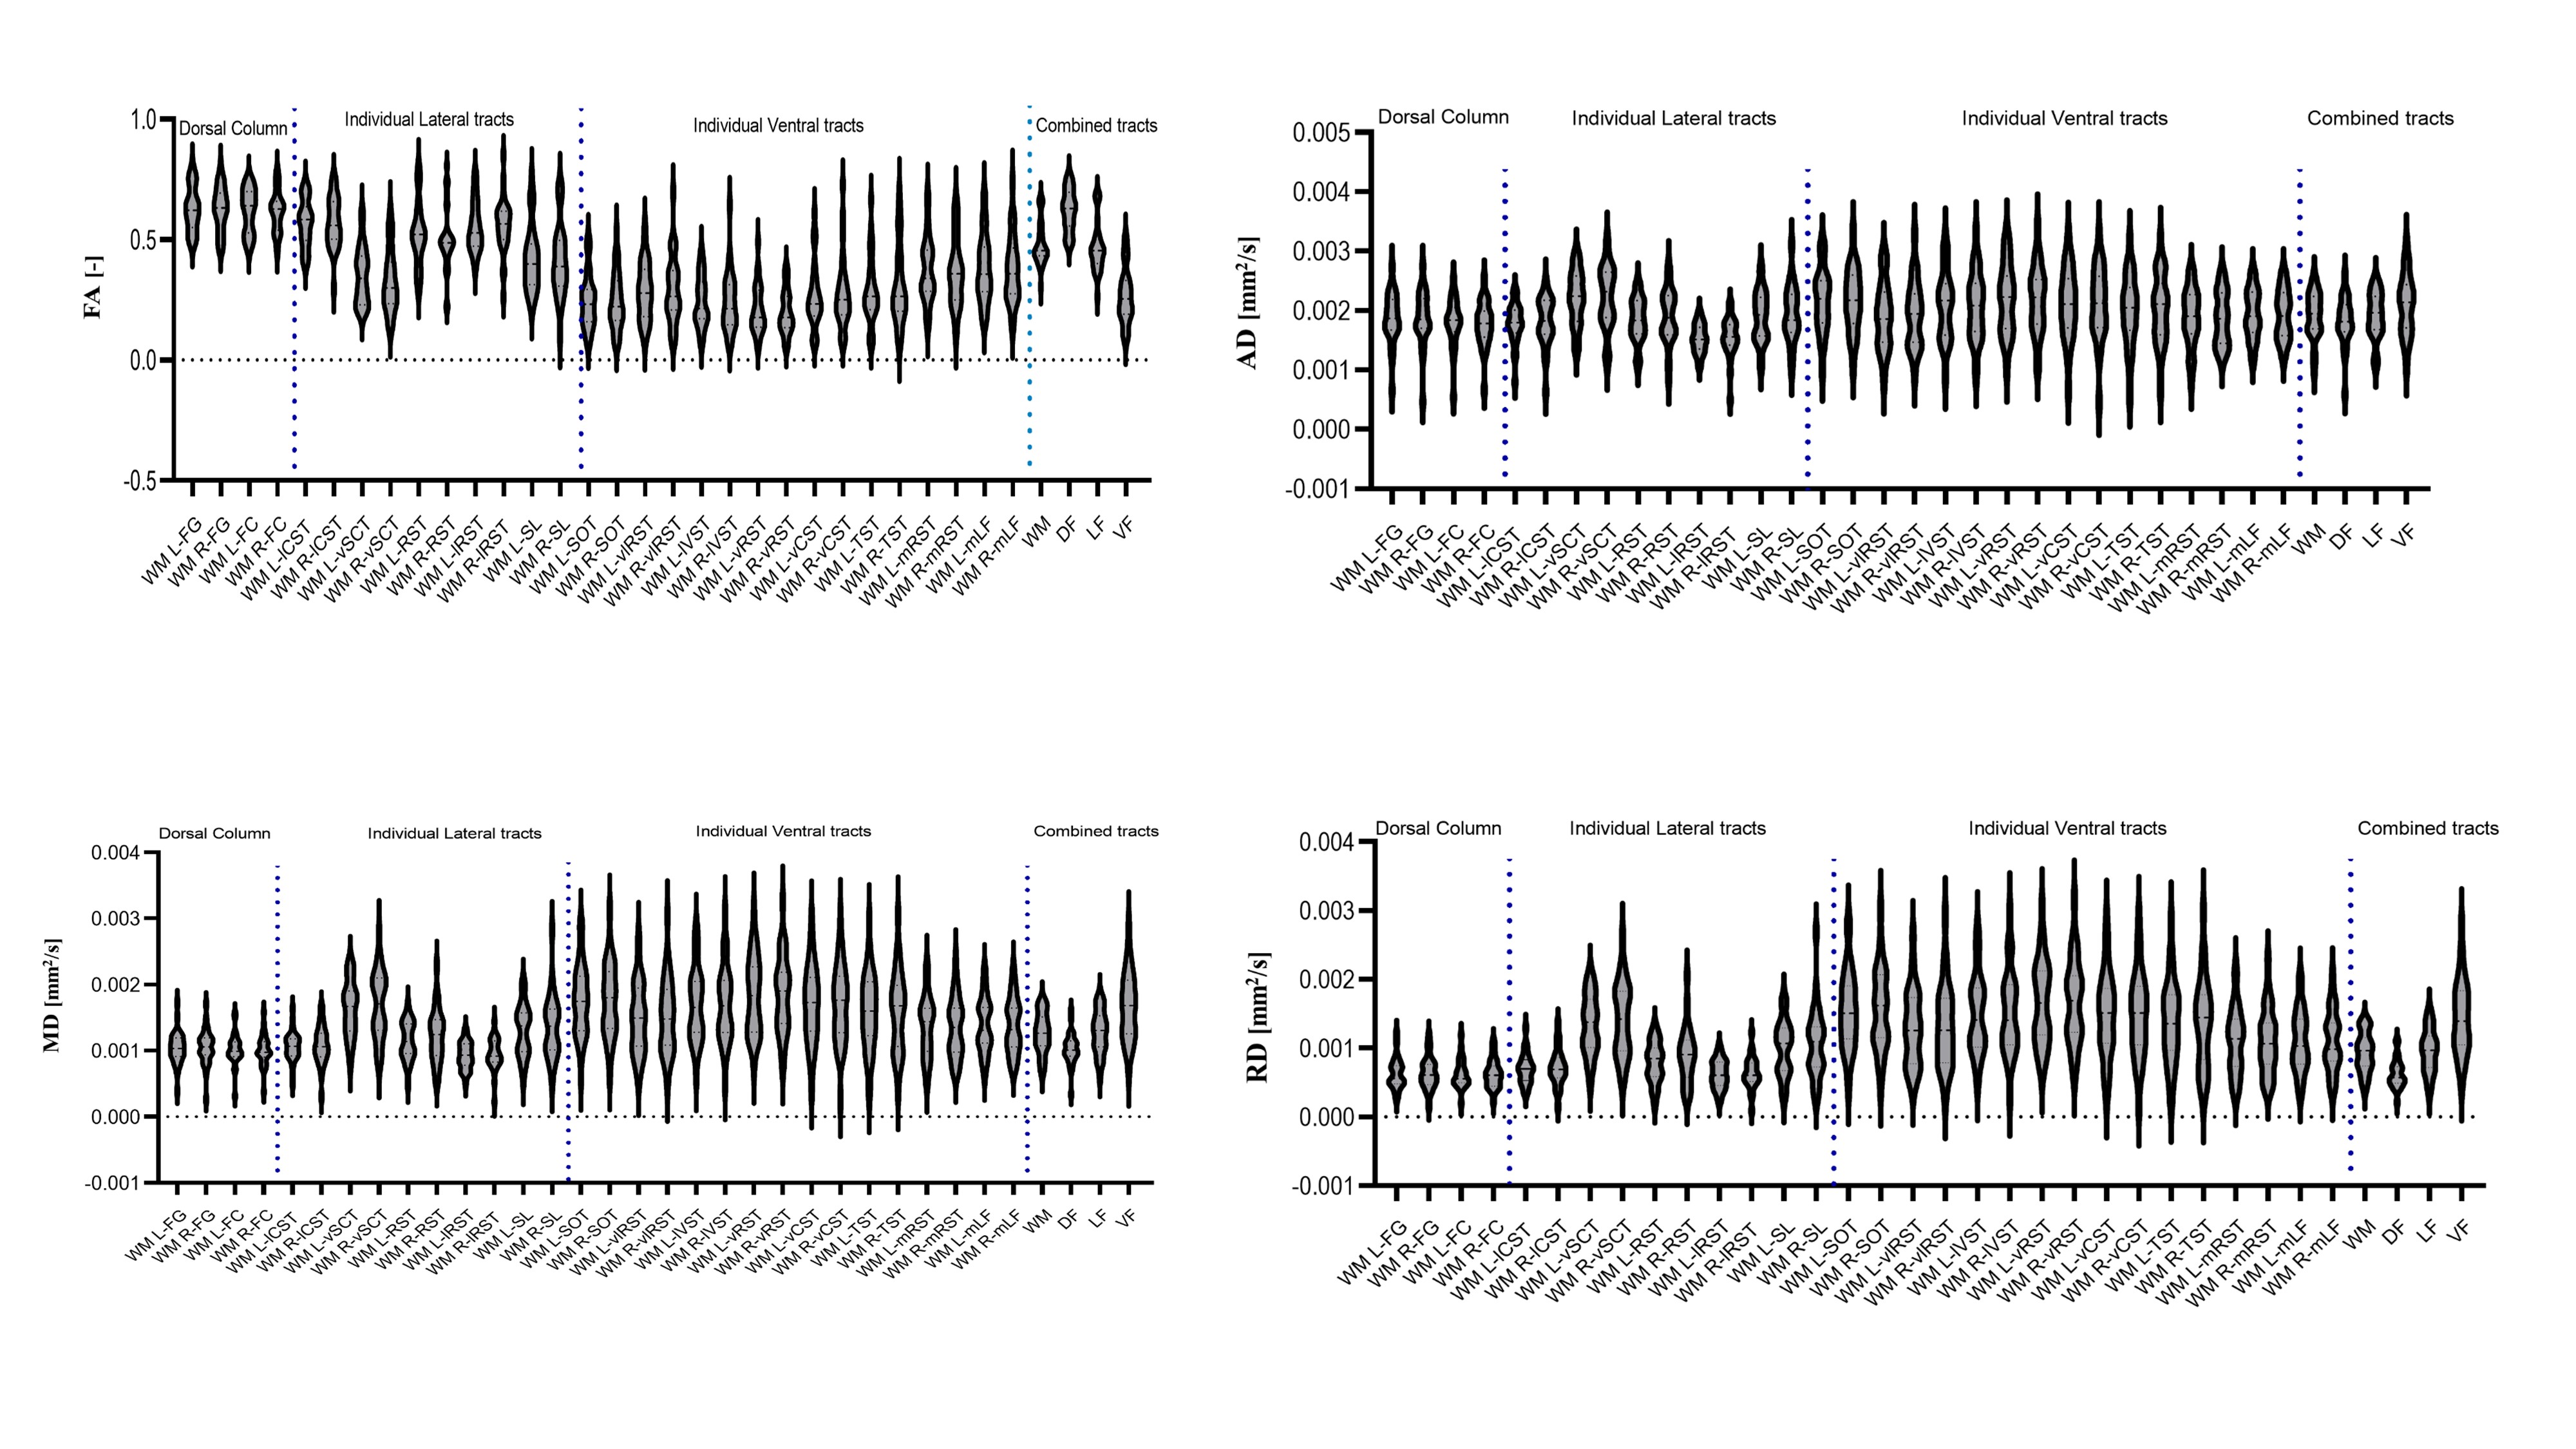
Figure 2. Violin
plots of normative FA, MD, AD and RD indices averaged
across 30 typically developing pediatric subjects, for
34 regions of interest. ROIs are sub-divided in to 30 WM tracts, 3 combined
labels of DF, LF and VF and 1 label for the entire WM.
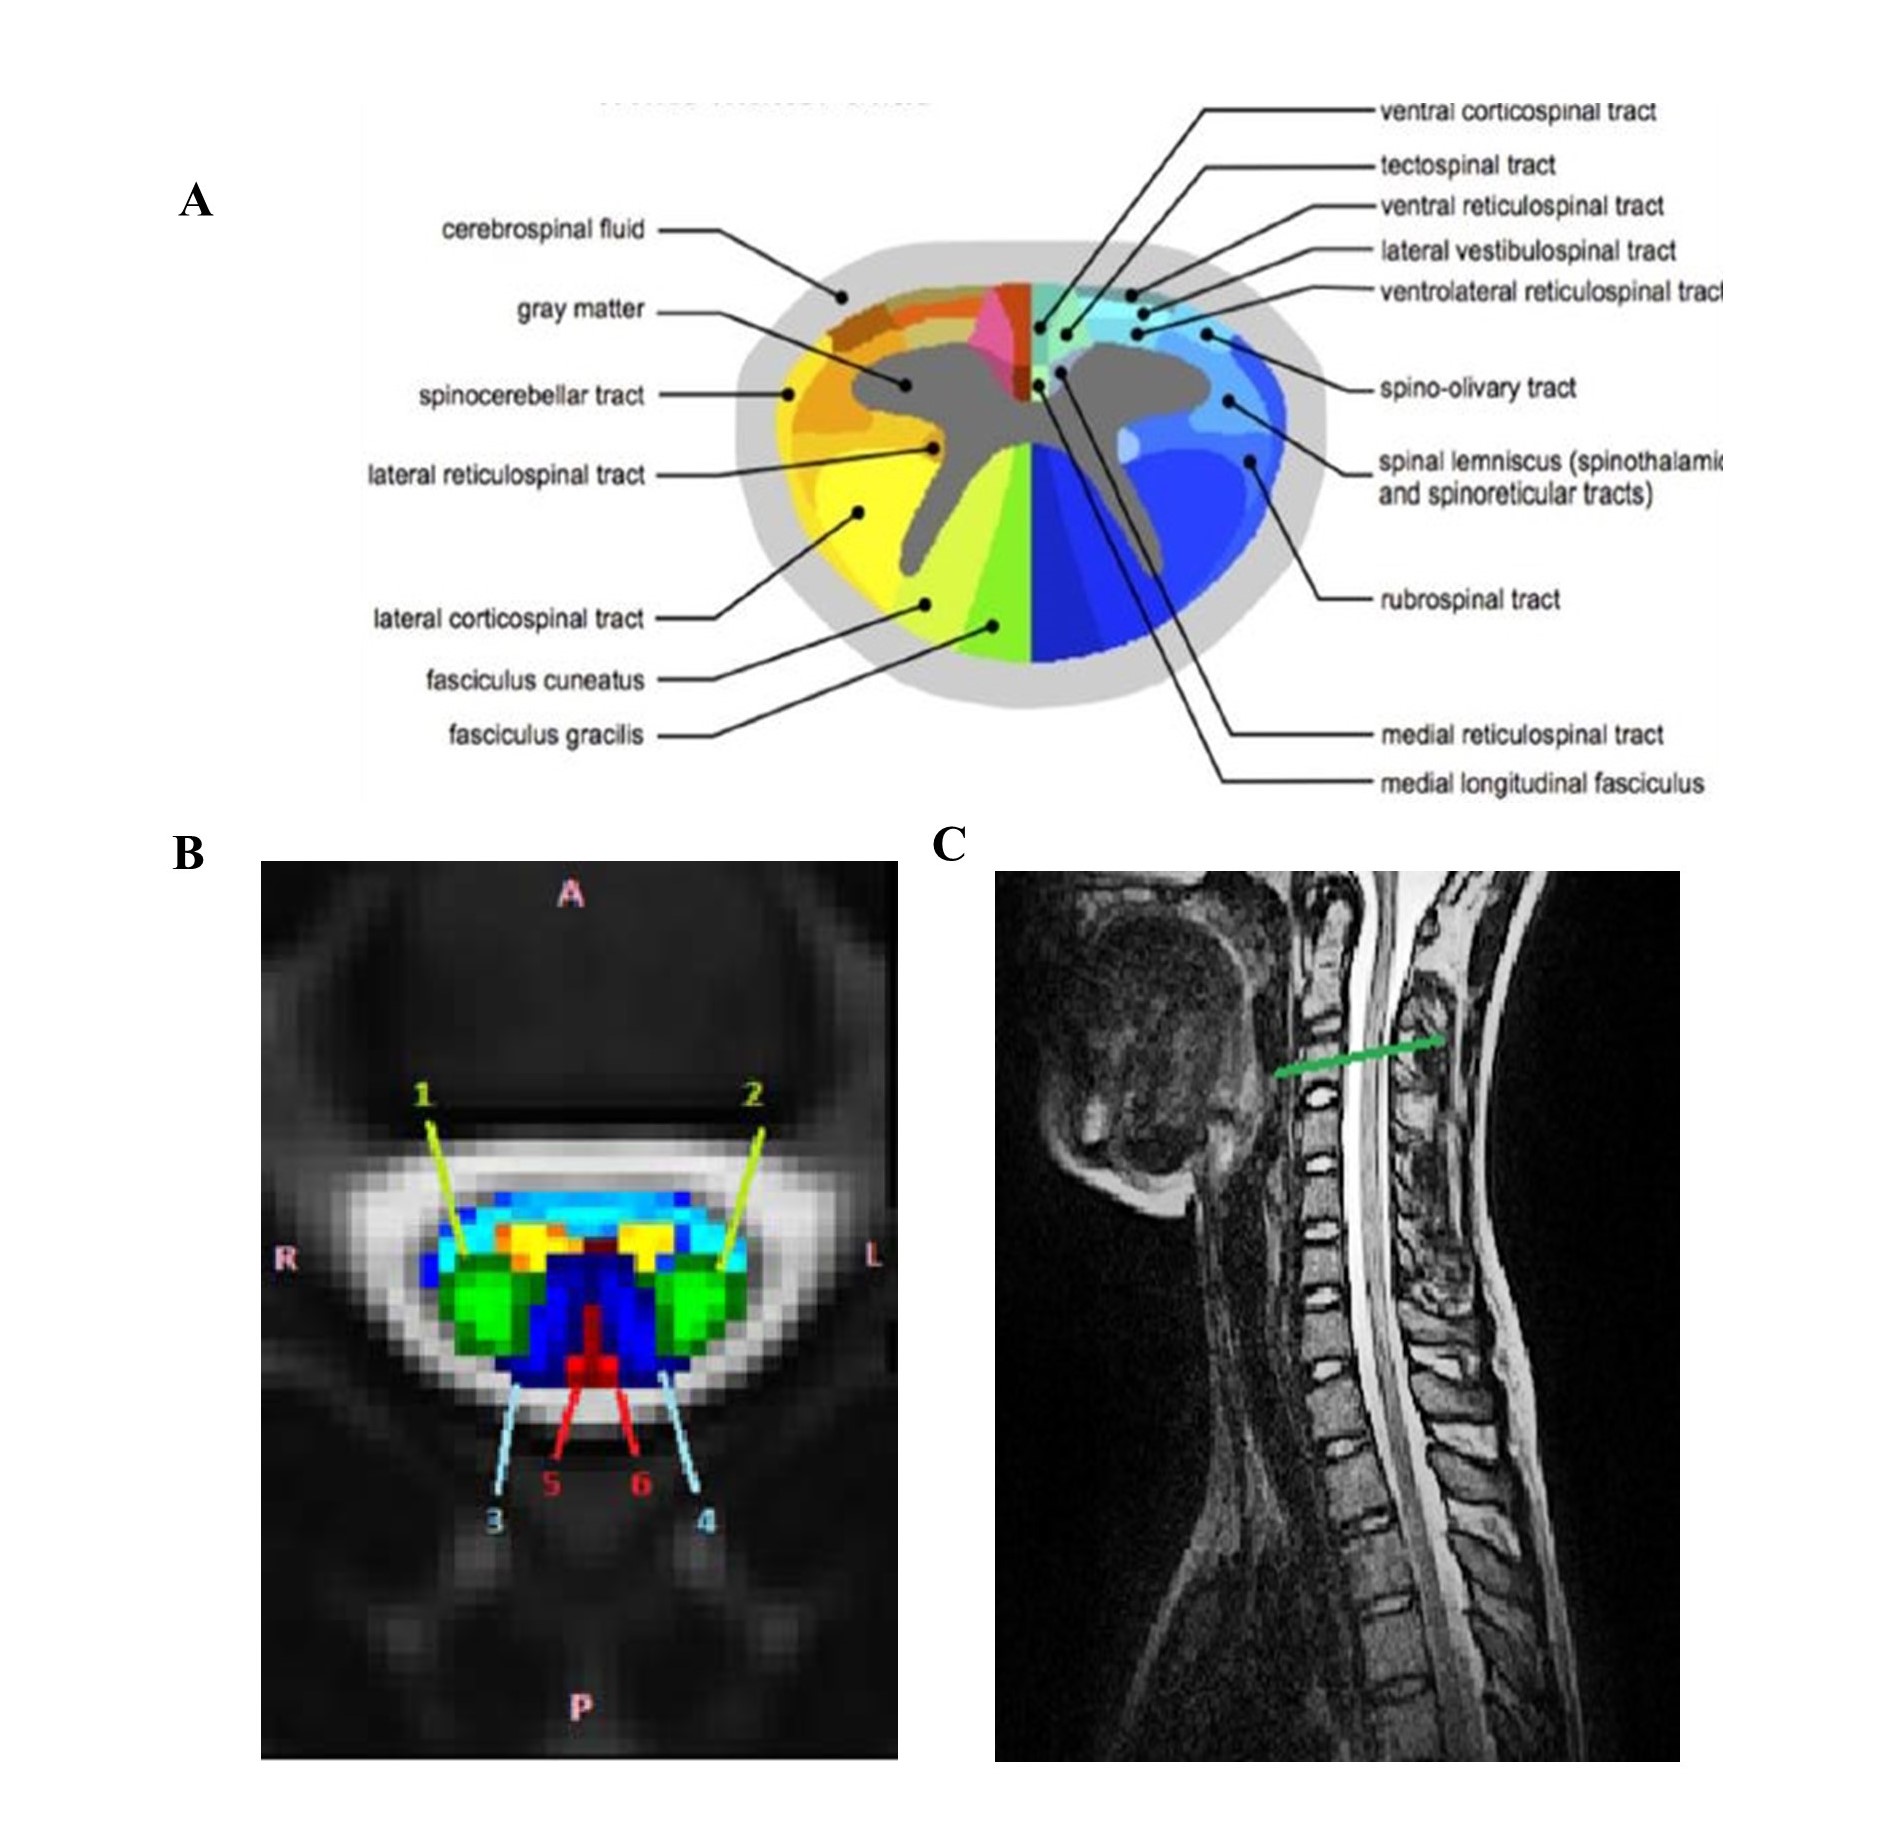
Figure 3.
Spinal cord WM atlas: A. An
atlas of spinal white matter tracts derived from the Gray’s Anatomy atlas B. Generated white matter atlas of
pediatric spinal cord overlaid on a b0 image. The selected tracts are labeled
with multiple colors. C. The C3 level
is marked in green color on the sagittal T2-weighted scan.
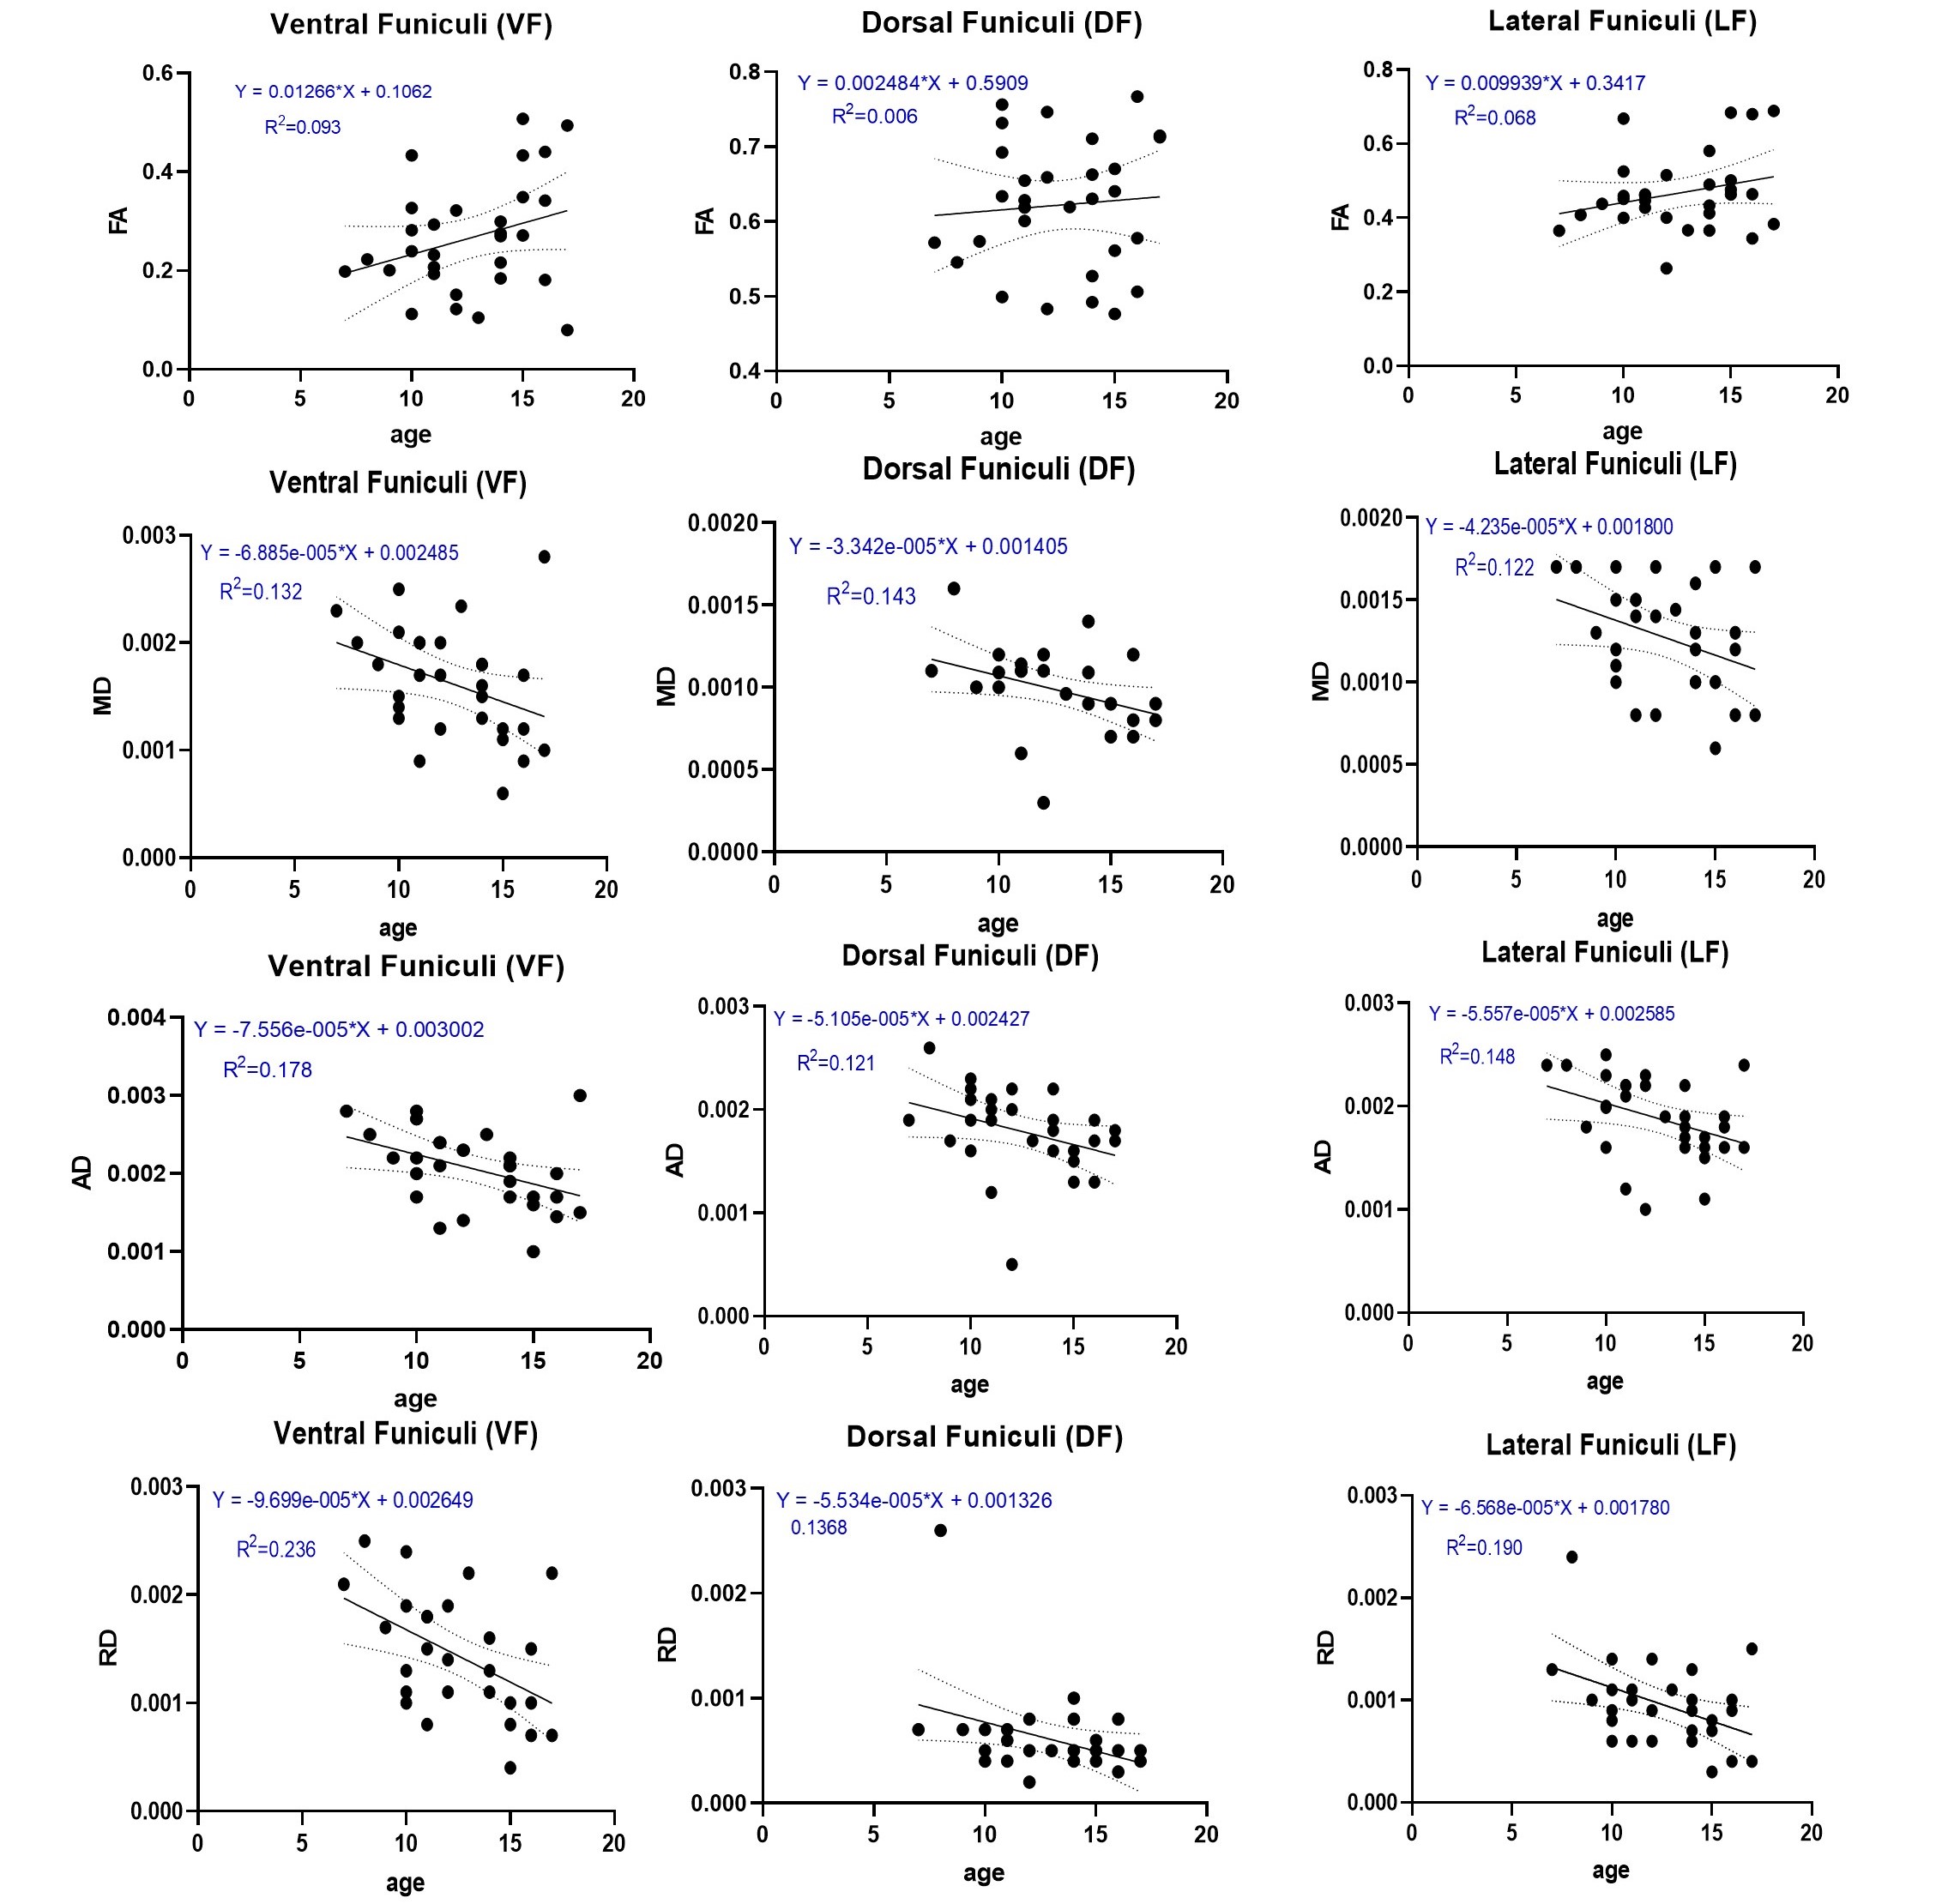
Figure 4. Linear regression plots
showing the relationship between age and FA, MD, AD and RD in ventral, lateral and dorsal funiculi. Solid lines indicate the age-related
trend, and dashed lines indicate the 95% confidence interval.