0655
Associations between cervical cord sodium concentration, neuronal density and macromolecular tissue volume in spinal cord injury1NMR Research Unit, Queen Square MS Centre, Department of Neuroinflammation, UCL Queen Square Institute of Neurology, Faculty of Brain Sciences, University College London (UCL), London, United Kingdom, 2Centre for Medical Image Computing, Department of Medical Physics and Biomedical Engineering, University College London (UCL), London, United Kingdom, 3Radiomics Group, Vall d’Hebron Institute of Oncology, Vall d’Hebron Barcelona Hospital Campus, Barcelona, Spain, 4National Hospital For Neurology and Neurosurgery, London, United Kingdom, 5Department of Uro-Neurology, The National Hospital for Neurology and Neurosurgery and UCL Queen Square Institute of Neurology, London, United Kingdom, 6Department of Brain & Behavioural Sciences, University of Pavia, Pavia, Italy, 7Brain Connectivity Centre Research Department, IRCCS Mondino Foundation, Pavia, Italy
Synopsis
Sodium retention as a consequence of spinal cord injury is thought to impair the regenerative ability of neurons but also reduce damage. Pilot studies suggest a possible increase in total sodium concentration (TSC) in spinal cord injury. Here we report increases in spinal cord TSC in cervical myelopathy patients relative to healthy controls. Given that the increase could be a consequence of intracellular accumulation of sodium or increases in extracellular sodium through enlarged extracellular space, the correlations of sodium with microstructure were investigated using neurite orientation dispersion and density imaging (NODDI) and macromolecular tissue volume imaging.
Introduction
Spinal cord injury (SCI) is known to affect tissue microstructure as well as inducing a physiological response resulting in sodium retention1. In this study we focus on a cervical myelopathy (CM) cohort and investigate the changes in total sodium concentration (TSC) relative to healthy controls (HC). Increases in TSC arise as a consequence of intracellular concentration ICconc, an increase in extracellular space ECspace, or both. By imaging cervical cord microstructure, we can ascertain whether TSC changes are correlated to changes in ICconc or ECspace. Using NODDI (neurite orientation dispersion and density imaging) we can get a measure of intraneurite and ECspace through ficvf (fraction of restricted protons) and fiso (fraction of free protons) respectively. The tissue voxel also contains macromolecules, the fraction of which could also affect TSC measures, therefore macromolecular tissue volume (MTV) imaging was also performed2.Methods
10 HC (5 male, 47±17 years) and 14 CM patients (4 male, 60±8 years) were recruited. All CM were awaiting decompressive cervical spinal cord surgery due to disc herniation, spondylosis or ossification of the posterior longitudinal ligament, with spinal cord T2 changes (indicative of myelomalacia) in previous clinical scans, ASIA score range 30-50. All participants gave informed written consent. MRI scans were acquired on a 3T Philips Ingenia CX system (Philips Healthcare, Best). Subjects underwent single voxel 23Na-MRS and were removed and respositioned in the scanner before the 1H-MRI session. All scans were centered at C2-3 cervical cord level. Scan parameters are detailed in table 1.23Na Quantification: Data was calibrated using a reference phantom (Figure 1), and quantified by using jMRUI (AMARES) to find signal amplitudes, and corrected for T1 and T2 values3,4. A mask corresponding to the sodium voxel (SV) was produced, registered and resampled to DWI/MTV space.
Proton MRI: Axial-oblique images, were acquired using a 32ch head coil for NODDI parameters, MTV and cord cross sectional area (CSA), table 1 and figure 1.
DWI: we derived NODDI metrics following a previously published pipeline5, and focussed on the fiso and ficvf metrics for downstream analysis.
MTV: we calculated MTV, sensitive to the local macromolecule amount in neural tissue, by processing the multi-echo, variable flip angle spoiled gradient scans6 with a published method2, correcting for receiver bias7.
CSA: CSA was computed automatically using a SC segmentation algorithm8.
Values for DWI and MTV corresponding to the SV mask were evaluated for each subject, removing contributions from the outer two slices where artifacts are more prevalent. Subjects with erroneous masks due to motion between 3D FFE and DWI/MTV were excluded from the analysis.
Statistical analysis: A linear regression model was run in SPSS statistical package (v26) to identify associations between TSC and group. Linear regressions between DWI, MTV and TSC were explored; resulting Pearson correlation coefficients are reported alongside p value. These models were adjusted for potential confounders, and predicted values computed in SPSS reported.
Results
Three 23Na-MRS scans were rejected due to motion in the HC group. TSC in the cervical cord was found to be statistically significantly correlated to gender (F= 14.4, R2= 22.1, beta=-.66 mmol, p=0.001, 95% confidence interval [-34.3, -9.9]), therefore a predicted TSC adjusted for gender (aTSC) was computed.aTSC had a mean of 53±10mM in HC and 63±10 in CM (figure 2), aTSC correlated significantly to group (Pearson correlation coefficient 0.41, p=0.03). However, linear regression after correcting for CSA found no significant association between aTSC and group (p=0.055). Table 2 shows groupwise NODDI and MTV statistics. Correlations with aTSC are shown in figure 2 and detailed in table 3.
Discussion
aTSC correlated significantly with cohort (p<0.001), although linear regression showed the power of cohort to predict aTSC fell short (p=0.05 corrected for CSA). There were significant differences between CM fiso, ficvf and CSA relative to HC. This reflects a difference in microstructure in the CM group, distal to injury site (compression was present at C3/4 in 15%, C4/5 in 23%, C5/6 in 42.3%, C6/7 in 19.2% of patients). No differences were seen in MTV.aTSC was not significantly correlated to ficvf or fiso in CM nor HC groups, possibly due to a large rejection of patient data, leading to a small sample size. Regression graphs in figure 2 do show that there is a trend of aTSC correlating with ficvf and fiso in the CM group, which suggests that increased intracellular accumulation and extracellular space are both impacting TSC. In HC the relationship between aTSC and ficvf and fiso goes in the opposite direction, with a lower aTSC and higher IC space. The regression for the HC and fiso looks to be driven by one outlier.
Conclusion
Our data suggest there is a correlation between total sodium concentration and ficvf and fiso, but not MTV in the cervical myelopathy group. A linear regression of the data suggests both intracellular sodium accumulation and extracellular sodium may contribute to increased sodium in the cervical myelopathy group. Further data needs to be collected to confirm thisAcknowledgements
Acknowledgments to the UCL-UCLH Biomedical Research Centre for ongoing funding; Authors receive funding from the UK MS Society (#77), Wings for Life (#169111), Horizon2020 (CDS-QUAMRI, #634541), BRC (#BRC704/CAP/CGW) and Guarantors of Brain. FG is currently supported by the investigator-initiated PREdICT study at the Vall d'Hebron Institute of Oncology (Barcelona), funded by AstraZenecaReferences
1. Fehlings MG, Wilson JR, Frankowski RF, et al. Riluzole for the treatment of acute traumatic spinal cord injury: rationale for and design of the NACTN Phase I clinical trial. J Neurosurg Spine2012; 17: 151-156. 2012/09/19. DOI: 10.3171/2012.4.AOSPINE1259.
2. Volz S, Noth U, Jurcoane A, et al. Quantitative proton density mapping: correcting the receiver sensitivity bias via pseudo proton densities. Neuroimage2012; 63: 540-552. 2012/07/17. DOI: 10.1016/j.neuroimage.2012.06.076.
3. Riemer F, Solanky BS, Wheeler-Kingshott CAM, et al. Bi-exponential (23) Na T2 * component analysis in the human brain. NMR Biomed2018; 31: e3899. 2018/02/27. DOI: 10.1002/nbm.3899.
4. Solanky BS, Riemer F, Golay X, et al. Sodium quantification in the spinal cord at 3T. Magn Reson Med2013; 69: 1201-1208. 2013/03/08. DOI: 10.1002/mrm.24696.
5. Grussu F, Schneider T, Zhang H, et al. Neurite orientation dispersion and density imaging of the healthy cervical spinal cord in vivo. Neuroimage2015; 111: 590-601. 2015/02/06. DOI: 10.1016/j.neuroimage.2015.01.045.
6. Duval T, Le Vy S, Stikov N, et al. g-Ratio weighted imaging of the human spinal cord in vivo. Neuroimage2017; 145: 11-23. 2016/09/25. DOI: 10.1016/j.neuroimage.2016.09.018.
7. Yarnykh VL. Actual flip-angle imaging in the pulsed steady state: a method for rapid three-dimensional mapping of the transmitted radiofrequency field. Magn Reson Med2007; 57: 192-200. 2006/12/28. DOI: 10.1002/mrm.21120.
8. Prados F, Cardoso MJ, Yiannakas MC, et al. Fully automated grey and white matter spinal cord segmentation. Sci Rep2016; 6: 36151. 2016/10/28. DOI: 10.1038/srep36151.
Figures
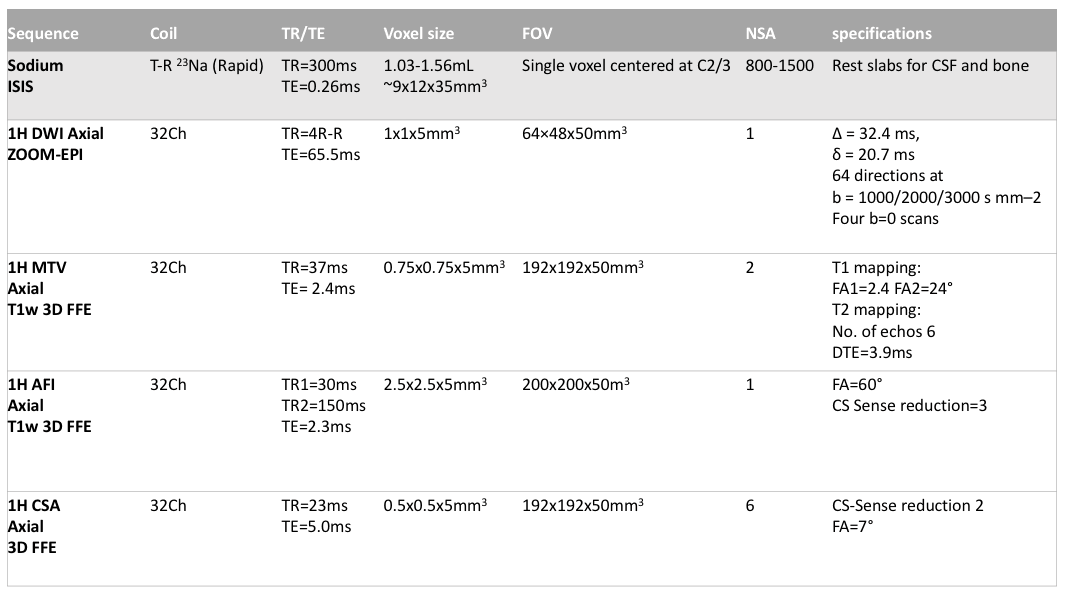

Figure 1
a) 2D-T2w gradient echo image with the corresponding 23Na MRS voxel (SV) positioning in the cervical spinal cord in yellow, b) representative 23Na spectra from in vivo and phantom scans, used to quantify total sodium concentration. Example of multi-shell diffusion NODDI maps for c) fiso (fraction of free protons) and d) ficvf (fraction of restricted protons) for extracellular and intraneurite space evaluation, d) macromolecular tissue volume (MTV) map to quantify MTV in the spinal cord.
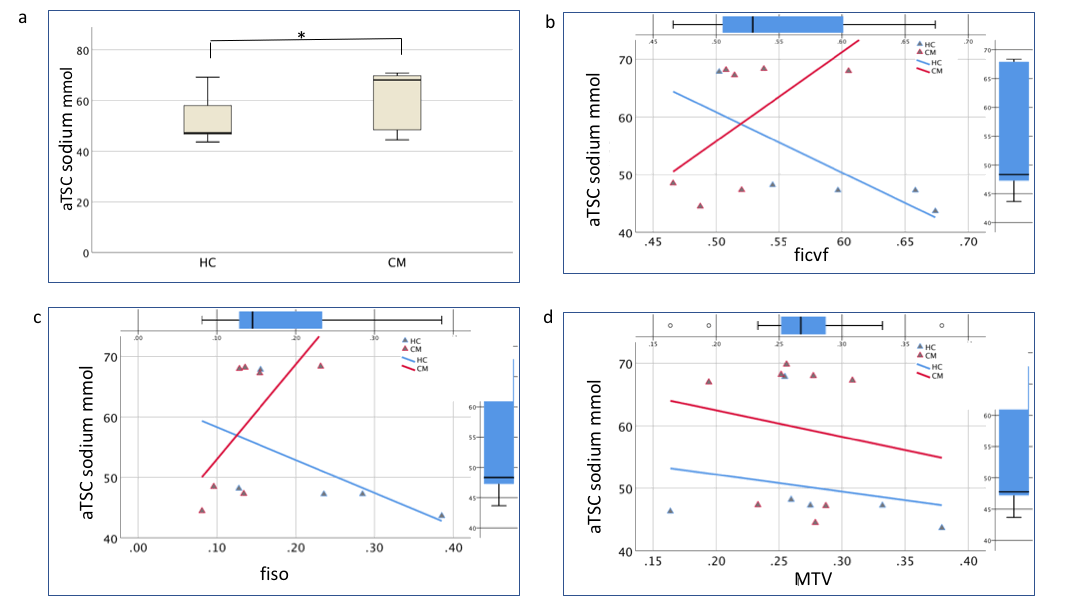
Figure 2.
Results for total sodium concentration adjusted for gender in the cervical spinal cord (aTSC), in both healthy controls (HC) and cervical myelopathy patients (CM). a) boxplots for HC and CM aTSC (* p<0.05).
Regression variable plots for aTSC in HC (blue) and CM (red) groups. aTSC correlations to b) ficvf (fraction of restricted protons, an indication of intracellular space) c) fiso (fraction of free protons, a measure of extracellular space) and d) macromolecular tissue volume (MTV).
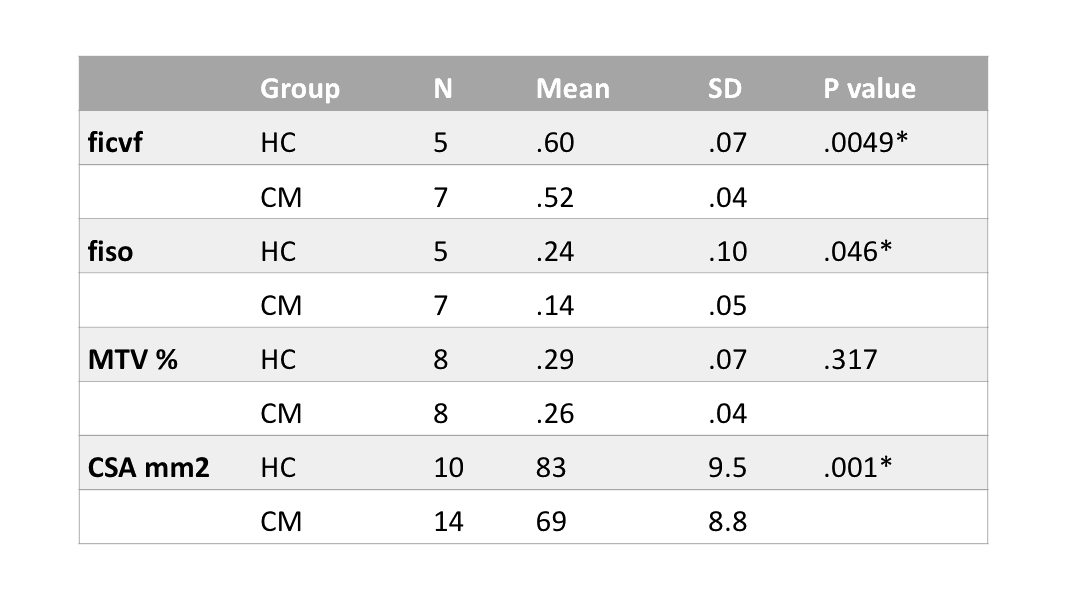
Table 2
Mean and standard deviation (SD) for ficvf (fraction of restricted protons), fiso (fraction of free protons), macromolecular tissue volume (MTV), and cross-sectional area (CSA) of the cervical spinal cord, in both healthy controls (HC) and cervical myelopathy patients (CM). Independent t-test p values reported for groupwise analysis (* p<0.05)
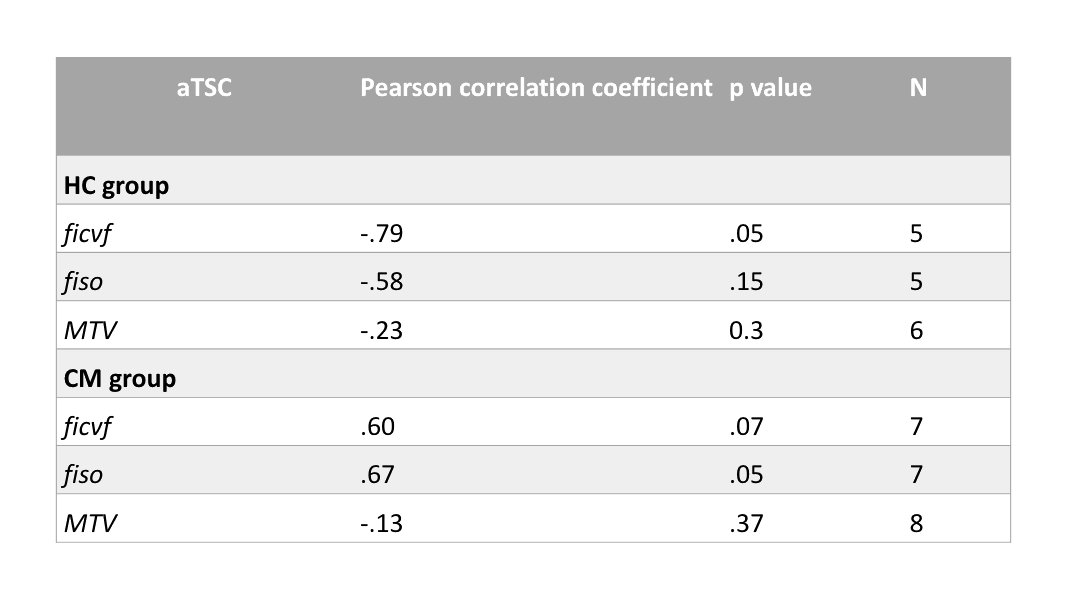
Table 3
Pearson correlation coefficients for cervical spinal cord total sodium concentration, adjusted for gender, (aTSC) and its association to DWI NODDI parameters ficvf (fraction of restricted protons), fiso (fraction of free protons), and relationship with macromolecular tissue volume (MTV), in both healthy controls (HC) and cervical myelopathy patients (CM)