0654
Variability of the hemodynamic response function in the healthy human cervical spinal cord at 3 Tesla1Athinoula A. Martinos Center for Biomedical Imaging, Massachusetts General Hospital and Harvard Medical School, Charlestown, MA, United States
Synopsis
Functional MRI is an indirect measure of neural activity, being the convolution of the hemodynamic response function (HRF) and latent neural response. The HRF is variable across brain regions and individuals. However, resting-state spinal cord fMRI studies still largely ignore this variability, partly due to an incomplete understanding of HRF variability in the cord. To address this gap, we characterized within- and between-subjects HRF variability within the cervical spine (N=20). 6–9% HRF variability was observed in the gray matter, and 3–5% in the white matter. This is an important confound to be accounted for in future spinal cord fMRI studies.
Introduction
Functional MRI (fMRI) is used extensively for studying neural correlates of brain function and is recently gaining traction in studying the spinal cord. The fMRI signal contains contributions from neural activity and as well as from neurovascular coupling quantified as the hemodynamic response function (HRF) 1. The HRF bridges neural activity to blood hemodynamics, containing variance from non-neural sources such as local vasculature and neurochemical balance. This HRF is variable across brain regions and individuals 2,3. Although brain fMRI studies ignored this confound for a long time, deconvolution techniques to minimize the HRF confound have recently gained traction. Using such techniques, HRF variability was found to confound both within-subject fMRI functional connectivity (FC) 4 and group differences in FC in psychiatric disorders 3,5. Several brain fMRI studies have adopted this approach lately 6–10.However, these advancements have not yet benefited spinal cord fMRI research. Resting-state spinal cord fMRI (rs-scfMRI) studies have not accounted for this variability, in part due to a lack of understanding of HRF variability in the cord. This delay is also driven by challenges in imaging the cord; in fact, the first conclusive rs-scfMRI study was published just 6 years ago 11. HRF variability has proved to be a concerning confound in the brain, causing about 14.7% error in FC estimates 4; hence, we consider this to be a problem of considerable importance to the younger rs-scfMRI field. To address this gap, we estimated HRF parameters in the cervical spinal cord using fMRI deconvolution. We present preliminary findings of within-subject HRF variability between cord quadrants and between spinal levels (i.e. fMRI slices), as well as between-subjects variability.
Methods
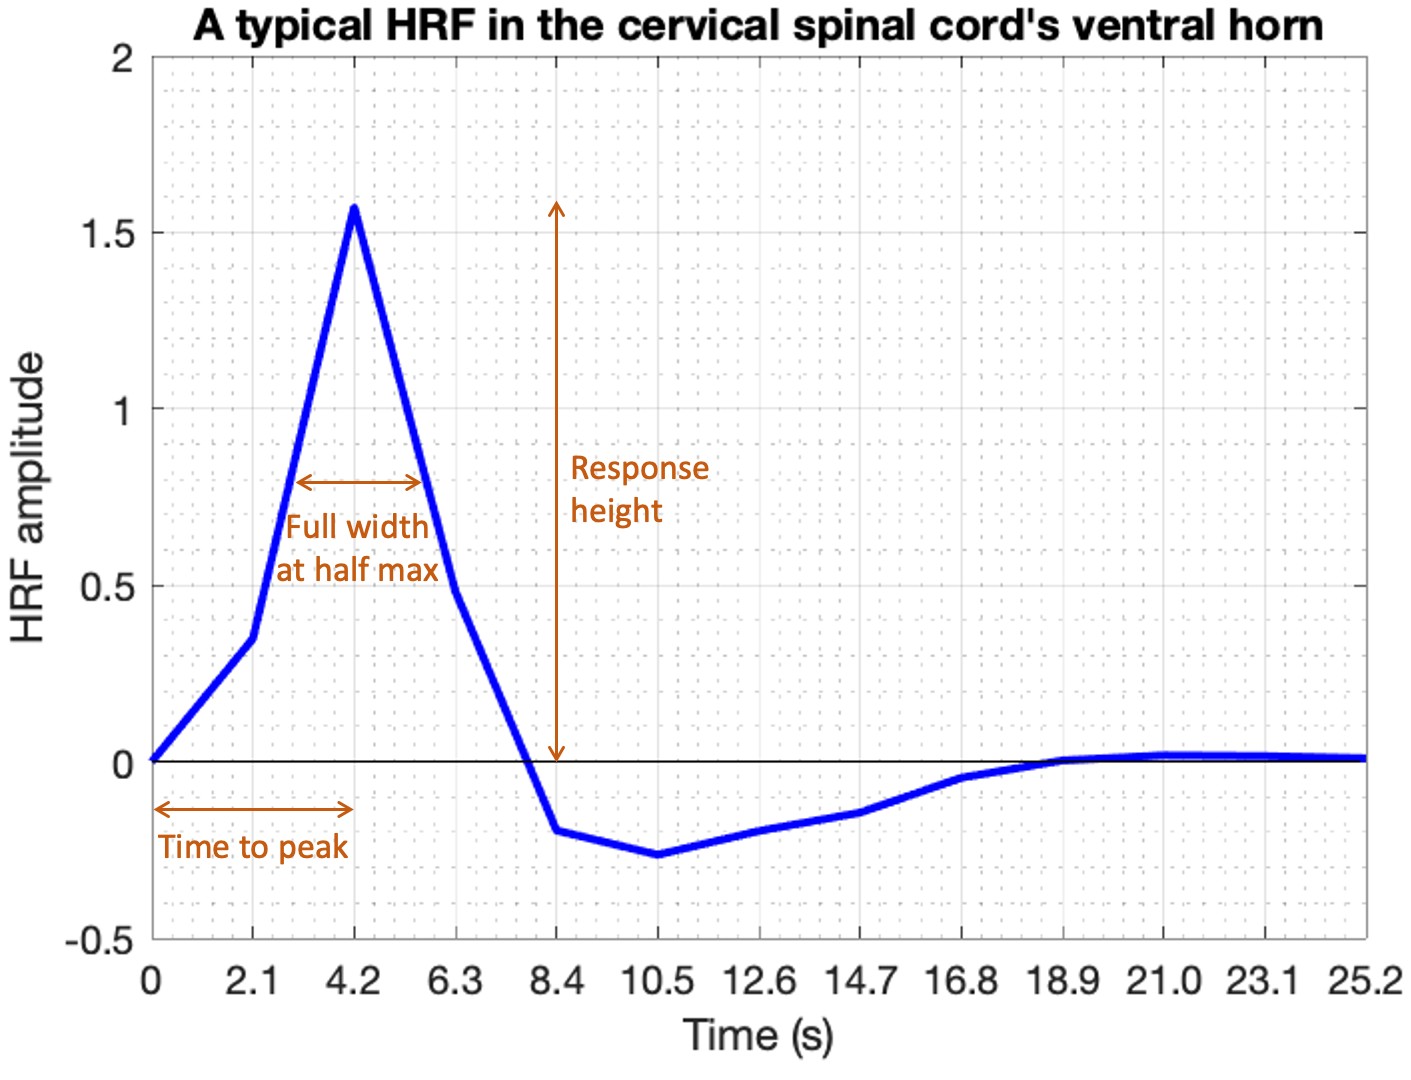
Rs-scfMRI data were obtained on a Philips Achieva 3T scanner (N=20, healthy adults, 10M/10F, age=32±11y). All participants provided informed consent; scanning was approved by the Vanderbilt University Institutional Review Board (IRB), and data analysis was approved by the Partners IRB at Massachusetts General Hospital. Complete data acquisition details can be found in an earlier study published with similar data 12. Briefly, two identical rs-scfMRI runs were performed: 3D gradient-echo sequence, volume acquisition time (VAT)=2.08s (288 volumes, 10min), TE=8ms, TR=34ms, FA=8°, SENSE=2.0 (left-right), FOV=150×150 mm, voxel size=1×1×5 mm3, 12 slices (cervical spine vertebral levels C2 through C5). Respiratory and cardiac cycles were recorded using respiratory bellows and pulse oximeter for data denoising.FMRI data were pre-processed using custom MATLAB scripts with the standard rs-scfMRI pipeline previously published by us 13. Voxel-level HRF deconvolution was then performed using Wu and Marinazzo’s technique 14 to estimate one HRF for each voxel. This data-driven technique, now used in several studies 6–10, identifies latent neural events using a point-process model 15 and then estimates a double-gamma HRF using Wiener deconvolution. HRF shape parameters (response height [RH], time-to-peak [TTP] and full-width-at-half-max [FWHM]) were calculated 3 (Figure-1).
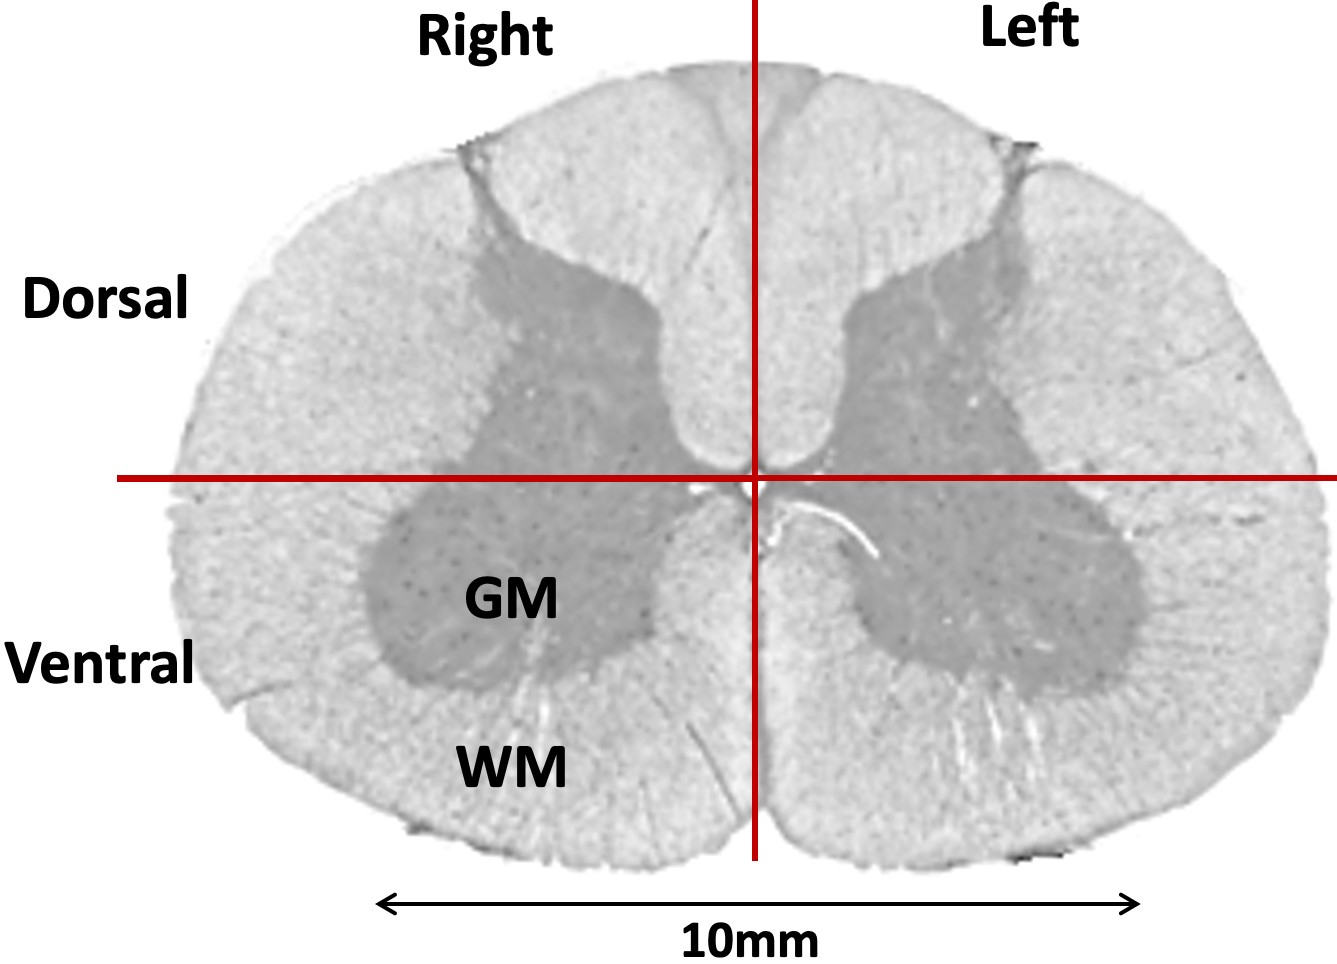
Each fMRI slice was divided into 4 gray matter and 4 white matter quadrants (Figure-2) (left/right ventral/dorsal horns). FMRI in the white matter has been of interest lately 16, and rs-scfMRI studies often report data from it 17. The 95th percentile 12 HRF parameters among all voxels within a quadrant were chosen to represent the quadrant. With VAT=2.08s and FWHM having a range of just 1–2s 2, we did not further process FWHM values. Normalized root-mean-squared (RMS) variability of RH/TTP values across quadrants was computed as the percentage ratio of RMS difference between quadrants to the RMS mean of the quadrants (likewise for variability across spinal levels and subjects).
Results
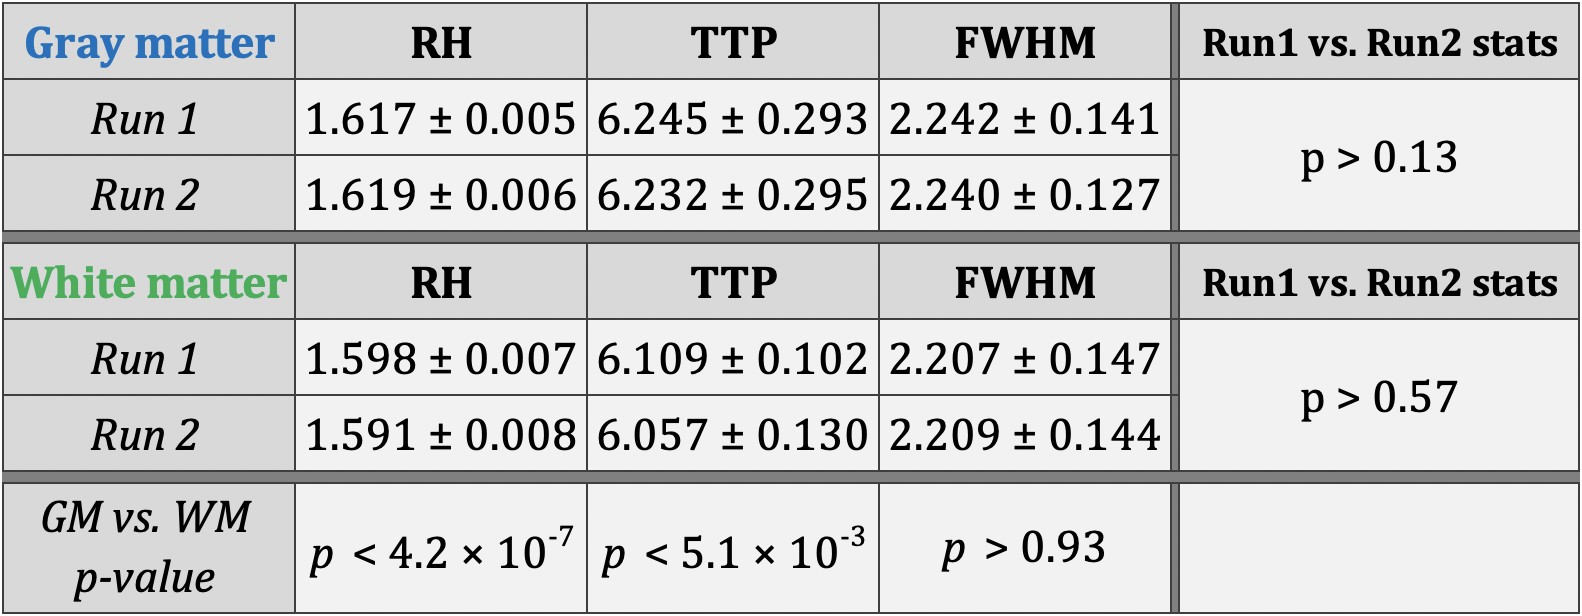
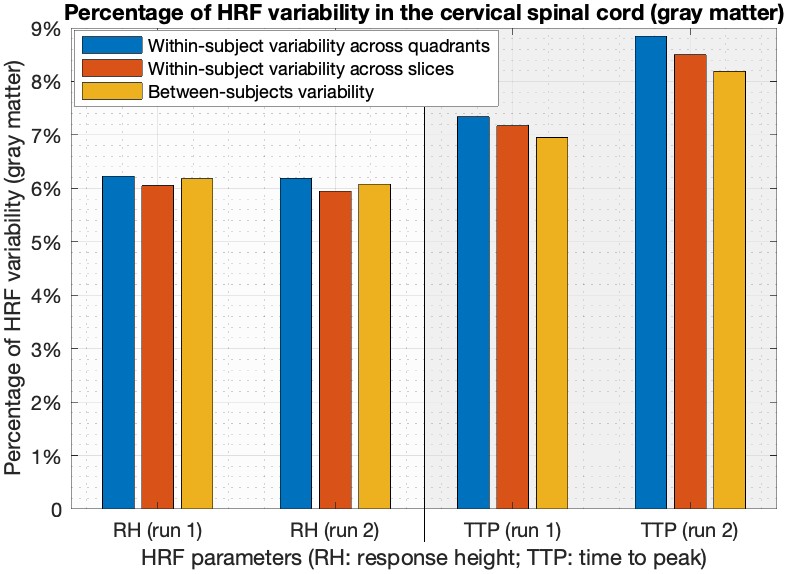
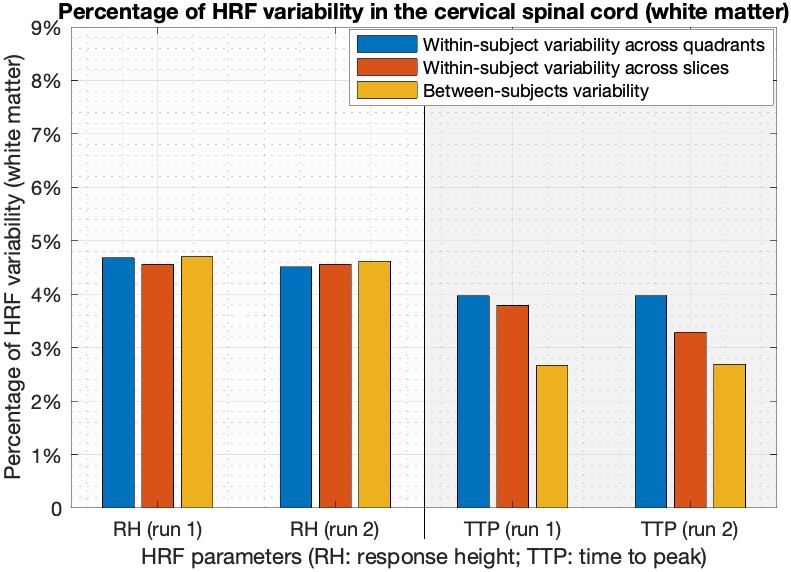
Simple statistics of HRF parameters, aggregated across all quadrants, levels and subjects, showed that (Figure-3) (i) HRF parameters were consistent across two runs in both gray and white matter (p>0.13), and (ii) RH and TTP were significantly higher in gray matter compared to white matter (p<5.1×10⁻³). FWHM was not significantly different between gray and white matter, which may be attributed to the limited sampling rate 2.Within- and between-subjects HRF variability were of the same order of magnitude. On average in the gray matter, RH showed 6% variability in both runs and TTP showed 7–9% variability (Figure-4). The numbers were lower with about 4.5% RH variability and 3–4% TTP variability in the white matter (Figure-5).
Discussion
We found evidence that the HRF is variable in the spinal cord. We quantified this variability to identify certain cord-specific HRF characteristics. White matter HRFs were shorter and quicker than gray matter HRFs. This could be because of lower metabolism in the white matter, its different vascular architecture, or its poorer fMRI signal power; available data cannot decipher this yet. Aggregated HRF parameters showed promising consistency across runs, an aspect to be investigated further in the future. RH results were the most robust across runs in both gray and white matter. The variability was also similar within- and between-subjects. TTP findings were reliable but less consistent; this must be viewed carefully in view of the limited temporal resolution (VAT=2.08s). Typically, VAT<1s is considered ideal for HRF analysis. The findings are important given that HRF variability can confound spinal cord FC, like in the brain 3–5.Conclusion
HRF is variable across quadrants, spinal levels and subjects in the healthy human cervical spinal cord.Acknowledgements
We acknowledge funding from U.S. National Institutes of Health (National Institute of Biomedical Imaging and Bioinformatics) grant nos. K99EB016689, R00EB016689 and R01EB027779 (PI: R.L.B.).References
[1] G. K. Aguirre, E. Zarahn and M. D'esposito, "The variability of human, BOLD hemodynamic responses," Neuroimage, vol. 8, no. 4, pp. 360-9, 1998.
[2] D. A. Handwerker, J. M. Ollinger and M. D'Esposito, "Variation of BOLD hemodynamic responses across subjects and brain regions and their effects on statistical analyses," Neuroimage, vol. 21, no. 4, pp. 1639-51, 2004.
[3] D. Rangaprakash, M. N. Dretsch, W. Yan, J. S. Katz, T. S. Denney and G. Deshpande, "Hemodynamic variability in soldiers with trauma: Implications for functional MRI connectivity studies," NeuroImage: Clinical, vol. 16, pp. 409-417, 2017.
[4] D. Rangaprakash, G.-R. Wu, D. Marinazzo, X. Hu and G. Deshpande, "Hemodynamic response function (HRF) variability confounds resting-state fMRI functional connectivity," Magnetic Resonance in Medicine, vol. 80, no. 4, pp. 1697-1713, 2018.
[5] W. Yan, D. Rangaprakash and G. Deshpande, "Aberrant Hemodynamic Responses in Autism: Implications for Resting State fMRI Functional Connectivity Studies," Neuroimage: Clinical, vol. 19, pp. 320-330, 2018.
[6] E. Amico, F. Gomez, C. Di Perri, A. Vanhaudenhuyse, D. Lesenfants, P. Boveroux, V. Bonhomme, J. F. Brichant, D. Marinazzo and S. Laureys, "Posterior cingulate cortex-related co-activation patterns: a resting state FMRI study in propofol-induced loss of consciousness," PLoS One, vol. 9, no. 6, e100012, 2014.
[7] M. Boly, S. Sasai, O. Gosseries, M. Oizumi, A. Casali, M. Massimini and G. Tononi, "Stimulus set meaningfulness and neurophysiological differentiation: a functional magnetic resonance imaging study," PLoS One, vol. 10, no. 5, e0125337, 2015.
[8] D. Rangaprakash, G. Deshpande, T. Daniel, A. Goodman, J. Robinson, N. Salibi, J. Katz, T. Denney and M. Dretsch, "Compromised Hippocampus-Striatum Pathway as a Potential Imaging Biomarker of Mild Traumatic Brain Injury and Posttraumatic Stress Disorder," Human Brain Mapping, vol. 38, no. 6, pp. 2843-2864, 2017.
[9] B. Lamichhane, B. M. Adhikari, S. F. Brosnan and M. Dhamala, "The neural basis of perceived unfairness in economic exchanges," Brain Connectivity, vol. 4, no. 8, pp. 619-30, 2014.
[10] D. Rangaprakash, R. Tadayonnejad, G. Deshpande, J. O'Neill and J. Feusner, "FMRI hemodynamic response function (HRF) as a novel marker of brain function: applications for understanding obsessive-compulsive disorder pathology and treatment response," Brain Imaging and Behavior, in press, 2020.
[11] R. Barry, S. Smith, A. Dula and J. Gore, "Resting state functional connectivity in the human spinal cord," eLife, vol. 3, e02812, 2014.
[12] R. Barry, B. Conrad, S. Smith and J. Gore, "A practical protocol for measurements of spinal cord functional connectivity," Sci Rep., vol. 8, no. 1, 16512, 2018.
[13] R. Barry, B. Rogers, B. Conrad, S. Smith and J. Gore, "Reproducibility of resting state spinal cord networks in healthy volunteers at 7 Tesla," NeuroImage, vol. 133, pp. 31‐40, 2016.
[14] G. Wu, W. Liao, S. Stramaglia, J. Ding, H. Chen and D. Marinazzo, "A blind deconvolution approach to recover effective connectivity brain networks from resting state fMRI data," Medical Image Analysis, vol. 17, no. 3, pp. 365-374, 2013.
[15] J. Power, B. Schlaggar and S. Petersen, "Recent progress and outstanding issues in motion correction in resting state fMRI," Neuroimage, vol. 105, pp. 536-51, 2015.
[16] Y. Huang, Y. Yang, L. Hao, X. Hu, P. Wang, Z. Ding, J. Gao and J. Gore, "Detection of functional networks within white matter using independent component analysis," Neuroimage, vol. 222, 117278, 2020.
[17] N. Kinany, E. Pirondini, S. Micera and D. Van de Ville, "Dynamic Functional Connectivity of Resting-State Spinal Cord fMRI Reveals Fine-Grained Intrinsic Architecture," Neuron, vol. 108, no. 3, pp. 424-435, 2020.
Figures