0653
Correlating advanced MRI and histopathological measurements of axons and myelin in human traumatic spinal cord injury
Sarah Rosemary Morris1,2,3, Andrew Yung1,2,4, Valentin Prevost1,2,4, Shana George1, Andrew Bauman1,2,4, Piotr Kozlowski1,2,3,4, Farah Samadi1,5, Caron Fournier1,5, Lisa Parker6, Kevin Dong1, Femke Streijger1, Veronica Hirsch-Reinshagen1,5,6, G.R. Wayne Moore1,5,6, Brian K Kwon1,7, and Cornelia Laule1,2,3,5
1International Collaboration on Repair Discoveries (ICORD), Vancouver, BC, Canada, 2Radiology, University of British Columbia, Vancouver, BC, Canada, 3Physics & Astronomy, University of British Columbia, Vancouver, BC, Canada, 4UBC MRI Research Centre, Vancouver, BC, Canada, 5Pathology & Laboratory Medicine, University of British Columbia, Vancouver, BC, Canada, 6Vancouver General Hospital, Vancouver, BC, Canada, 7Vancouver Spine Surgery Institute, Vancouver, BC, Canada
1International Collaboration on Repair Discoveries (ICORD), Vancouver, BC, Canada, 2Radiology, University of British Columbia, Vancouver, BC, Canada, 3Physics & Astronomy, University of British Columbia, Vancouver, BC, Canada, 4UBC MRI Research Centre, Vancouver, BC, Canada, 5Pathology & Laboratory Medicine, University of British Columbia, Vancouver, BC, Canada, 6Vancouver General Hospital, Vancouver, BC, Canada, 7Vancouver Spine Surgery Institute, Vancouver, BC, Canada
Synopsis
Using human spinal cord tissue donated to the International Spinal Cord Injury Biobank, we quantitatively correlated binarized histological stains for myelin and axons with myelin- and axon-sensitive advanced MRI metrics (myelin water fraction (MWF), inhomogeneous magnetization transfer (ihMT), diffusion tensor imaging (fractional anisotropy (FA), axial diffusivity (AD), radial diffusivity, RD), diffusion basis spectrum imaging (fibre fraction, FF)). MWF, ihMT and RD had significant, moderately strong correlations with Luxol fast blue staining for myelin phospholipids. FA, AD and FF did not have any significant correlation with phosphorylated neurofilament immunohistochemistry.
Introduction
Spinal cord injury (SCI) results in demyelination and axon degeneration. Conventional MRI is used to assess injury in the acute phase (Fig. 1) but signal changes are not pathologically specific. MRI biomarkers specific to myelin and axons would be extremely useful for prognosis, clinical trials, and assessing damage before treatments such as electrical stimulation.Myelin Water Imaging (MWI) isolates the short T2 signal from water trapped between myelin bilayers, and has been histologically validated as a marker for myelin.1–3
Diffusion Basis Spectrum Imaging (DBSI) models aspects of the complex structure of pathological tissue which are inseparable with DTI analysis (which fits voxel-wise diffusion tensors, producing fractional anisotropy (FA), radial and axial diffusivity (RD, AD)). DBSI fits a composite model to separate anisotropic and isotropic signal components and determine a fiber fraction (FF).4–6
Inhomogeneous Magnetization Transfer (ihMT) detects non-aqueous protons experiencing dipolar coupling in motion-restricted environments such as lipid membranes.7,8 ihMT has been validated as a myelin biomarker9–12 and can be filtered to include only signal from tissue with long dipolar order relaxation time (T1D). This increases myelin specificity.13
Histological staining is considered the gold-standard for assessing specific tissue components and pathological processes. Stains specific to myelin phospholipids (Luxol Fast Blue, LFB) and axonal phosphorylated neurofilament (pNF) can be used to validate the specificity of myelin- and axon-sensitive MRI metrics.
Objective: Quantitatively correlate myelin- and axon-sensitive MRI metrics with LFB and pNF in human SCI tissue.
Methods
Acquisition and analysis: Three spinal cords from the International Spinal Cord Injury Biobank, donated by individuals who died at Vancouver General Hospital after suffering an acute SCI (Fig. 1), were scanned at 7T (Bruker, 4.5cm formalin-fixed spinal cord blocks, 35mm inner-diameter quadrature volume coil, room temperature):- Diffusion (multi-shell 3D diffusion-weighted SE-EPI, TR/TE=250/41.21ms, resolution=0.15x0.15x1mm3, six b=0 scans, 5 shells with b=500,1000,2000,3500,5000,7000s/mm2 and 6,15,24,42,60,80 directions respectively)14
- MWI (3D multi-echo SE, TR/TE=1000/6.5532ms, resolution=0.3x0.3x1.5mm3, 48 echoes)
- ihMT (FLASH, TE=3.95ms, resolution=0.18x0.18mm2, freq.offset=+/-8kHz, two saturation schemes: no T1D-filtering (2 cosine-modulated 1ms pulses, TR=50ms) and strong T1D-filtering (12 frequency-alternated 3.3ms repeating pulses, TR=100ms)).
- Diffusion data were susceptibility and eddy current corrected (FSL ‘top up’,‘eddy’)16,17 and fit with DTI and DBSI.4
- MWI used NNLS with flip angle optimization and stimulated echo correction18,19 to produce myelin water fraction (MWF, the signal fraction with T2 = 5-24ms).
- ihMT was analyzed in MatLab.
Correlation analysis: Five white and two grey matter regions of interest (ROIs) were manually drawn on each histology slide and corresponding MRI slice in 3D Slicer.20 Using an Otsu algorithm we thresholded histology saturation images (combining the red/green/blue channels in MatLab) to produce binary images labelled for positive myelin (LFB) or axon (pNF) staining.21 Spearman correlation coefficients (ρ) and p-values were calculated between MRI and histology mean ROI values.
Results
Myelin (Fig 4): All three myelin-sensitive metrics were significantly correlated with LFB staining. MWF had the strongest correlation, followed by ihMT and then RD. T1D-filtering slightly increased the LFB-ihMT correlation strength.Axons (Fig 5): pNF was not correlated with any of the three axon-sensitive metrics (FA, AD, FF) when combining data from all cords. Only Case 3 showed any trend towards positive correlation between pNF and FA and FF.
Discussion
The strong LFB-MWF correlation highlights the myelin specificity of MWF. RD showed the weakest correlation with LFB, perhaps because DTI is sensitive to other aspects of tissue microstructure (e.g. edema, axon alignment). T1D-filtering slightly strengthened the ihMT-LFB correlation as expected, and also moved the intercept closer to zero indicating increased myelin specificity. Variation in white matter LFB staining is likely influenced by Wallerian degeneration in white matter tracts post-injury. We plan to investigate whether there are similar correlations between these myelin MRI metrics and myelin basic protein staining.None of the axon-sensitive MRI metrics correlated with pNF, perhaps because of the small range of pNF staining fraction (20-40% compared to 10-70% in LFB). Only Case 3, the patient with the longest injury-death interval (IDI), trended towards positive correlation of pNF with FA and FF. The longer IDI gave axons more time to degenerate post-injury which may have strengthened the correlation between pNF and MRI measures of axon integrity. We hypothesise that the lack of correlation in Cases 1 and 2 is because, while axon degeneration had reduced MRI metrics, removal of pNF-positive degenerating axons had not occurred yet before death. Future analysis will correlate axon-sensitive MRI metrics with other axonal stains.
Conclusion
MWF, ihMT and RD had significant correlations with LFB staining for myelin, supporting the use of all three as biomarkers for demyelination after SCI. Each technique has characteristics which may recommend it for specific applications. FA, AD and FF did not significantly correlate with pNF staining, possibly due to uniform staining in the white matter due to short injury-death interval.Acknowledgements
We would like to thank the patients and families for tissue donation to the International Spinal Cord Injury Biobank. Funding for the Biobank and this study was provided by the Blusson Integrated Cures Partnership (BICP), VGH and UBC Hospital Foundation, and the Rick Hansen Foundation, an International Collaboration on Repair Discoveries (ICORD) Seed Grant and NSERC.References
- Laule, C. et al. Myelin water imaging in multiple sclerosis: quantitative correlations with histopathology. Multiple Sclerosis Journal. 12, 747–753 (2006).
- Laule, C. et al. Myelin water imaging of multiple sclerosis at 7T: correlations with histopathology. NeuroImage 40, 1575–1580 (2008).
- Laule, C. et al. High-resolution myelin water imaging in post-mortem multiple sclerosis spinal cord: A case report. Multiple Sclerosis Journal. 22, 1485–1489 (2016).
- Wang, Y. et al. Quantification of increased cellularity during inflammatory demyelination. Brain 134, 3587–3598 (2011).
- Wang, X. et al. Diffusion basis spectrum imaging detects and distinguishes coexisting subclinical inflammation, demyelination and axonal injury in experimental autoimmune encephalomyelitis mice. NMR in Biomedicine. 27, 843–852 (2014).
- Chiang, C.-W. et al. Quantifying white matter tract diffusion parameters in the presence of increased extra-fiber cellularity and vasogenic edema. NeuroImage 101, 310–319 (2014).
- Zhang, L. et al. A comparison study of inhomogeneous magnetization transfer (ihMT) and magnetization transfer (MT) in multiple sclerosis based on whole brain acquisition at 3.0 T. Magnetic Resonance Imaging 70, 43–49 (2020).
- Manning, A. P., Chang, K. L., MacKay, A. L. & Michal, C. A. The physical mechanism of ‘inhomogeneous’ magnetization transfer MRI. Journal of Magnetic Resonance 274, 125–136 (2017).
- Varma, G., Duhamel, G., de Bazelaire, C. & Alsop, D. C. Magnetization Transfer from Inhomogeneously Broadened Lines: A Potential Marker for Myelin. Magnetic Resonance in Medicine. 73, 614–622 (2015).
- Girard, O. M. et al. Magnetization transfer from inhomogeneously broadened lines (ihMT): Experimental optimization of saturation parameters for human brain imaging at 1.5 Tesla. Magnetic Resonance Medicine 73, 2111–2121 (2015).
- Duhamel, G. et al. Validating the sensitivity of inhomogeneous magnetization transfer (ihMT) MRI to myelin with fluorescence microscopy. NeuroImage 199, 289–303 (2019).
- Prevost, V. H. et al. Inhomogeneous Magnetization Transfer (ihMT) sensitivity to myelin impairments in cuprizone mouse model. in Proc. Int. Soc. Mag. Res. Med. 26 (2018).
- Prevost, V. H. et al. Optimization of inhomogeneous magnetization transfer (ihMT) MRI contrast for preclinical studies using dipolar relaxation time (T1D) filtering. NMR in Biomedicine. 30, e3706 (2017).
- Cheng, J., Shen, D., Yap, P.-T. & Basser, P. J. Single- and Multiple-Shell Uniform Sampling Schemes for Diffusion MRI Using Spherical Codes. IEEE Transactions on Medical Imaging 37, 185–199 (2018).
- Coupe, P. et al. An optimized blockwise nonlocal means denoising filter for 3-D magnetic resonance images. IEEE Transactions on Medical Imaging 27, 425–441 (2008).
- Andersson, J. L. R., Skare, S. & Ashburner, J. How to correct susceptibility distortions in spin-echo echo-planar images: application to diffusion tensor imaging. NeuroImage 20, 870–888 (2003).
- Andersson, J. L. R. & Sotiropoulos, S. N. An integrated approach to correction for off-resonance effects and subject movement in diffusion MR imaging. NeuroImage 125, 1063–1078 (2016).
- Prasloski, T., Mädler, B., Xiang, Q.-S., MacKay, A. & Jones, C. Applications of stimulated echo correction to multicomponent T2 analysis. Magnetic Resonance in Medicine. 67, 1803–1814 (2012).
- Whittall, K. P. & MacKay, A. L. Quantitative interpretation of NMR relaxation data. Journal of Magnetic Resonance. 1969 84, 134–152 (1989).
- Kikinis, R., Pieper, S. D. & Vosburgh, K. G. 3D Slicer: A Platform for Subject-Specific Image Analysis, Visualization, and Clinical Support. in Intraoperative Imaging and Image-Guided Therapy (ed. Jolesz, F. A.) 277–289 (Springer, 2014).
- Otsu, N. A Threshold Selection Method from Gray-Level Histograms. IEEE Transactions on Systems Man and Cybernetics. SMC-9, 62–66 (1979).
Figures
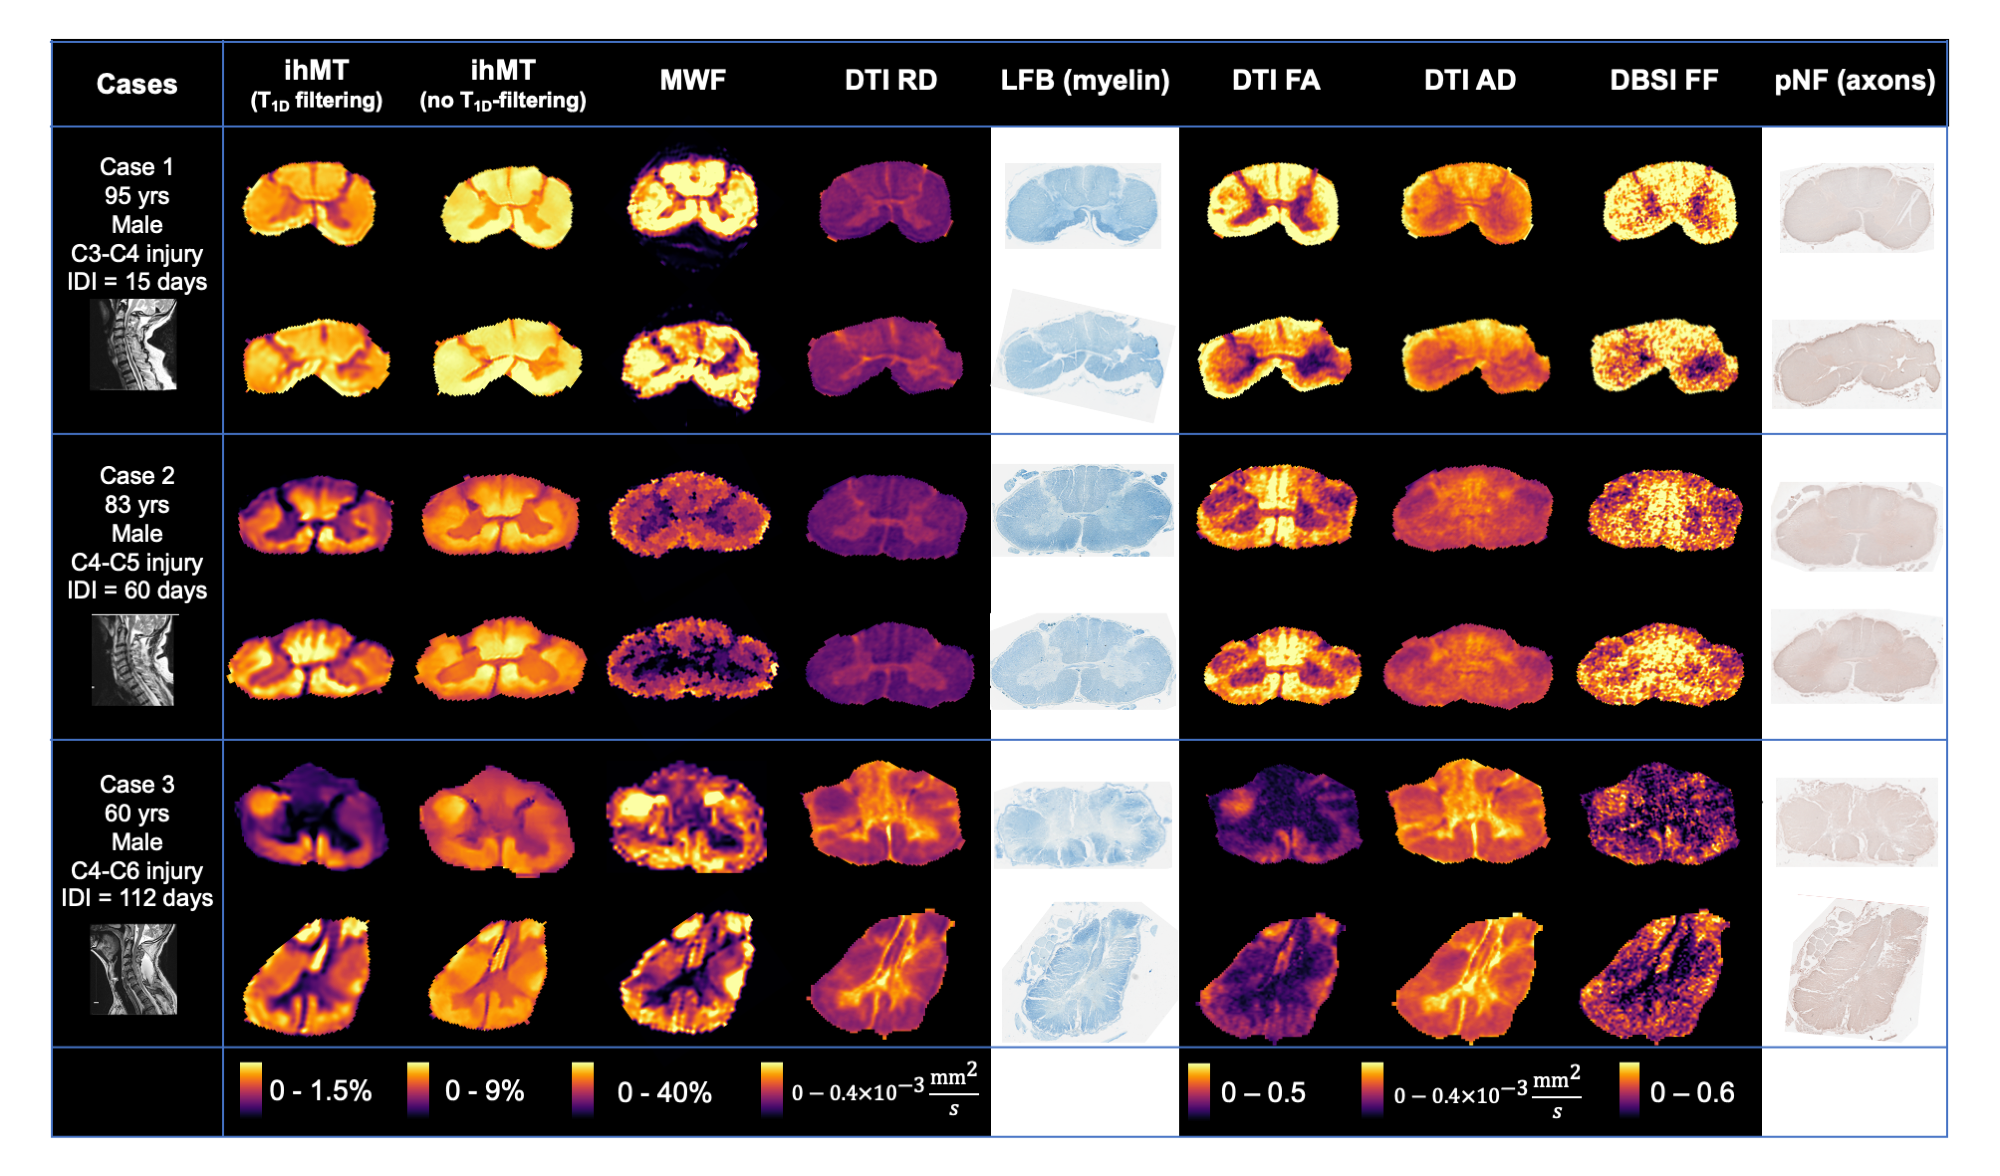
Figure 1: MRI and histology data for patients from the International Spinal Cord Injury Biobank included in this study. Advanced MRI was collected 9mm above and 9mm below injury epicentre. IDI: injury-death interval; ihMT: inhomogeneous magnetization transfer; MWF: myelin water fraction; DTI: diffusion tensor imaging; RD: radial diffusivity; LFB: Luxol fast blue; FA: fractional anisotropy; AD: axial diffusivity; DBSI: diffusion basis spectrum imaging; FF: fibre fraction; pNF: phosphorylated neurofilament.
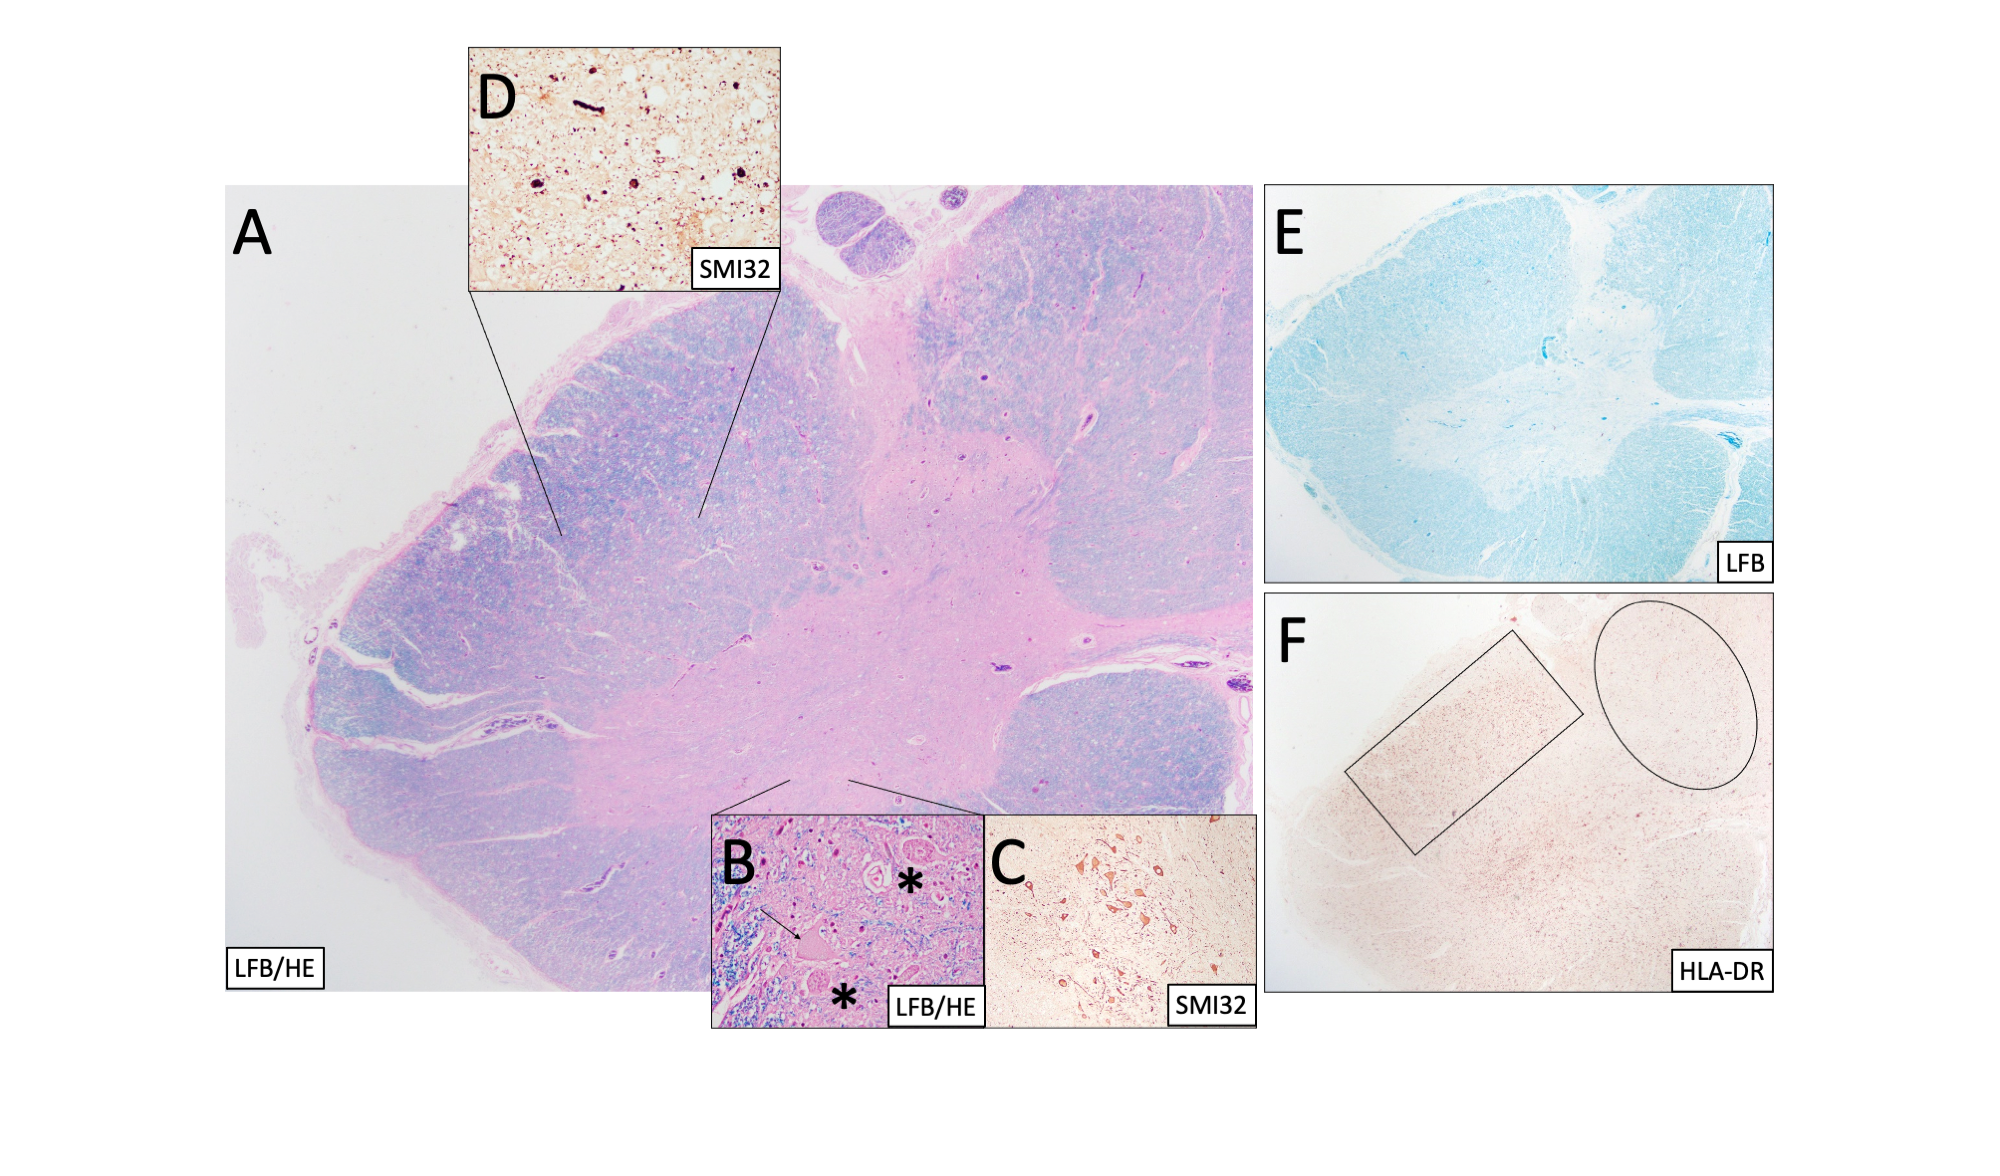
Figure 2: (Case 2) (A) Spinal cord stained with Luxol fast blue (LFB) and hematoxylin & eosin (H&E) at 20x mag shows central grey matter (pink) and surrounding white matter tracts (blue). (B) Higher mag (400x) shows motor neurons (asterisks) and swollen neurons (arrow). SMI32 shows (C) abnormally stained neuronal bodies and (D) chronic axonal swellings. (E) LFB shows myelinated regions only. (F) HLA-DR shows less reactive microglia in the dorsal column (oval) than the lateral column (rectangle).
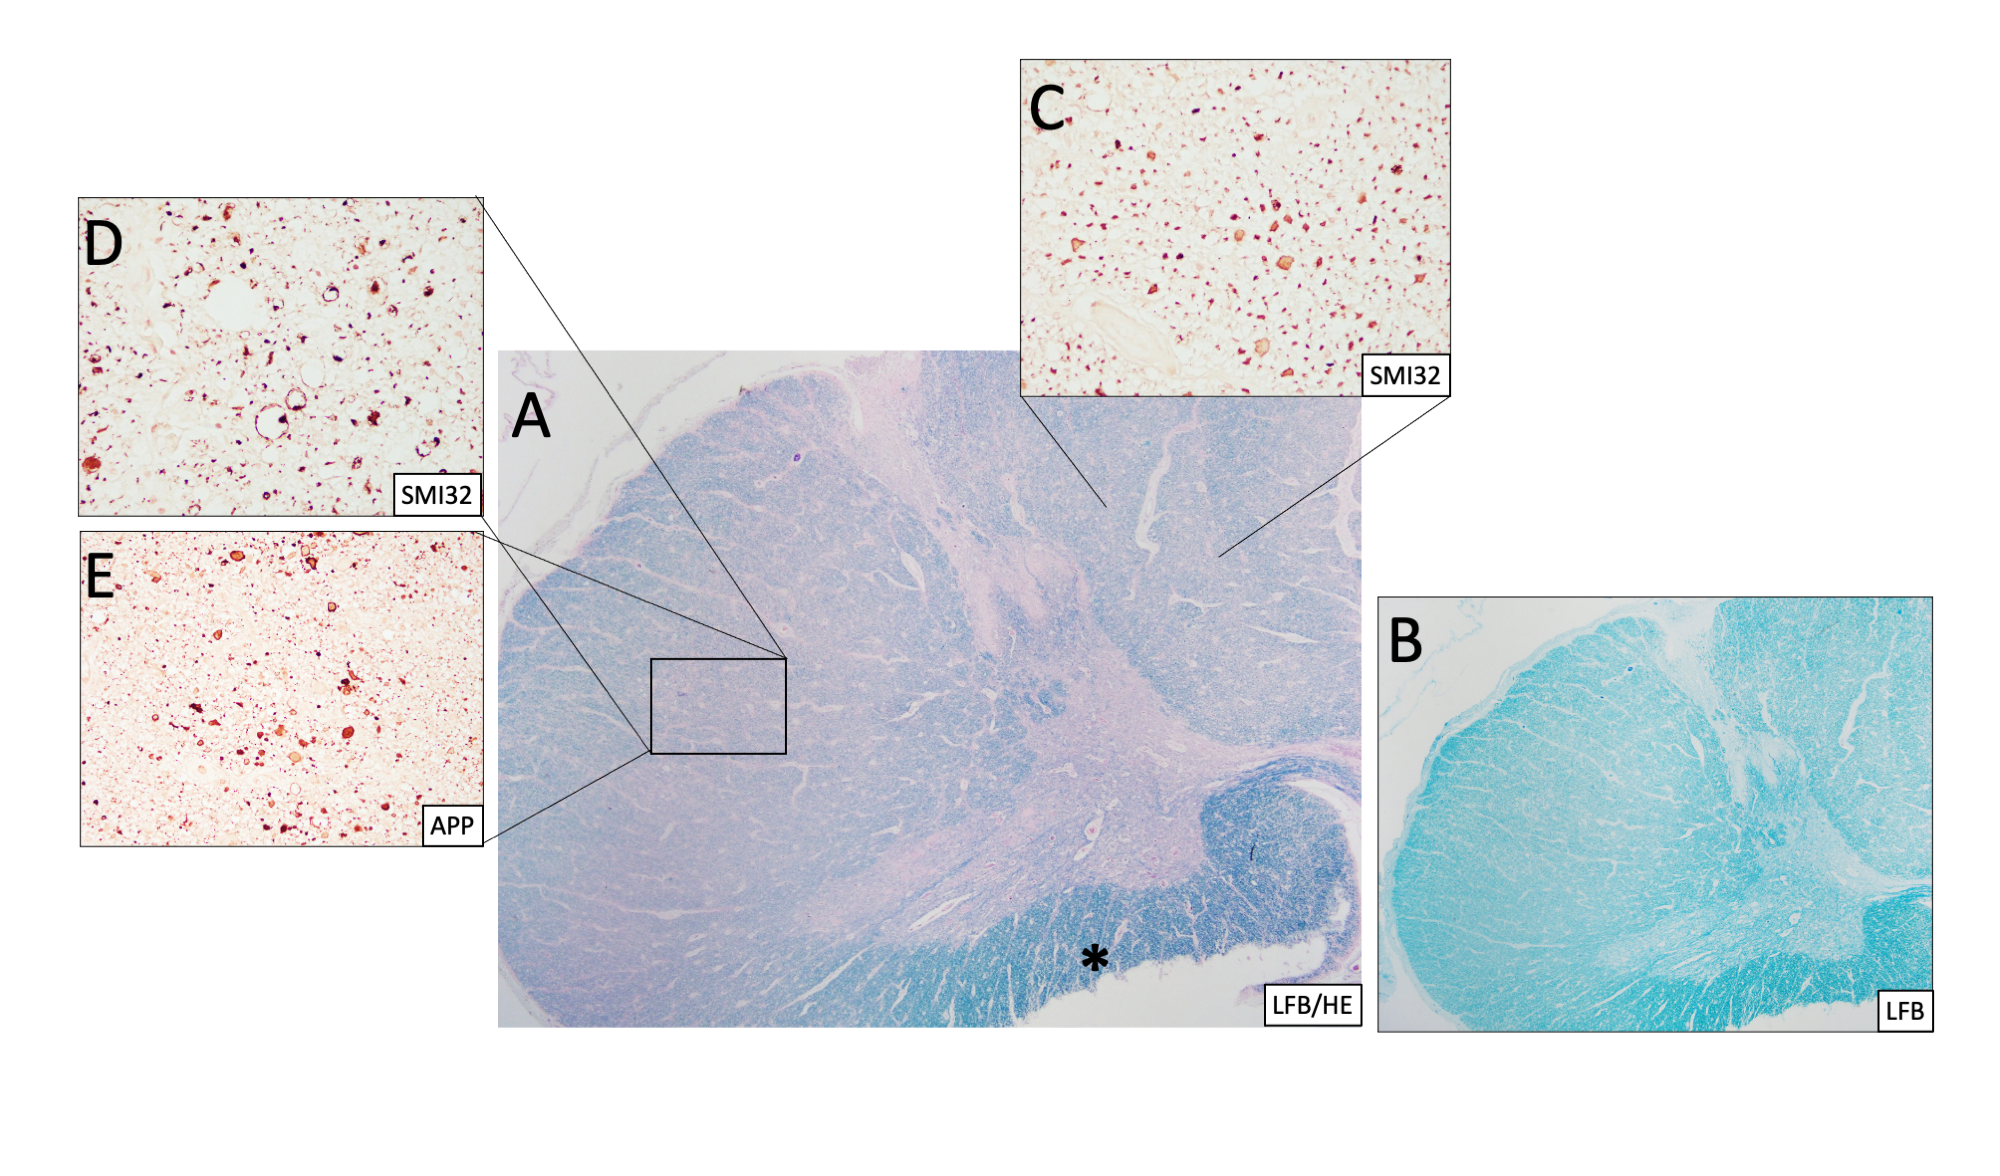
Figure 3: (Case 1) (A) Spinal cord stained with Luxol-fast blue (LFB) and hematoxylin & eosin (H&E) and (B) LFB only at 20x magnification showing loss of myelin of the posterior and lateral columns (compared to Fig 2) and preservation of myelin in the anterior funiculus (*). SMI32 and amyloid precursor protein (APP) reveal abnormal chronic axonal swellings in the posterior (C) and lateral columns (D&E). APP shows axons in the lateral columns with ongoing degeneration (D).
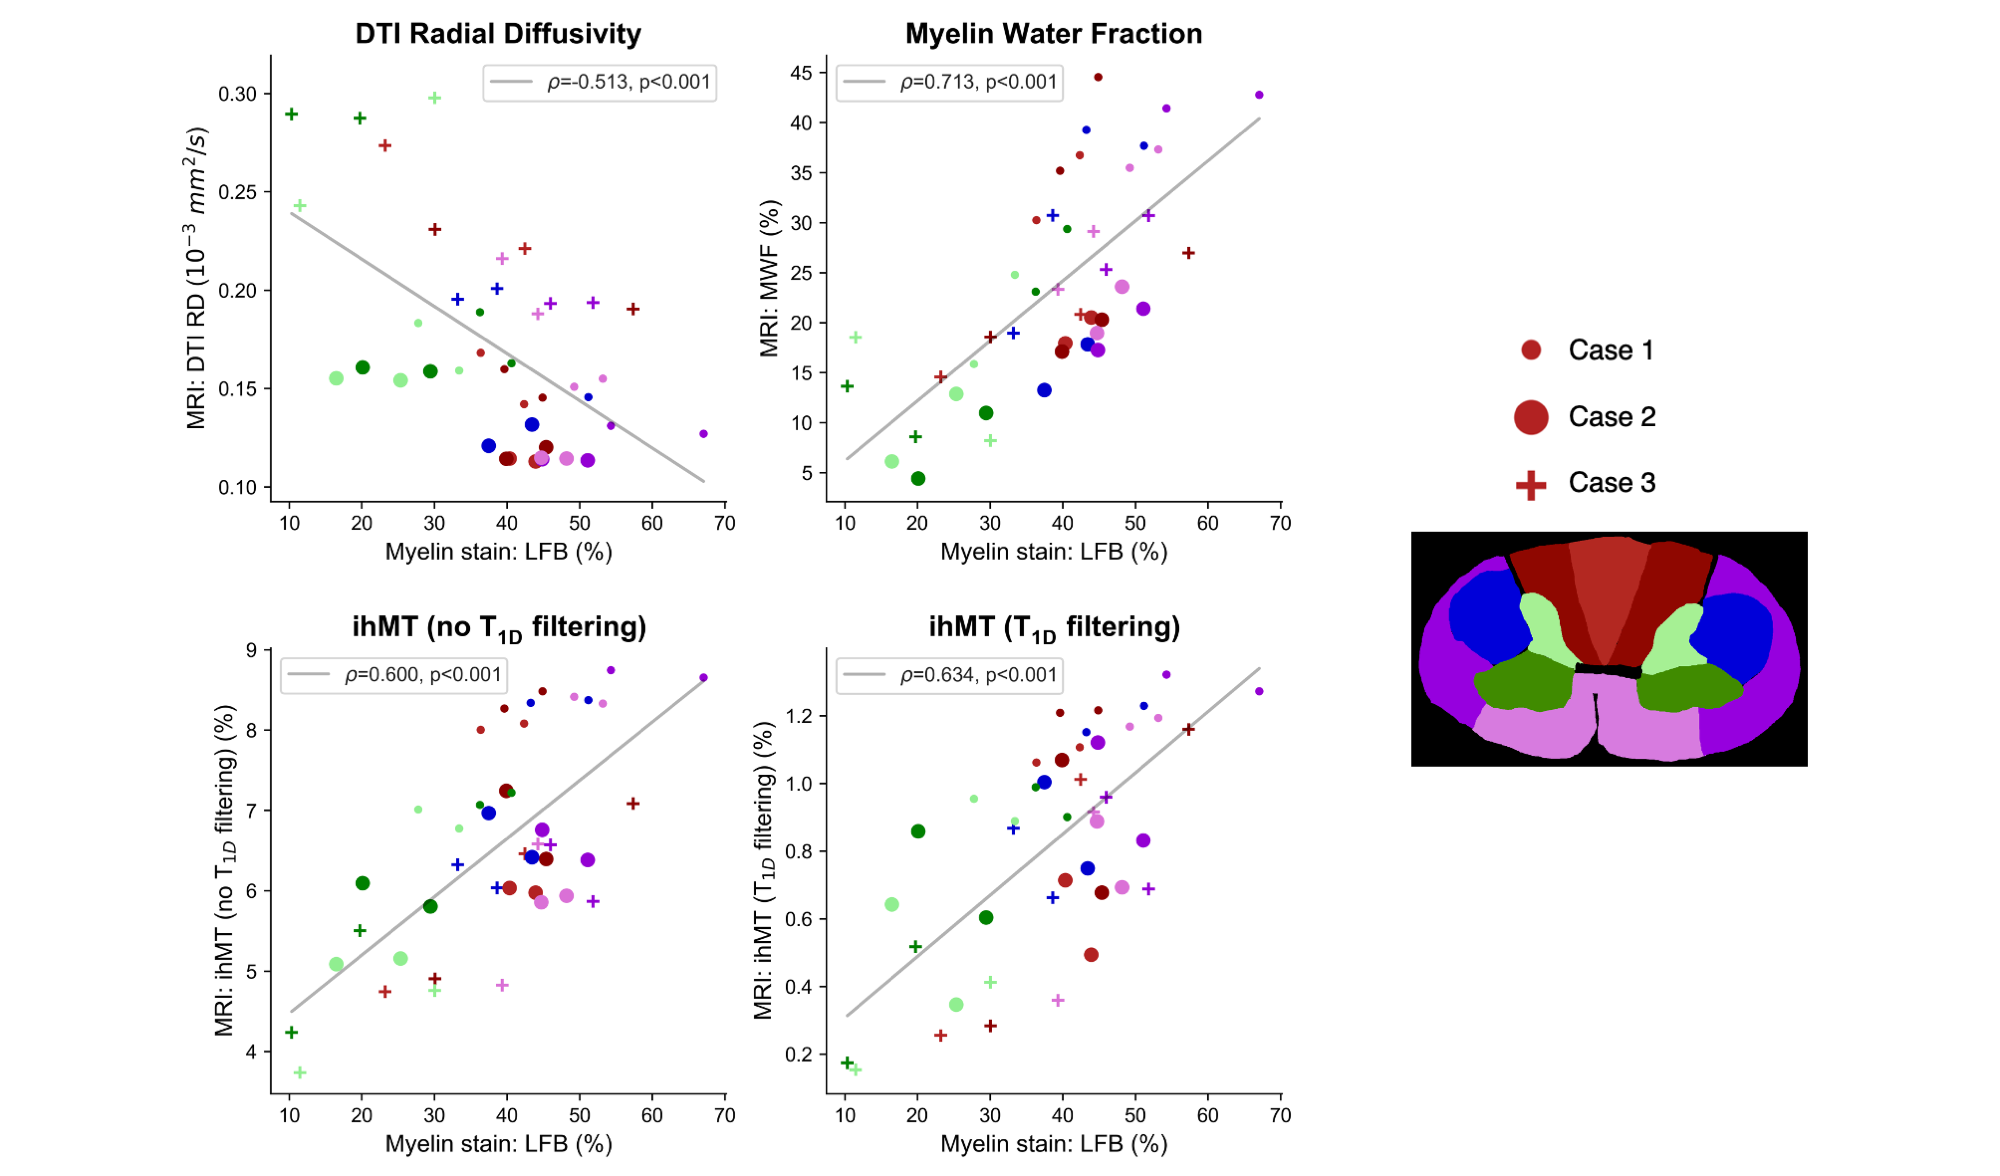
Figure 4: Spearman correlations between Luxol fast blue (LFB) staining for myelin phospholipids and three myelin-sensitive MRI metrics (radial diffusivity (RD), myelin water fraction (MWF), inhomogeneous magnetization transfer (ihMT)). All three metrics had significant, moderately strong correlations with LFB. MWF had the strongest correlation, RD the weakest. T1D filtering slightly increased the strength of the correlation with ihMT.
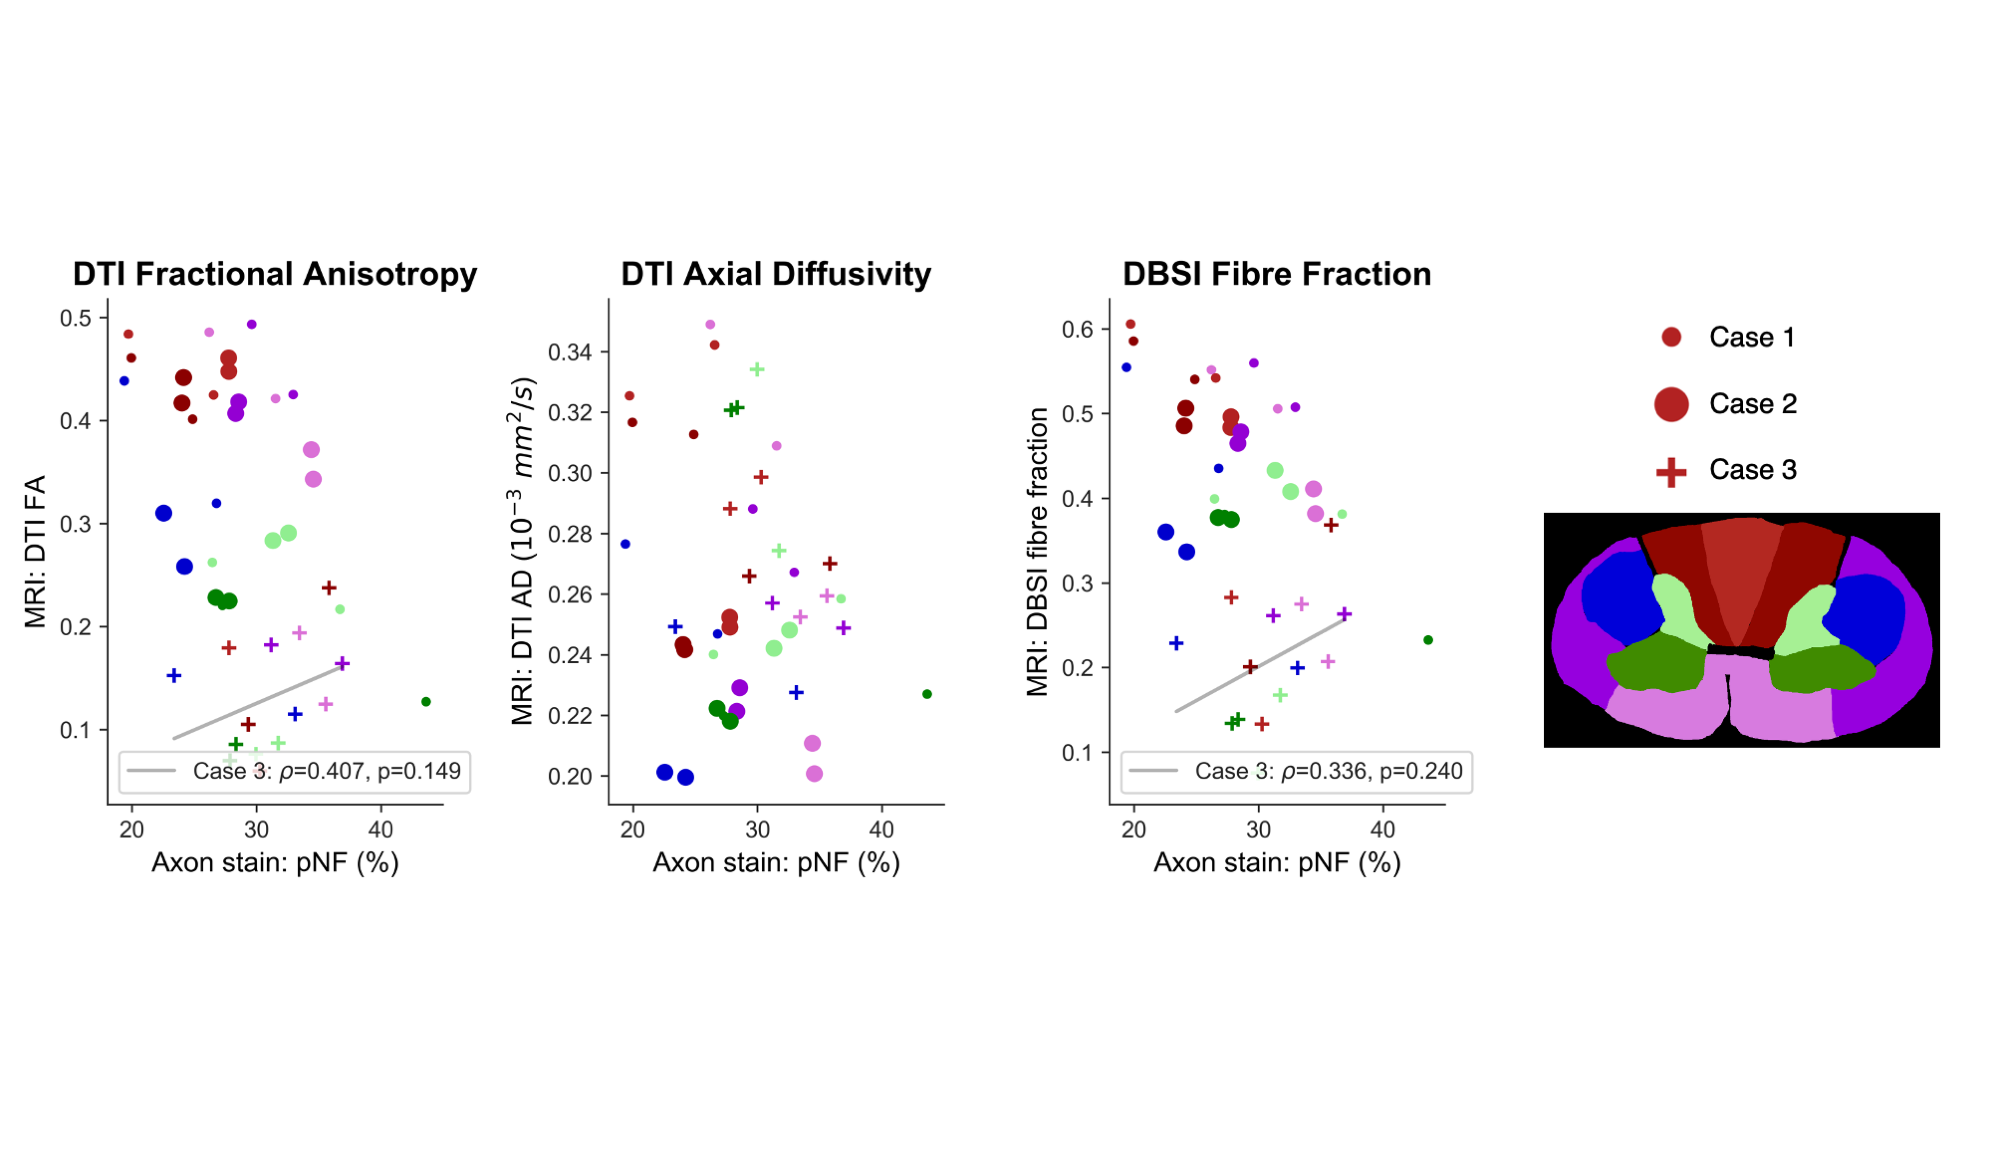
Figure 5: Spearman correlations between phosphorylated neurofilament (pNF) staining for axons and three axon-sensitive MRI metrics (fractional anisotropy (FA), axial diffusivity (AD), fibre fraction). Combining data from all three cords gave no significant correlations. Only Case 3 showed any trend towards positive correlations with DTI FA and DBSI fibre fraction.