0652
Detection of resting state correlations between white matter tracts in spinal cord using BOLD fMRI and their changes with injury1Vanderbilt University Medical Center, Nashville, TN, United States
Synopsis
The study objective was to detect and quantify correlations between resting state BOLD signals in WM of spinal cord (SC) as potential indicator of functional connectivity, and evaluate changes that occur following injury. At first, BOLD activation was detected in response to tactile stimuli in certain WM regions in the SC of squirrel monkeys. Next, localized BOLD activity was observed during resting state in SC regions which resembled closely to WM tracts. There was a drop in resting state WM correlations after injury, followed by gradual recovery with time which mimics the pattern of SC functional recovery after an injury.
INTRODUCTION
Recent studies have shown that resting state correlations between blood-oxygenation-level-dependent (BOLD) signals in gray matter (GM) of the spinal cord (SC) are robustly detectable and indicate presence of functional connectivity within the cord1,2. In addition, although BOLD signals have been difficult to detect in white matter (WM), and so have been largely overlooked, we and others have shown that BOLD signals can be reliably evoked in WM of the brain during a task3-6. Furthermore, in a resting state, correlations in BOLD signal fluctuations in WM appear similar to those used to infer functional connectivity in cortex7. In this study we extended our investigation to whether robust correlations between resting state signals can be detected and quantified in WM of spinal cord, and whether these correlations changed following a targeted injury to a WM tract. Rather than having a priori hypotheses regarding locations in WM which may have functional association, a data driven technique, Independent Components Analysis (ICA), was used to identify such regions of interest (ROI) in WM of SC8.METHODS
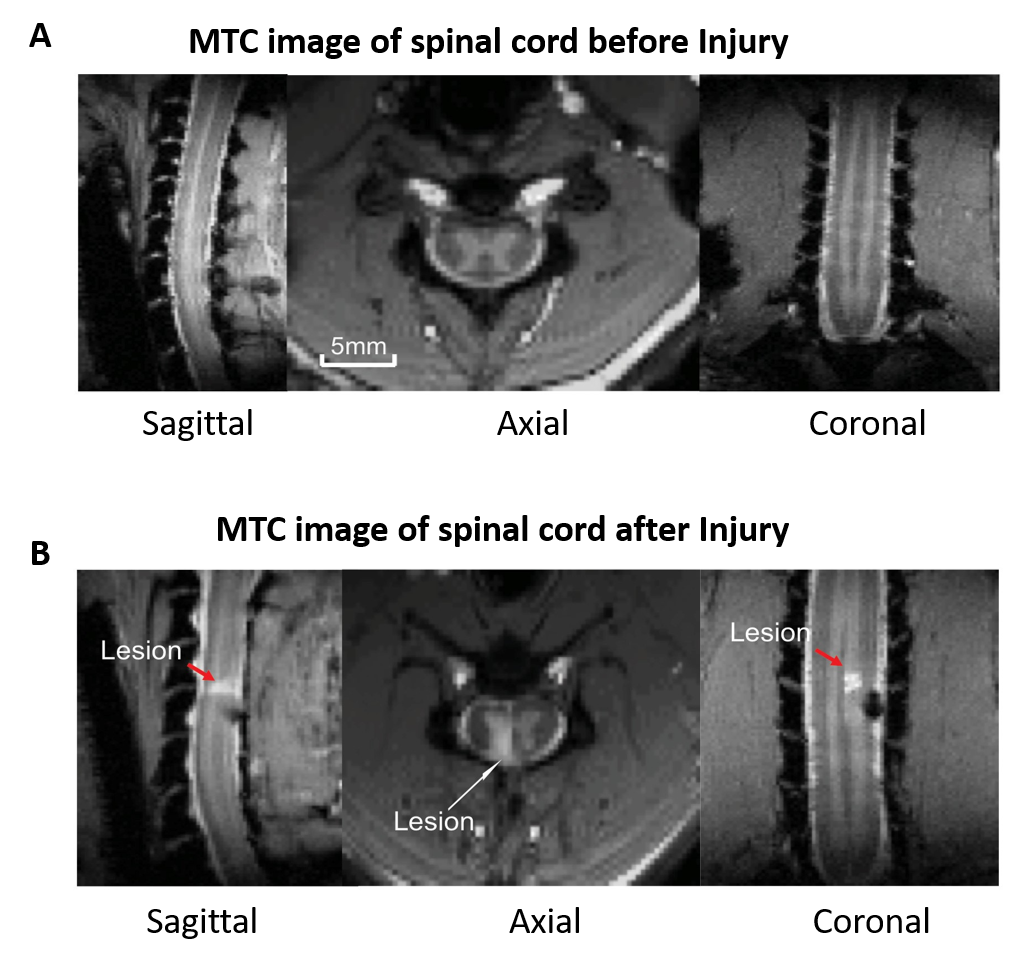
Images of five axial slices covering C3-C7 cervical segments of anaesthetized squirrel monkeys were acquired using a custom neck coil by an Agilent 9.4T scanner. At first, multiple runs (4 to 6) of stimulus evoked (8-Hz vibratory tactile stimulation applied to the distal finger pad of digit 2&3 of the dominant hand) fMRI data (150 dynamics each run) were acquired during a block-design protocol (30 second ‘on’-30 second ‘off’ epochs) from 5 monkeys. Next, resting state fMRI data (300 dynamics, 15 runs from 5 monkeys) were acquired before and after a targeted unilateral surgical transection of the dorsal column at C5 level (Fig. 1). Resting state data were collected at three-time points (2weeks, 7-8weeks and 16-22weeks) after injury. FMRI data was acquired using a fast gradient echo sequence (flip angle = ~18°, TR = 46.88ms, TE: 6.5ms, 3s per volume). Motion, physiological signal correction (RETROICOR) and band pass filtering (0.01-0.1 Hz) were performed on the fMRI data, followed by co-registering to a customized template using FSL to facilitate group level analyses9,10. Group spatial ICA was performed by temporal concatenation of the resting state data from all runs using GIFT software and thirty spatially independent components were extracted within the WM region of SC8. Next, twenty-nine ROIs with localized hyperactivity were identified from the five slices by visual inspection of the spatial profiles of each Independent Component (IC) and were compared with the location of histologically identified WM tracts in cervical SC11. Within ROI Connectivity (WROIC), which is measured by the power of the time course of each identified IC, and Between ROI Connectivity (BROIC), which is measured as the correlation of time courses of the identified IC pairs, were calculated as two resting state connectivity measures before and after SCI at different time points, followed by statistical tests for comparison.RESULTS
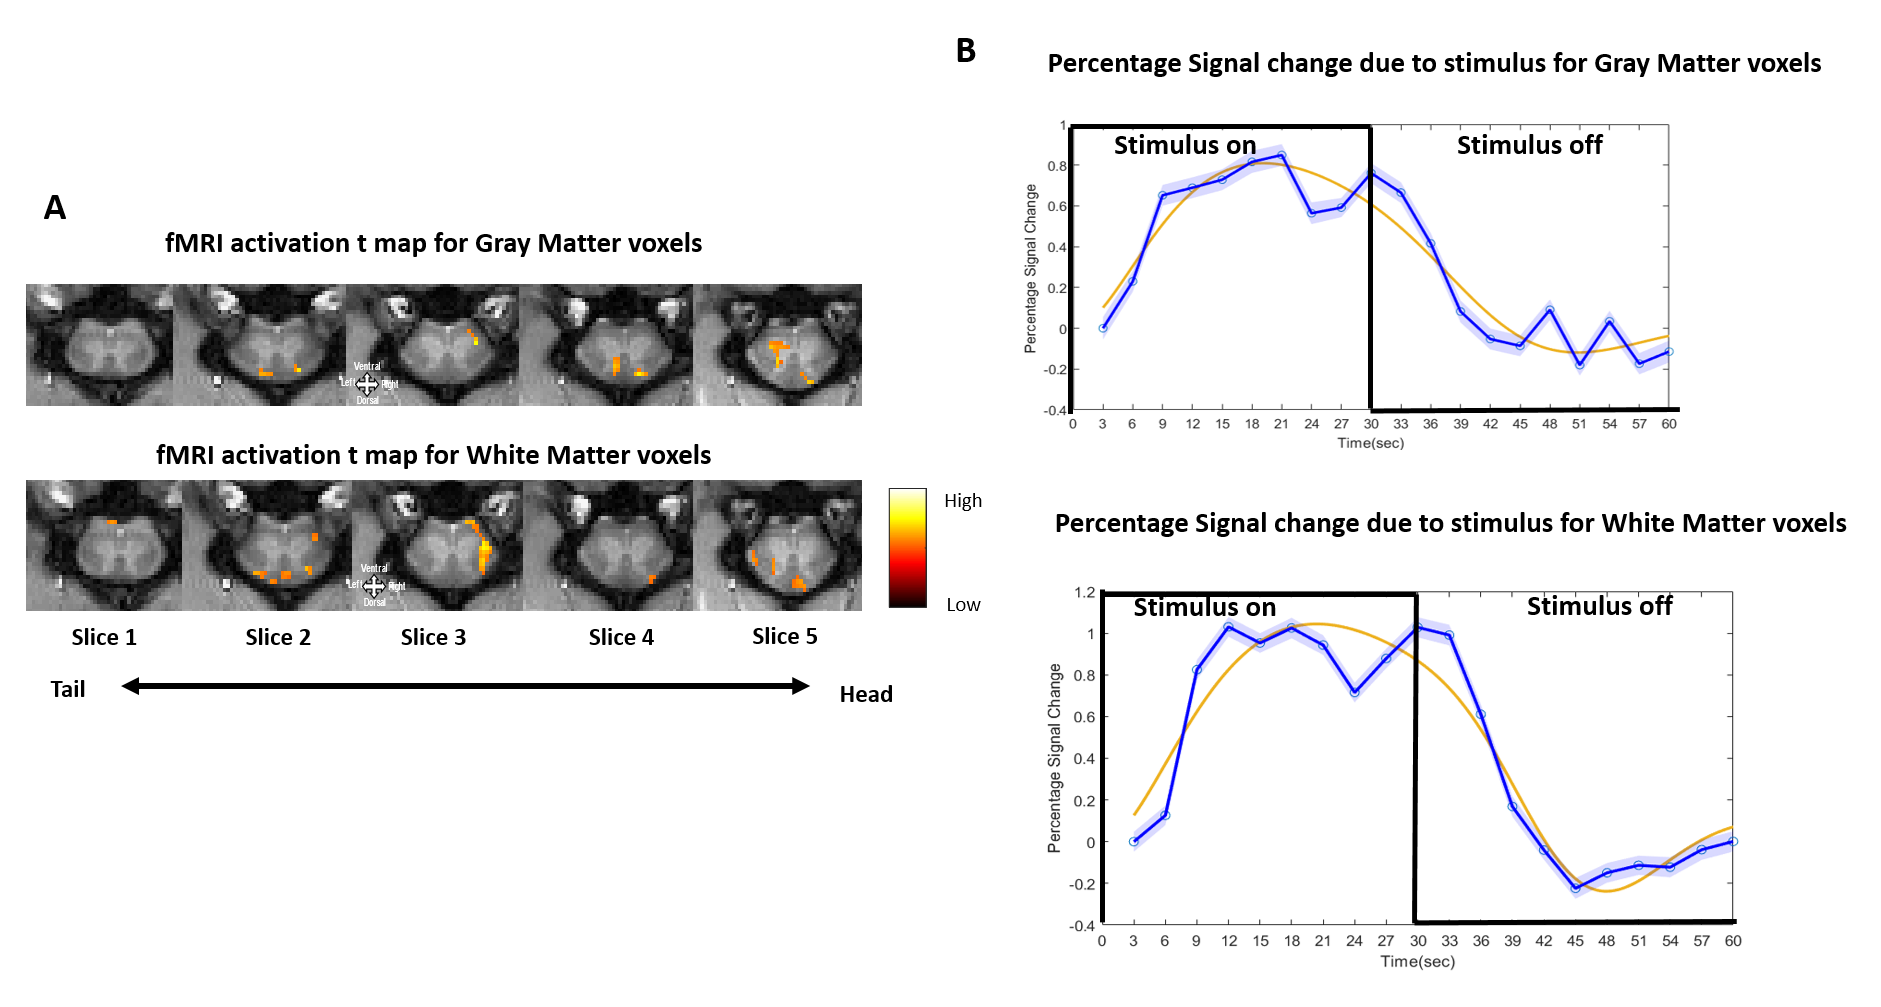
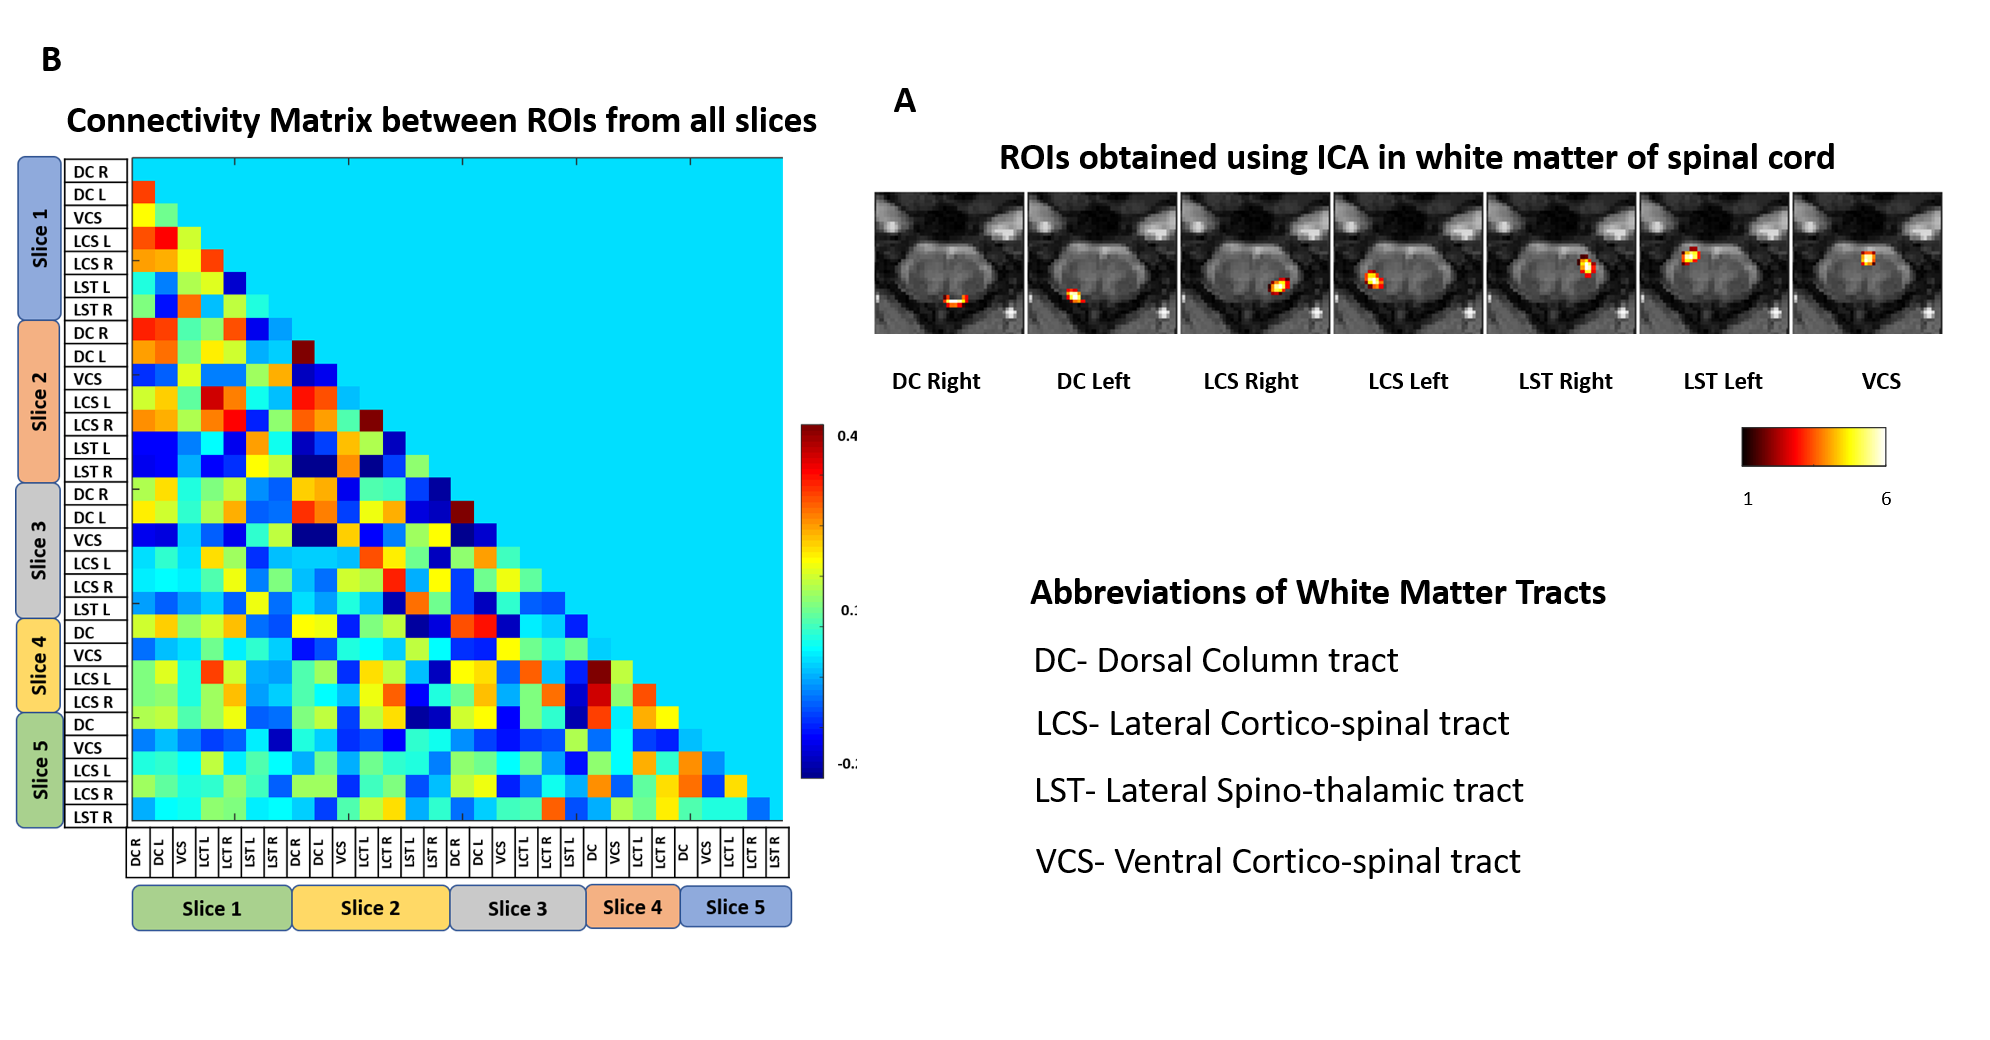
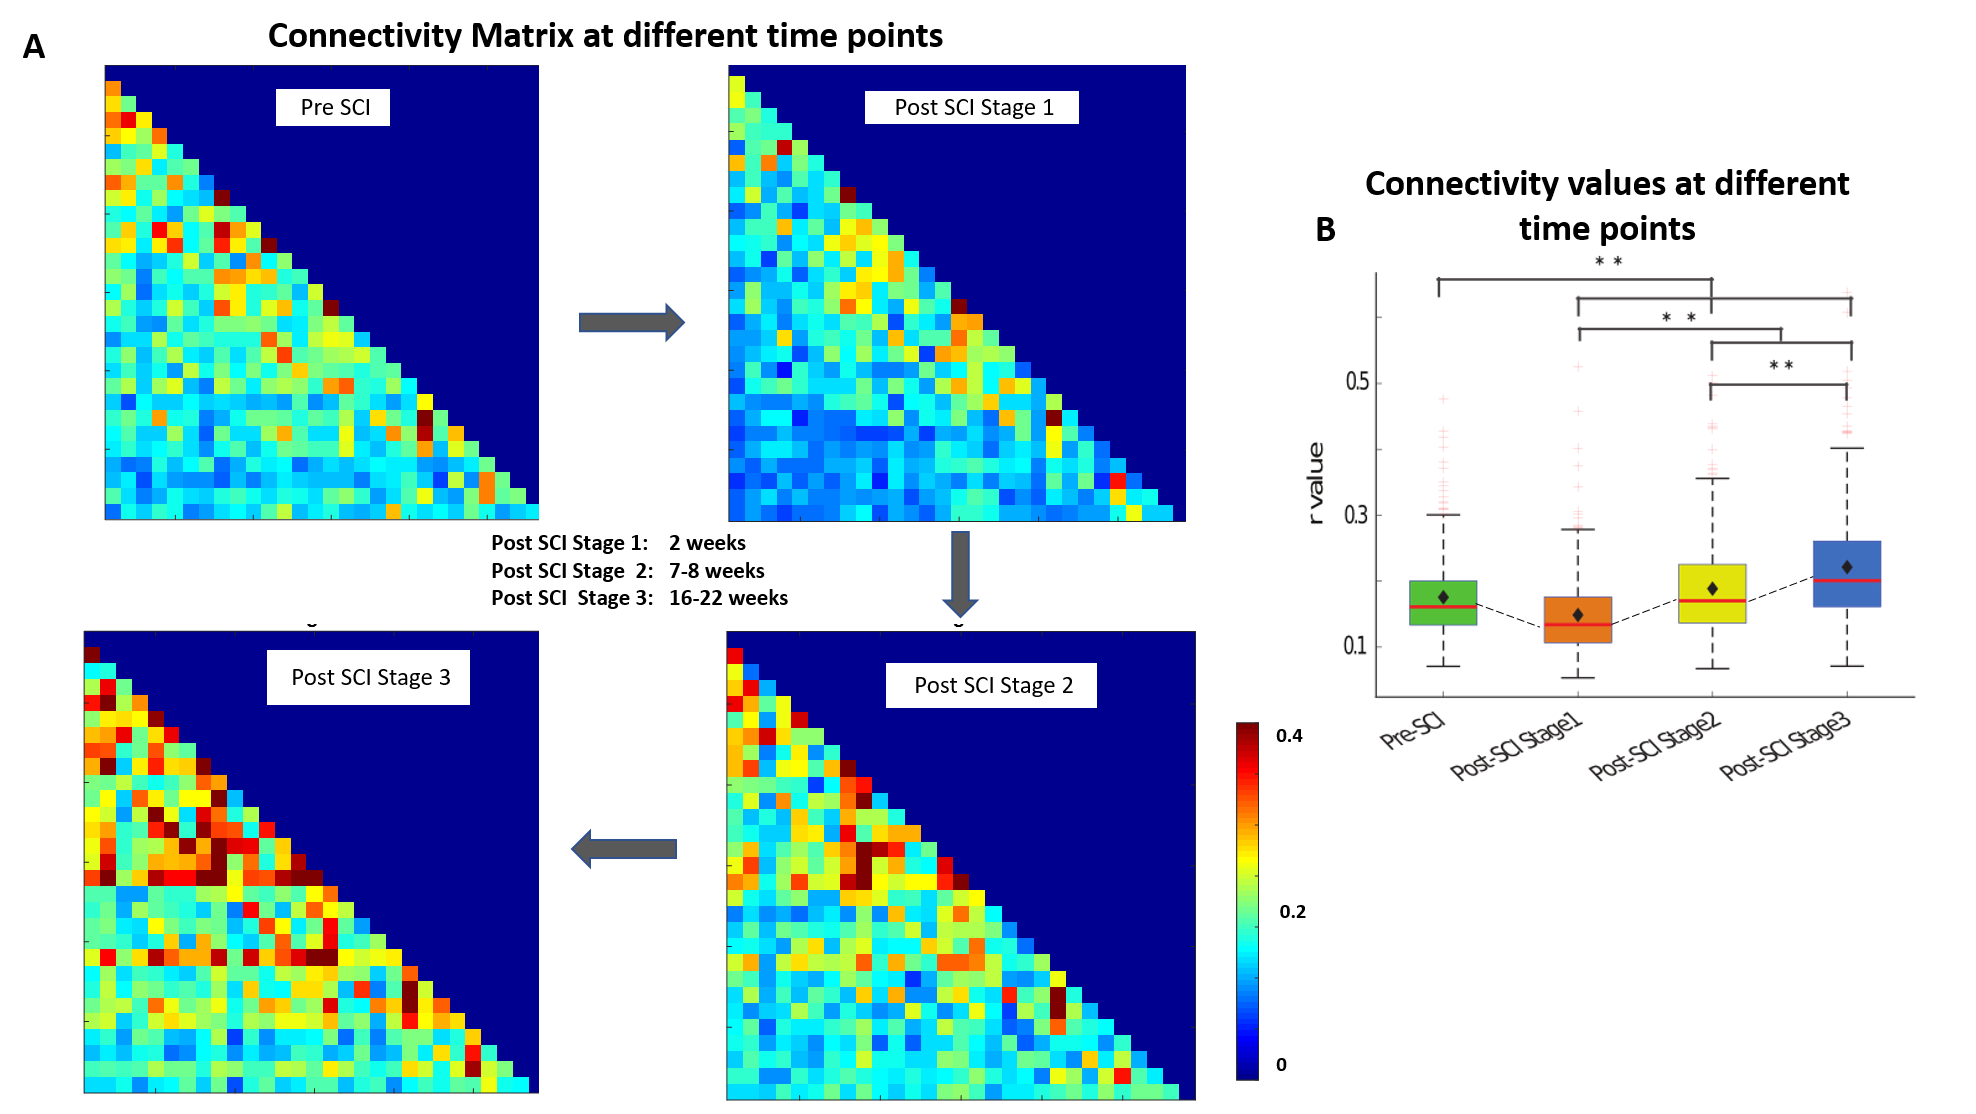
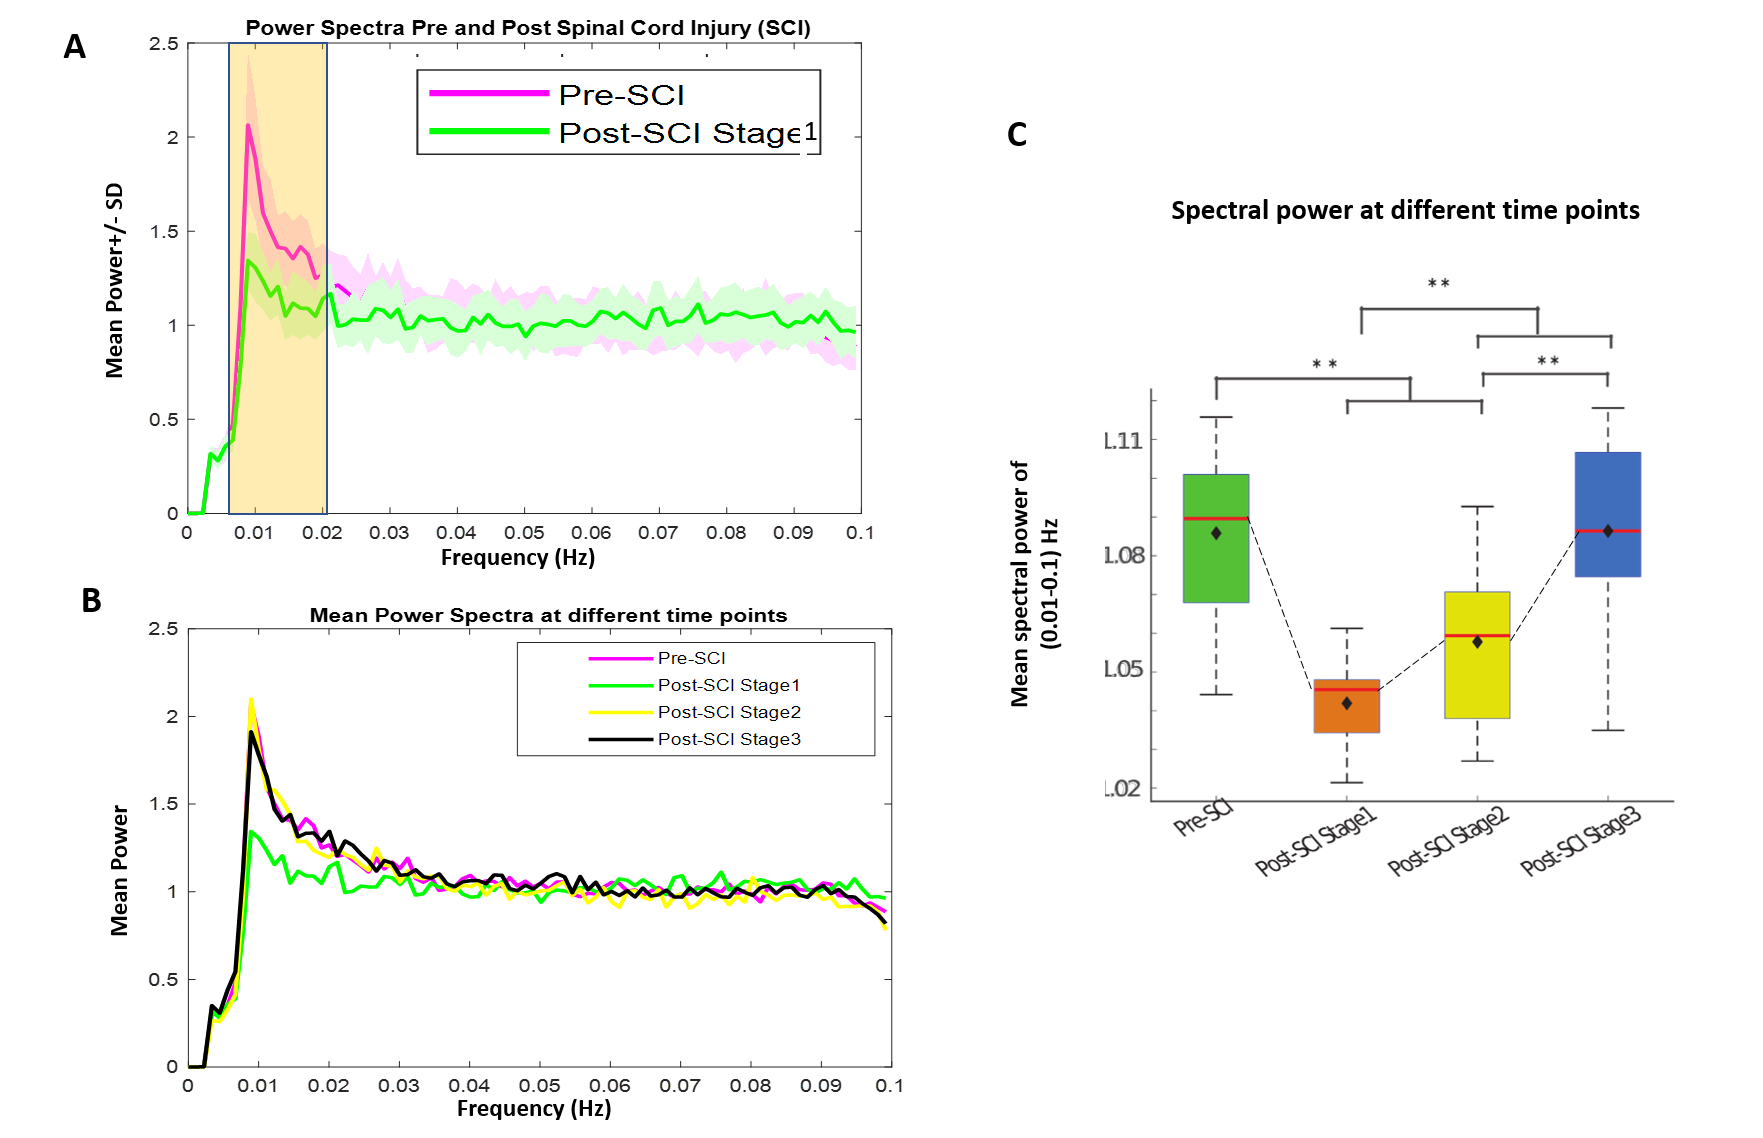
Stimulus evoked fMRI activation was detected predominately on the dorsal horns of the GM (slice 2,4,5) as well as in certain regions of white matter (Fig2A). The time course of fMRI signals showed robust, synchronous changes in response to tactile stimuli, from the activated voxels in GM as well as in WM (Fig 2B). At resting state, seven regions of localized hyperactivity were identified (not from all slices) from the spatial maps of ICs, which corresponded closely to previously known locations of WM tracts in SC12 (Fig3A). Box-plots of connectivity measures (absolute values) between the obtained ROIs show a significant drop in BROIC post injury at Stage 1 which gradually recovered back and surpassed baseline connectivity significantly by the last time point (Fig4B). There was a conspicuous decrease in the WROIC after injury as seen from the power spectra averaged over all ICs (Fig5A), with the maximum drop occurring below 0.02 Hz. The WROIC follows a similar pattern of recovery as that of BROIC, with time post injury (Fig5C).DISCUSSION
Detection of stimulus-evoked BOLD signals in WM of SC builds on the notion that functional tasks induce activity in certain WM regions, as previously shown in brain4,12. Correlations in resting state BOLD signals were detected robustly at locations closely resembling WM tracts in SC. The pattern of drop in resting state WM correlations after injury, followed by gradual recovery with time, is similar to previous reports which studied functional recovery of GM in the SC of monkeys after an injury13,14. The precise biophysical basis of the BOLD changes seen in WM is presently not understood but they may represent vascular responses to the demands of signal transduction intrinsic to WM, or may potentially be induced by a physical coupling to vascular changes in GM.CONCLUSION
Stimulus evoked BOLD fluctuations and correlated resting state BOLD signals were observed robustly in subsets of WM tracts of SC as has been detected in brain before. Evidence of resting state correlations indicates the presence of WM functional networks which is of great significance for improved understanding of the integration and transmission of neuronal signals within the spinal cord. Resting state WM correlations mirrored SC functional integrity, at various stages of recovery after injury, and hence may have clinical relevance.Acknowledgements
This study is supported by NIH grant NS092961 and the DOD grant SC160154.References
1. Barry, R. L., Smith, S. A., Dula, A. N. & Gore, J. C. Resting state functional connectivity in the human spinal cord. Elife 2014, 1–15 (2014).
2. Kong, Y. et al. Intrinsically organized resting state networks in the human spinal cord. Proc. Natl. Acad. Sci. U. S. A. 111, 18067–18072 (2014).
3. Gore JC, Li M, Gao Y, et al. Functional MRI and resting state connectivity in white matter - a mini-review. Magn Reson Imaging. 2019; 63:1-11
4. Wu X, Yang Z, Bailey SK, et al. Functional connectivity and activity of white matter in somatosensory pathways under tactile stimulations. Neuroimage. 2017;152:371-380.
5. Rostrup E, Law I, Blinkenberg M, Larsson HBW, Born AP, Holm S, et al. Regional differences in the CBF and BOLD responses to hypercapnia: a combined PET and fMRI study. Neuroimage 2000; 11:87–97.
6. Ding Z, Xu R, Bailey SK, Wu T-L, Morgan VL, Cutting LE, et al. Visualizing functional pathways in the human brain using correlation tensors and magnetic resonance imaging. Magn Reson Imaging 2016; 34:8–17.2017;152:371–80.
7. Huang Y, Yang Y, Hao L, et al. Detection of functional networks within white matter using independent component analysis. Neuroimage. 2020; 222:117278.
8. Calhoun, V. D., Adali, T., Pearlson, G. D. & Pekar, J. J. Group ICA of Functional MRI Data: Separability, Stationarity, and Inference. Proc. ICA 2001 155–160 (2001).
9. Glover, G. H., Li, T. Q. & Ress, D. Image-based method for retrospective correction of physiological motion effects in fMRI: RETROICOR. Magn. Reson. Med. 44, 162–167 (2000)
10. Jenkinson, M. & Smith, S. A global optimisation method for robust affine registration of brain images. Med. Image Anal. 5, 143–156 (2001).
11. Khan YS, Lui F. Neuroanatomy, Spinal Cord. [Updated 2020 Jul 31]. In: StatPearls [Internet]. Treasure Island (FL): StatPearls Publishing; 2020 Jan.
12. Huang Y, Bailey SK, Wang P, Cutting LE, Gore JC, Ding Z. Voxel-wise detection of functional networks in white matter. Neuroimage 2018;183:544–52.
13. Chen, L. M., Mishra, A., Yang, P.-F., Wang, F. & Gore, J. C. Injury alters intrinsic functional connectivity within the primate spinal cord. Proc. Natl. Acad. Sci. 112, 5991–5996 (2015).
14. Wang F, Zu Z, Wu R, Wu TL, Gore JC, Chen LM. MRI evaluation of regional and longitudinal changes in Z-spectra of injured spinal cord of monkeys. Magn Reson Med. 2018 Feb;79(2):1070-1082.
Figures