0651
The good, the bad and the ugly : a retrospective study of image quality in human cervical spinal cord MRI at 7T1Aix-Marseille University, CNRS, CRMBM, Marseille, France, 2AP-HM, Hôpital de la Timone, CEMEREM, Marseille, France, 3AP-HM, Hôpital de la Timone, Neurology Dept., Marseille, France, 4AP-HM, Hôpital de la Timone, Neuromuscular Disease Dept., Marseille, France, 5AP-HM, Hôpital Nord, Neurosurgery Dept., Marseille, France
Synopsis
In the context of fast expansion of 7T clinical MR systems for neurological applications, a retrospective evaluation of cervical spinal cord image quality acquired on 41 patients and 25 healthy controls was performed. Several morphometric parameters were collected, and four MR modalities were rated. Altogether, this study provides guidance for both clinicians and physicists, regarding current sequence robustness and most frequent problems to be addressed.
Introduction
Ultra-high-field (7T) MR systems have become more widely available and are now employed for clinical brain investigations 1,2. 7T Spinal Cord (SC) MRI is clearly not as mature 3, however thanks to improved spatial resolution 4,5, sharp white and gray matter (WM/GM) substructure delineation 6,7 and increased contrast-to-noise ratio, it offers great perspectives for pathological characterization 8, 9,10,11,12,13. In line with recent advances and in the perspectives of further 7T SC MRI clinical explorations, this retrospective study provides feedbacks on “conventional” anatomical and structural sequence robustness and image-quality driving factors.Methods
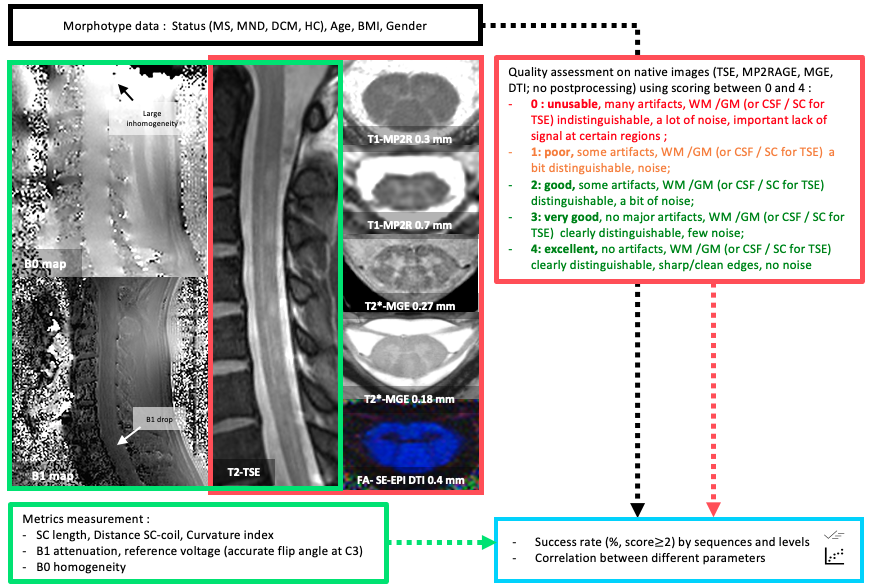
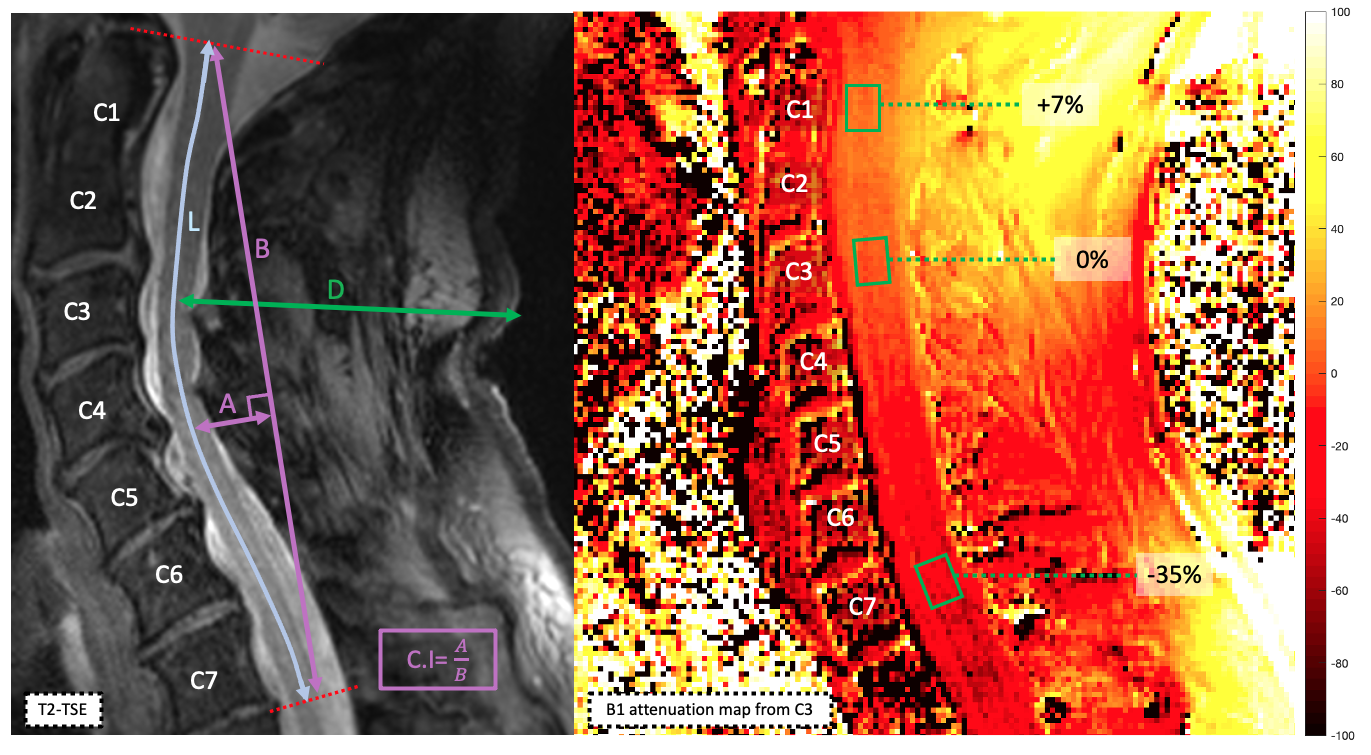
Anatomical and structural data collected in 41 patients (Degenerative Cervical Myelopathy (DCM), Motor Neuron Disease (MND), Multiple Sclerosis (MS)) and 25 Healthy Controls (HC) were retrospectively analyzed. Datasets included multi-slice 2D sagittal turbo-spin echo (TSE), axial multi-echo gradient-echo (T2* MGE, 2 resolutions), axial single-shot spin-echo EPI diffusion and 3D MP2RAGE (2 resolutions) sequences acquired at 7T with a commercial 8Tx/8Rx coil used in CP mode, based on previously published parameters 6,7,14.Various metrics (L, D, C.I15) and scorings were defined (see fig.1 and 2) from native data (i.e. no denoising, no correction, no composing) to perform a conservative global image quality assessment and to identify the most penalizing factors.
Results
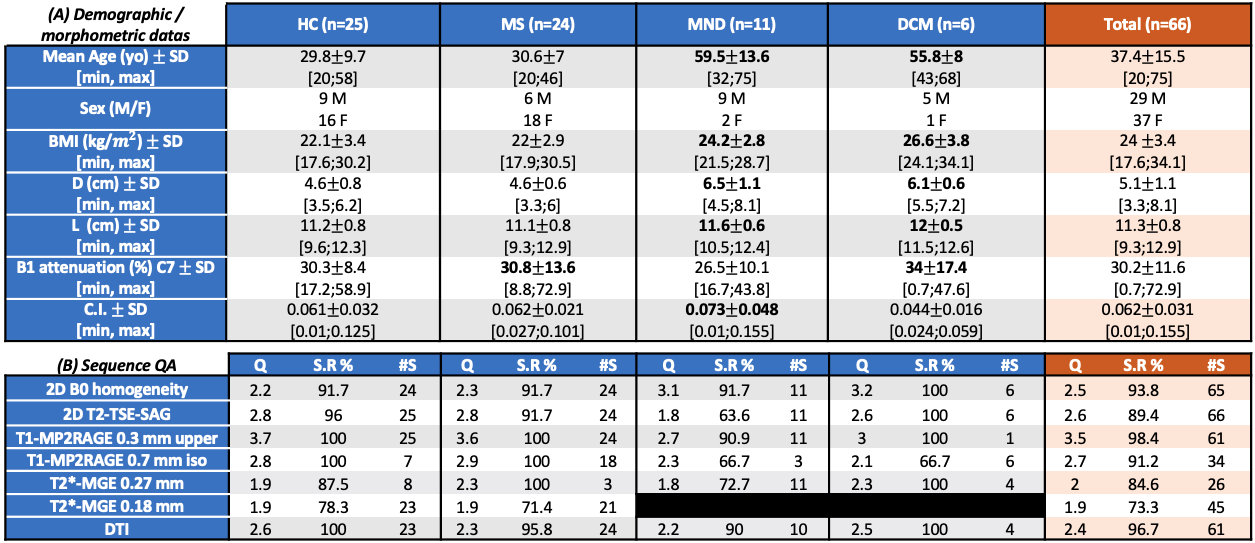
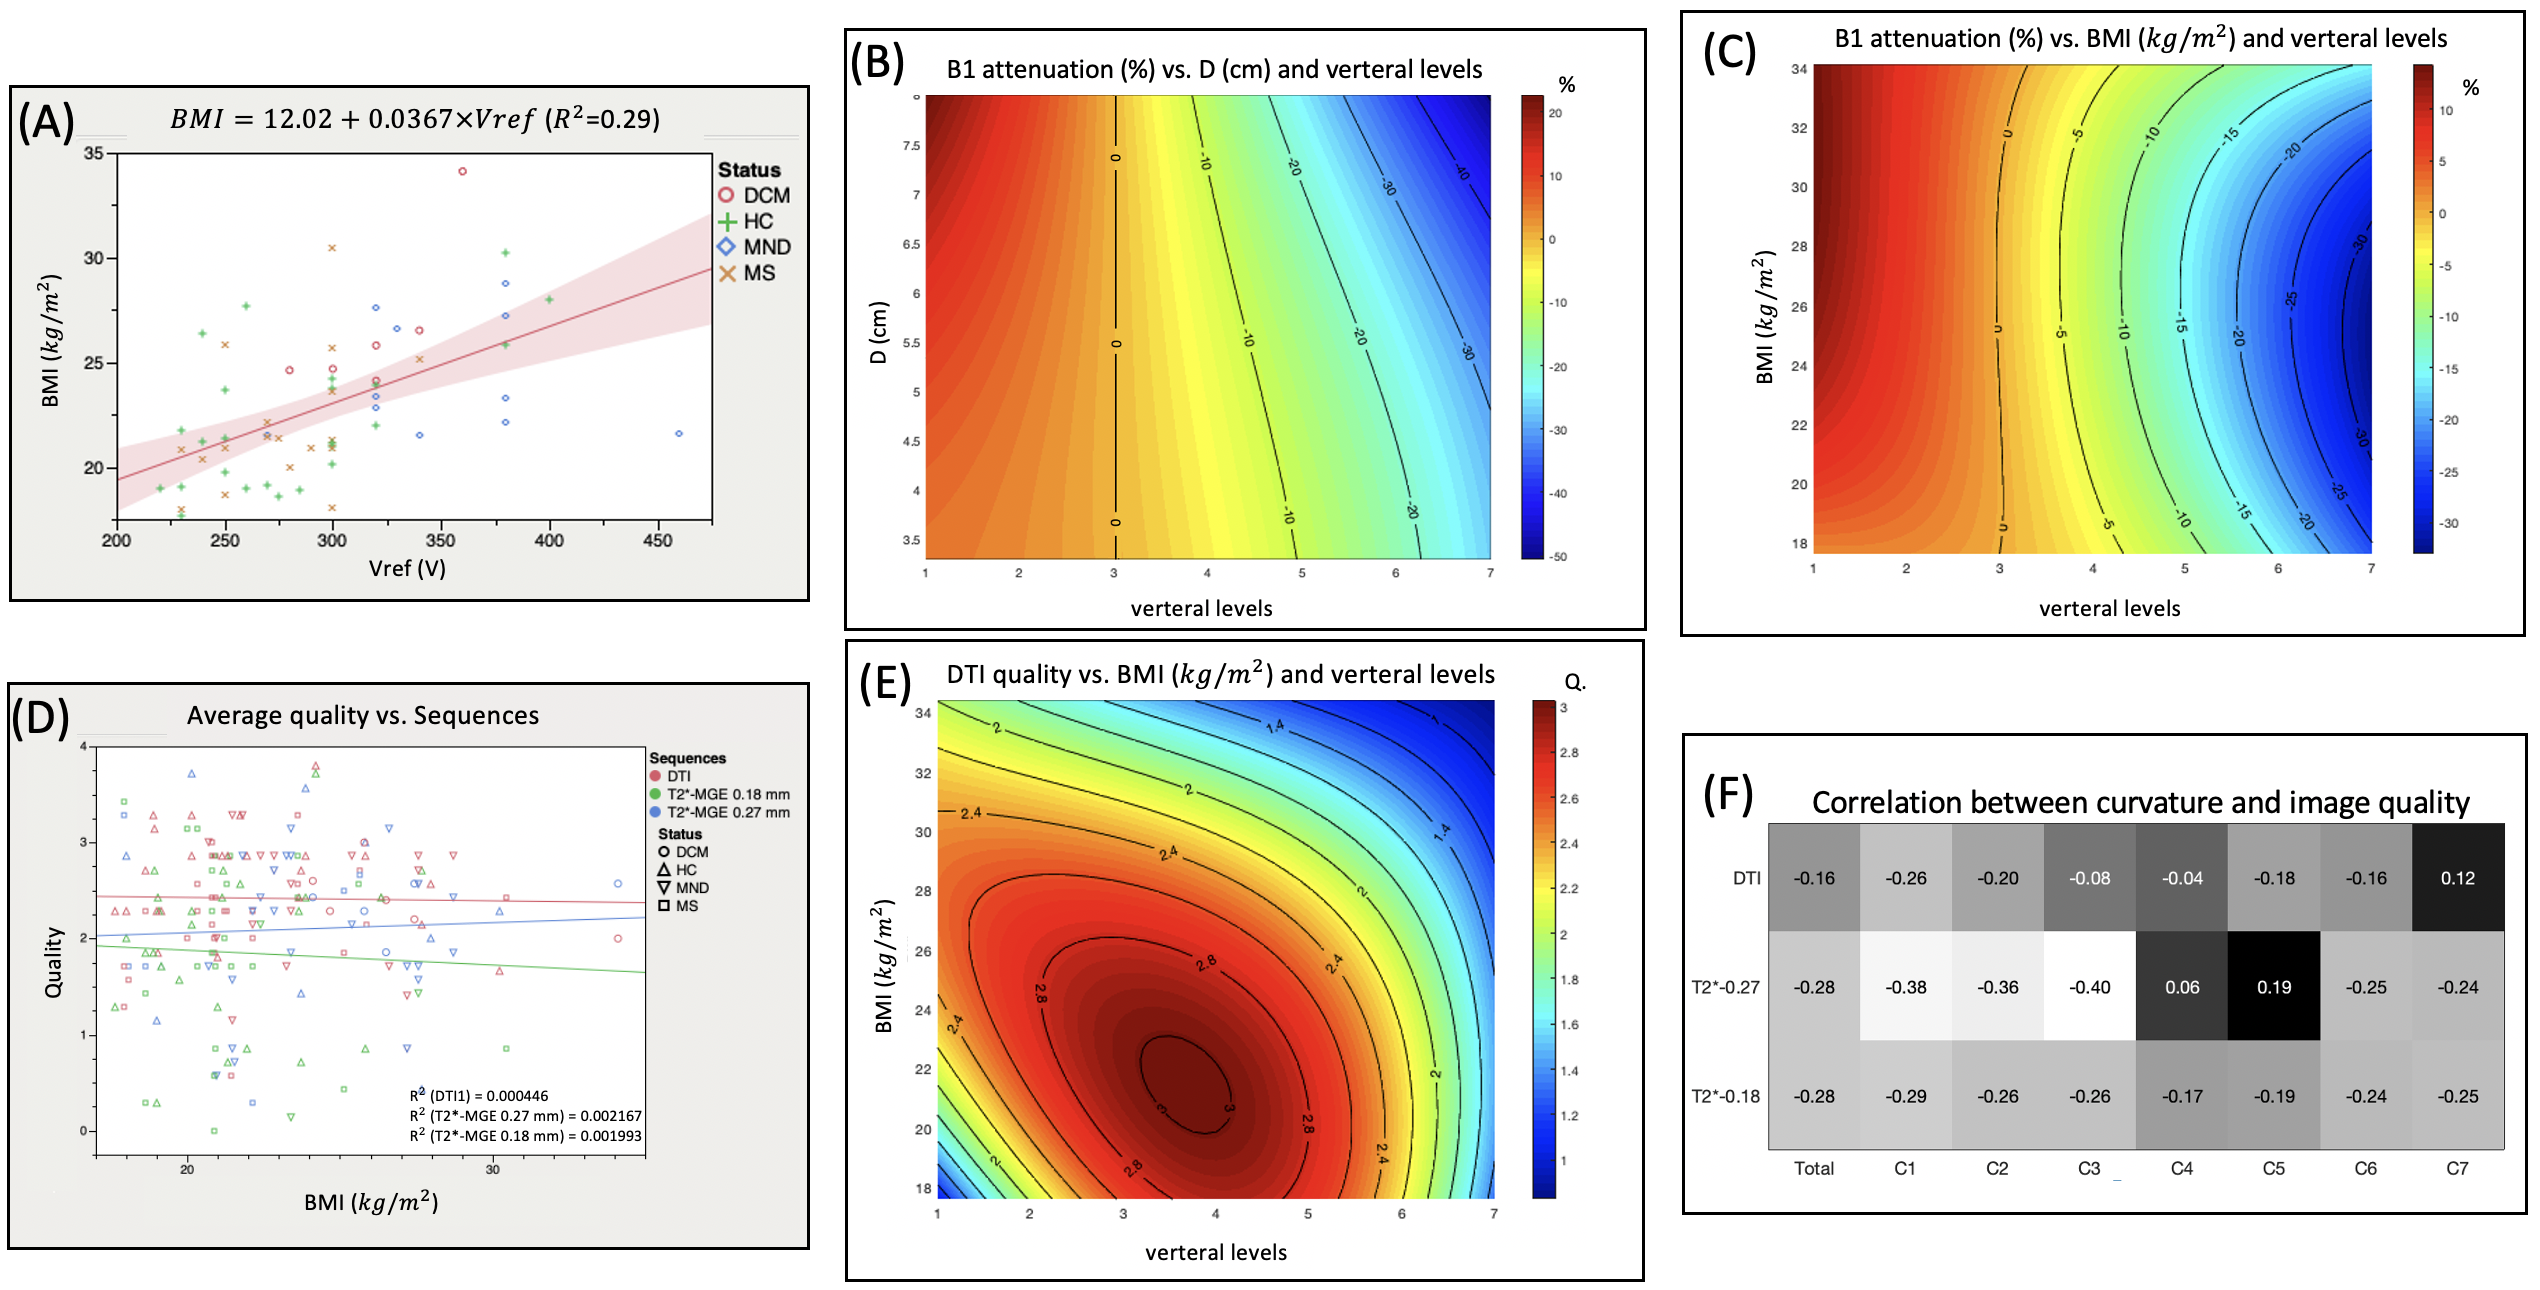
Figure 3A. synthetizes the morpho/demographic results obtained in this study. On average, older subjects (here MND and DCM patients) presented with higher BMI and D. Higher BMI and D were correlated to higher required voltage (Vref) to reach adequate flip angles, which in turns, with respect to the SAR (specific absorption rate), limited the total number of slices acquired with T2*-MGE (between 14 and 22 on average) and 2D-TSE (between 3 and 5), especially. But these 2 parameters were obviously not the only driving factors for Vref (see for instance BMI=f(Vref), R2=0.29, fig. 4A). It is also worth noting that BMI and D did not influence the B0 shimming quality (data not shown).Figure 4B. shows the interpolated B1+ attenuation along the vertebral levels as a function of D value (all subjects merged). On average, B1+ attenuation at the C7 level was in the order of 30% (34% for DCM, and up to 59 and 73% for individual HC and MS) (see Fig.3A). For this surface coil design, if large BMI and large neck suffered from large B1+ attenuation, they were nonetheless not systematically associated to impaired image quality (Fig.4D).
Altogether, best image quality and success rate (Fig.3B) were obtained for MS and HC (DCM results were encouraging, but the cohort size was too small to draw robust conclusion). Worse results were for MND patients (high distance to the coil, curvature index, and mostly, breathing motion artefacts).
The most robust MR sequence was the high-resolution T1-MP2RAGE sequence with a mean quality of 3.5±0.4 and a success rate of 98±4 % (global population). DTI also demonstrated high performance (94% on average (Fig.3B), which holds for different BMI and levels (Fig.4E). T2*-MGE shows better robustness for central levels between C3 and C5 (average S.R % = 79%) than upper levels C1-C2 (average S.R % = 62%) and lower levels C6-C7 (average S.R % = 43%).
On average, the intermediate levels (C3-C5; optimal B1+, straight and central zone for B0 shimming, alignment of the cord) were associated with the highest scores for axial imaging ( data per level not shown). Higher cervical curvature (C.I) was also more negatively correlated with good quality in upper and lower levels (C1-C2 and C6-C7) for the axial modalities (Fig.4F). Nonetheless, no correlations were found between curvature index and B0 inhomogeneities suggesting that other influencing factors should be determined.
It is worth mentioning that success rate was evaluated on native data prior to any denoising or image combination and considering only image quality ≥ 2; this methodology was thus very conservative. It is important to note that discarded data with scoring = 1 in the success rate evaluation would nonetheless be usable for regional quantitative metrics assessment or for cross-sectional area measurements.
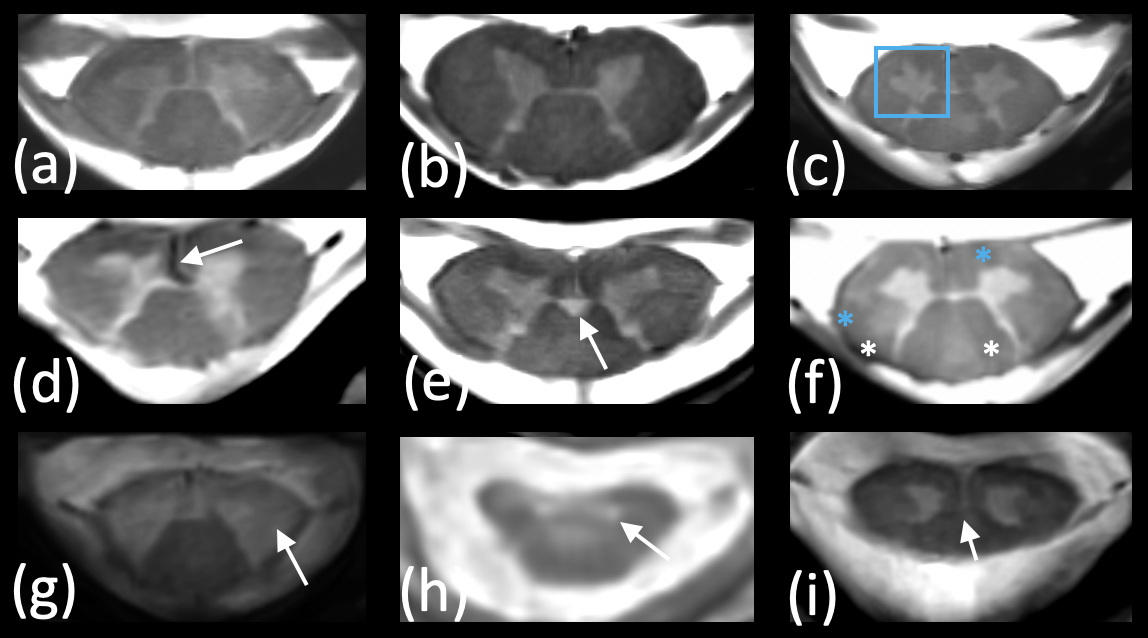
Figure 5 finally illustrates representative images obtained on the different cohorts, highlighting the benefits of ultra-high resolution and higher contrasts to delineate substructure and detect specific feature or abnormalities.
Discussion & Conclusion
With the current set-up (coil design, MR methodology), the high-resolution T1-MP2RAGE and the DTI sequences provided the best image quality, hence opening new perspectives for clinical or multicentric transfer.The best results were obtained for HC and MS patients. The entire protocol (45 minutes) and prone position were more difficult to withstand for the MND and DCM patients, hence requiring focusing on specific sequences to reduce total scan time.
Although concomitant factors are still under investigation, the most penalizing factors were related to coil-SC distance and SC curvature. Parallel transmission and innovative coil design should help mitigating these effects. With the possibility of performing high-quality and high-resolution quantitative imaging, spinal cord MRI has now entered in a very promising new era.
Acknowledgements
This work was supported by Latran and ARSEP foundations.References
[1] Kraff O, Quick HH. 7T: Physics, safety, and potential clinical applications. J Magn Reson Imaging. 2017;46(6):1573-1589. doi:10.1002/jmri.25723
[2] Van Der Kolk AG, Hendrikse J, Zwanenburg JJM, et al. Clinical applications of 7T MRI in the brain. European Journal of Radiology. 2013;82(5):708-718. doi:10.1016/j.ejrad.2011.07.007
[3] Barry RL, Vannesjo SJ, By S, et al. Spinal cord MRI at 7T. NeuroImage. 2018;168:437-451. doi:10.1016/j.neuroimage.2017.07.003
[4] Polimeni JR, Uludağ K. Neuroimaging with ultra-high field MRI: Present and future. Neuroimage. 2018;168:1-6. doi:10.1016/j.neuroimage.2018.01.072
[5] Sigmund EE, Suero GA, Hu C, et al. High-resolution human cervical spinal cord imaging at 7 T. NMR Biomed. 2012;25(7):891-899. doi:10.1002/nbm.1809
[6] Massire A, Rasoanandrianina H, Taso M, et al. Feasibility of single-shot multi-level multi-angle diffusion tensor imaging of the human cervical spinal cord at 7T. Magn Reson Med. 2018;80(3):947-957. doi:10.1002/mrm.27087
[7] Massire A, Rasoanandrianina H, Guye M, et al. Anterior fissure, central canal, posterior septum and more: New insights into the cervical spinal cord gray and white matter regional organization using T1 mapping at 7T. Neuroimage. 2020;205:116275. doi:10.1016/j.neuroimage.2019.116275
[8] Cohen-Adad J, Zhao W, Wald LL, et al. 7T MRI of spinal cord injury. Neurology. 2012;79(22):2217. doi:10.1212/WNL.0b013e31827597ae
[9] Dula AN, Pawate S, Dortch RD, et al. Magnetic resonance imaging of the cervical spinal cord in multiple sclerosis at 7T. Mult Scler. 2016;22(3):320-328. doi:10.1177/1352458515591070
[10] Ouellette R, Treaba CA, Granberg T, et al. 7 T imaging reveals a gradient in spinal cord lesion distribution in multiple sclerosis. Brain. 2020;143(10):2973-2987. doi:10.1093/brain/awaa249
[11] Bruschi N, Boffa G, Inglese M. Ultra-high-field 7-T MRI in multiple sclerosis and other demyelinating diseases: from pathology to clinical practice. Eur Radiol Exp. 2020;4(1):59. doi:10.1186/s41747-020-00186-x
[12] Cohen-Adad J, Zhao W, Keil B, et al. 7-T MRI of the spinal cord can detect lateral corticospinal tract abnormality in amyotrophic lateral sclerosis. Muscle Nerve. 2013;47(5):760-762. doi:10.1002/mus.23720
[13] Wright D, Martin S, Pereira EA, et al. High field structural MRI in the management of degenerative cervical myelopathy. Br J Neurosurg. 2018;32(6):595-598. doi:10.1080/02688697.2018.1467371
[14] Massire A, Taso M, Besson P, et al. High-resolution multi-parametric quantitative magnetic resonance imaging of the human cervical spinal cord at 7T. Neuroimage. 2016;143:58-69. doi:10.1016/j.neuroimage.2016.08.055
[15] Takeshita K, Murakami M, Kobayashi A, et al. Relationship between cervical curvature index (Ishihara) and cervical spine angle (C2–7). Journal of Orthopaedic Science. 2001;6(3):223-226. doi:10.1007/s007760100038
Figures