0650
Exploring diffusion modeling for the human cervical spinal cord: an evaluation of 480 multicompartment models1Vanderbilt University Medical Center, Nashville, TN, United States, 2Vanderbilt University, Nashville, TN, United States, 3NVIDIA, Bethesda, MD, United States, 4TheraPanacea, Paris, France
Synopsis
A large number of models have been developed to describe the diffusion MRI signal as a sum of different neural compartments. However, development and optimization of these multicompartment models has largely focused on the brain. In this work, we apply and compare a combinatorially large number of biophysical models (N=480) in the in vivo human spinal cord, evaluating their ability to fit the signal and also predict unseen signal. We find that certain combinations of constraints and compartments better model the signal in the cervical spinal cord, and we give recommendations for future modeling of this structure with clinical acquisitions.
Introduction
Diffusion MRI multicompartment models attempt to relate the diffusion signal directly to features of tissue microstructure. This is done by modeling the tissue as the sum of contributions from different geometrical structures that restrict or hinder the diffusion process in a well-defined manner. For example, nervous tissue may be represented as a ball (isotropic diffusivity) and sticks (cylinders with zero radius) [1], as cylinders with a specified diameter or distribution of diameters [2-5], or as some combination of hindered extracellular diffusion (either isotropic or anisotropic) and restricted diffusion within cells and axons [4]. Axons may also be modelled as fanning, bending, or dispersing in directions described by various mathematical distributions [6]. Finally, constraints may be implemented in the process, for example fitting diffusivities, or forcing different compartments to exhibit different diffusing properties [7, 8].This has led to numerous models of tissue microstructure and slow convergence to a “standard model” of diffusion [9]. To date, most efforts have been focused on nervous tissue in the brain, in particular on white matter. Here, we investigate multicompartment diffusion modeling of the spinal cord, and aim to uncover the appropriate combination of compartments and constraints needed to accurate model diffusion in this tissue. Following studies in the mouse brain [10], and subsequently human data [11-13], we create a large taxonomy of models using a combination of compartments and constraints, fit these models to a dataset with an extensive acquisition, and rank models based on their fit to the diffusion signal and ability to predict unseen signal.
Methods
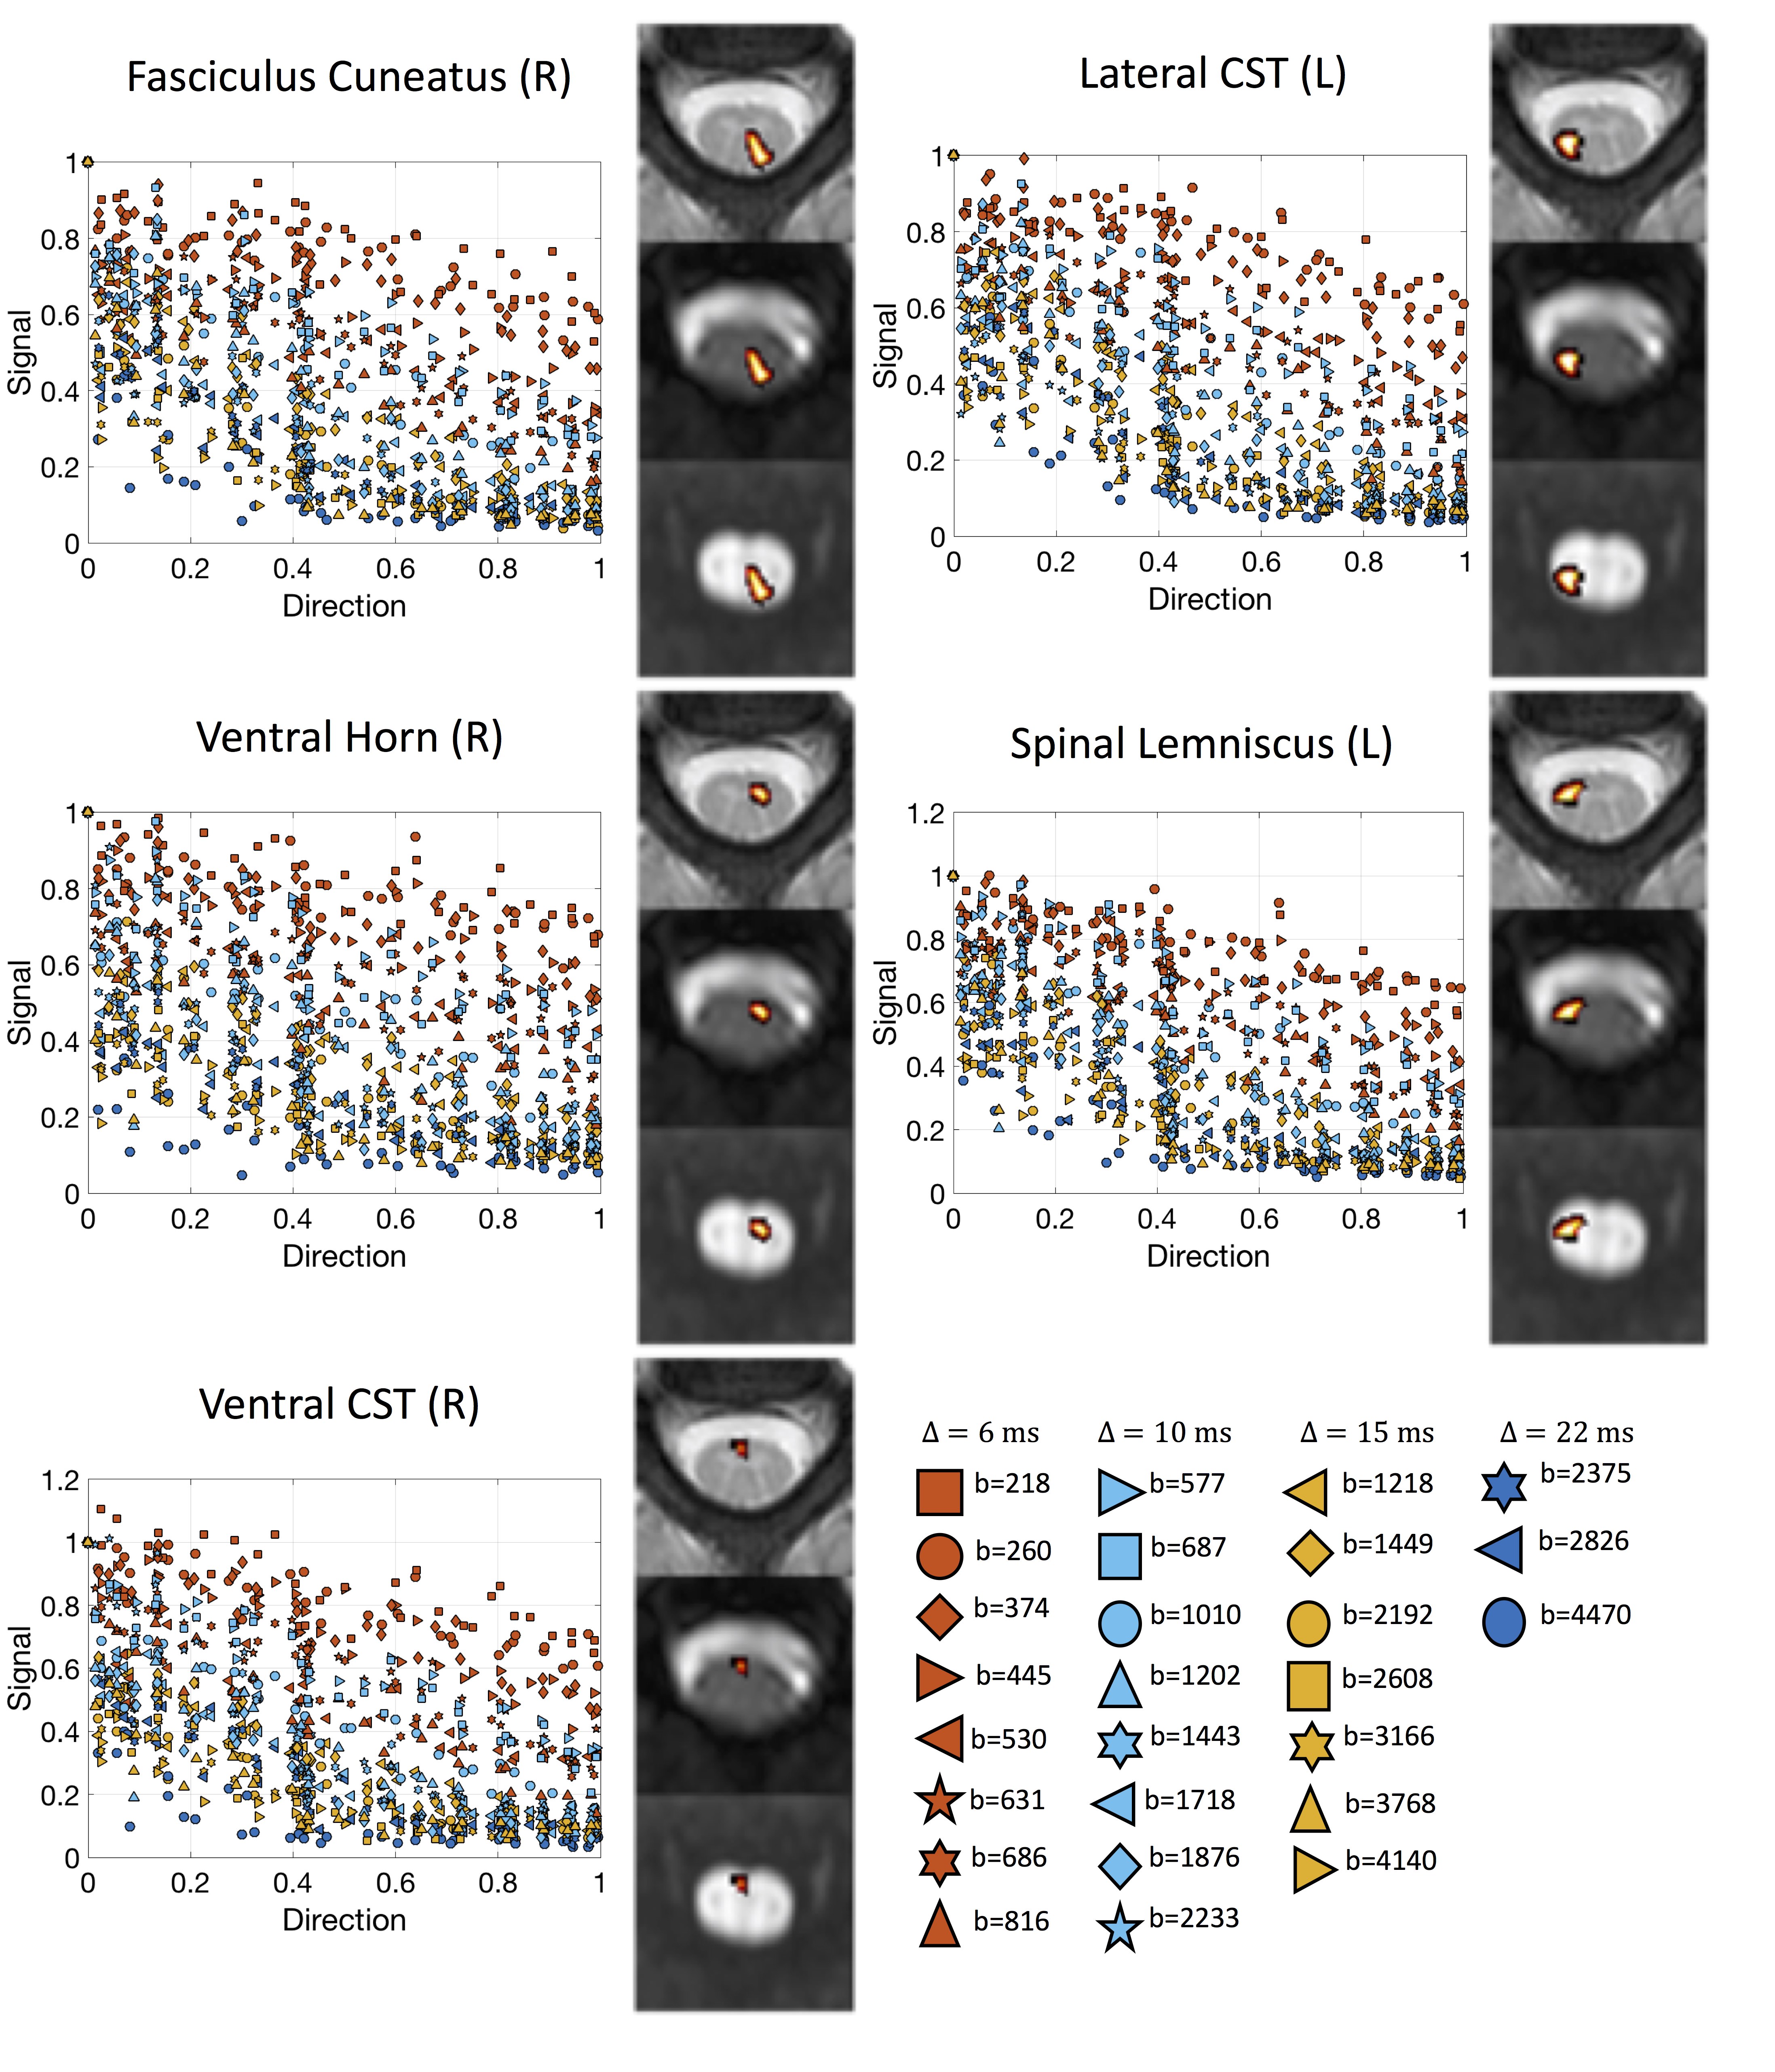
Data & ProcessingTwo healthy volunteers were scanned on a 3T Philips dStream Achieva. The goal of each acquisition was to cover as much of the measurements space (b-values and diffusion times) as possible, while retaining a usable signal to noise level. The full protocol for each subject consisted of 26 shells of 35 directions and 1 non-diffusion weighted image each, resulting in 936 image volumes per subject completed over 3 scan sessions. Figure 1 displays the diffusion times and b-values, and shows exemplar signal in selected regions. Diffusion data were collected at 1.25x1.25mm2resolution, slice thickness=10mm, NEX=3. Data were concatenated, motion corrected, and registered to template space [14] where 14 regions-of-interest were propagated to diffusion space for region-based analysis.
Modelling
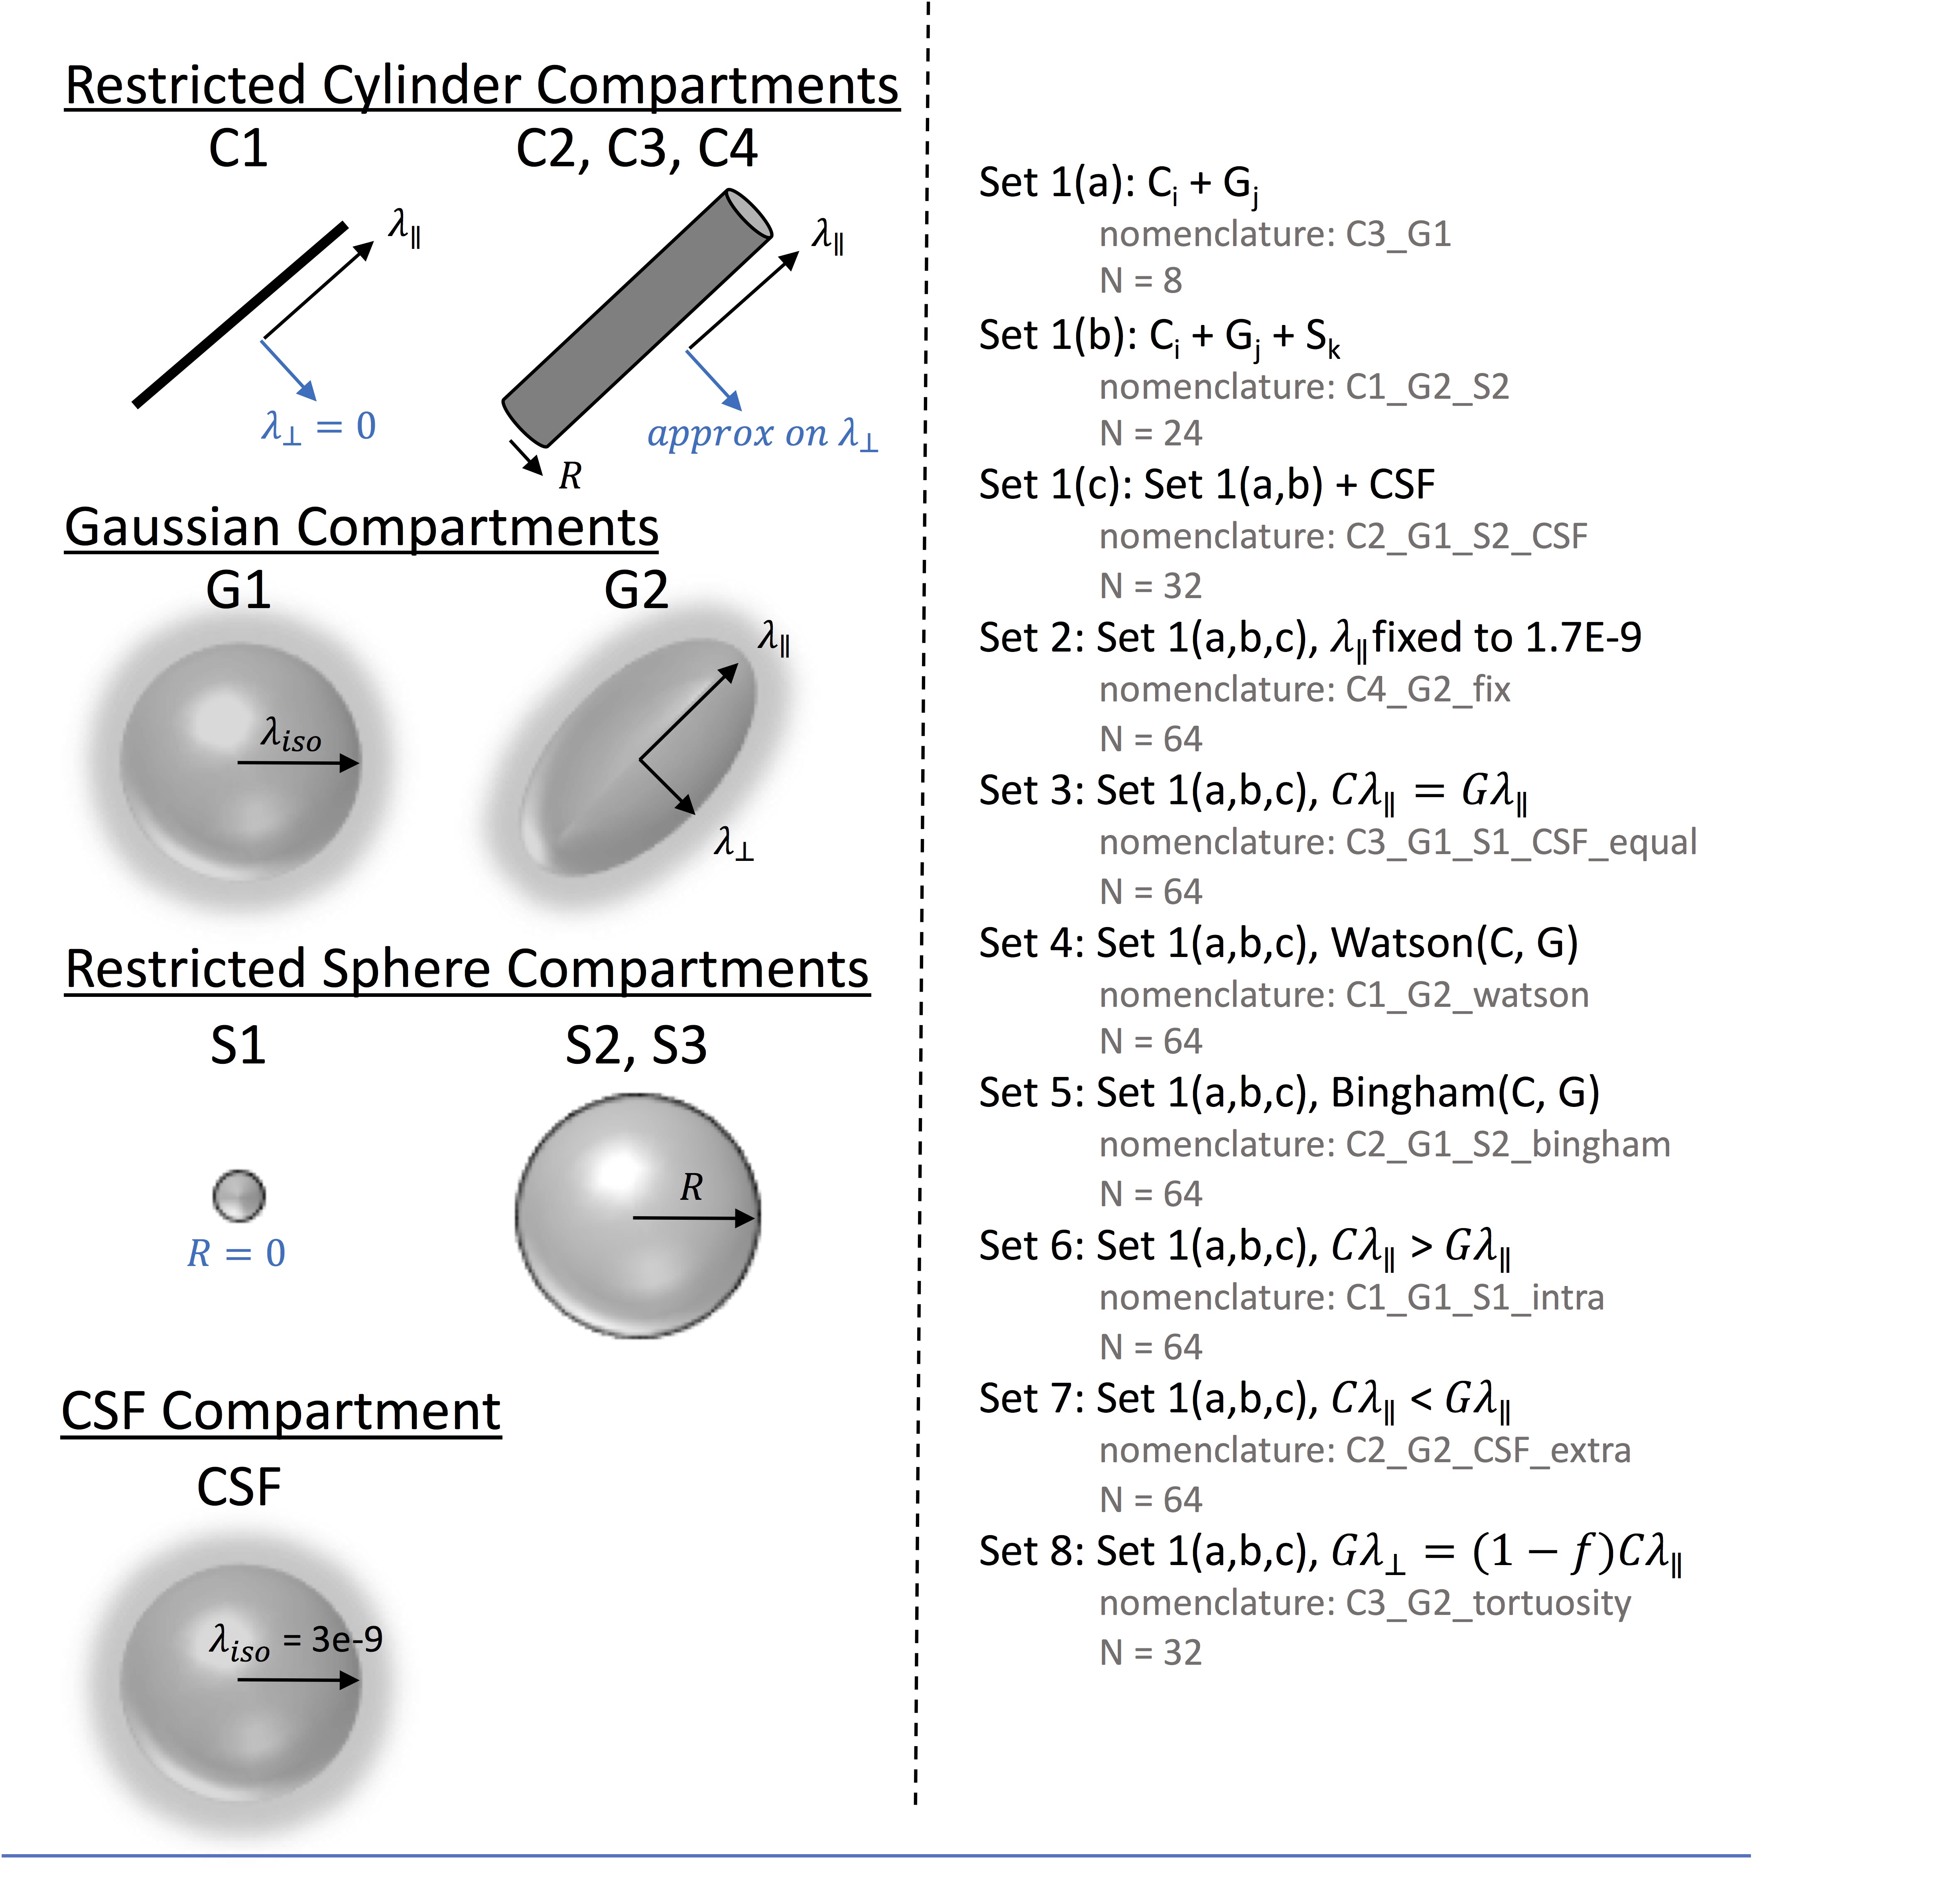
All modelling was performed in DMIPY toolbox. Compartments (Figure 2) included restricted cylinder compartments (C1: sticks, C2-C4: cylinders with different approximations), Gaussian compartments (G1: isotropic ball, G2: anisotropic Zeppelin), restricted sphere compartments (S1: zero radius, S2: different approximations for spheres), and a CSF component (at a fixed 3E-10mm2/s diffusivity). Models could be two compartment (C+G) or three-compartment (C+G+S), and can additionally include CSF (C+G+CSF). We derived 8 “sets” of constraints inspired by constraints used in the brain literature. This included no constraints (set 1), fixing parallel diffusivity to 1.7E-9 mm2/s (set 2), setting intra and extra-cellular diffusivities equal (set 3), allowing a Watson distribution of cylinders (set 4), or Bingham distribution (set 5), setting intra-cellular parallel diffusivity > extra-cellular (set 6), or vice-versa (set 7), and a tortuosity constraint between intra- and extra-cellular components (set 8). This resulted in 480 analyzed multicompartment models.
Ranking
Models were ranked on their ability to explain the signal and ability to predict unseen signal. The ability to explain the signal was determined using Bayesian information criteria as a model selection tool for each region-of-interest. Ability to predict signal was calculated by fitting each model (for every region) to 25 of the 26 shells and predicting the last shell, and repeating for all shells. Ranking was determined by mean-squared error.
Results
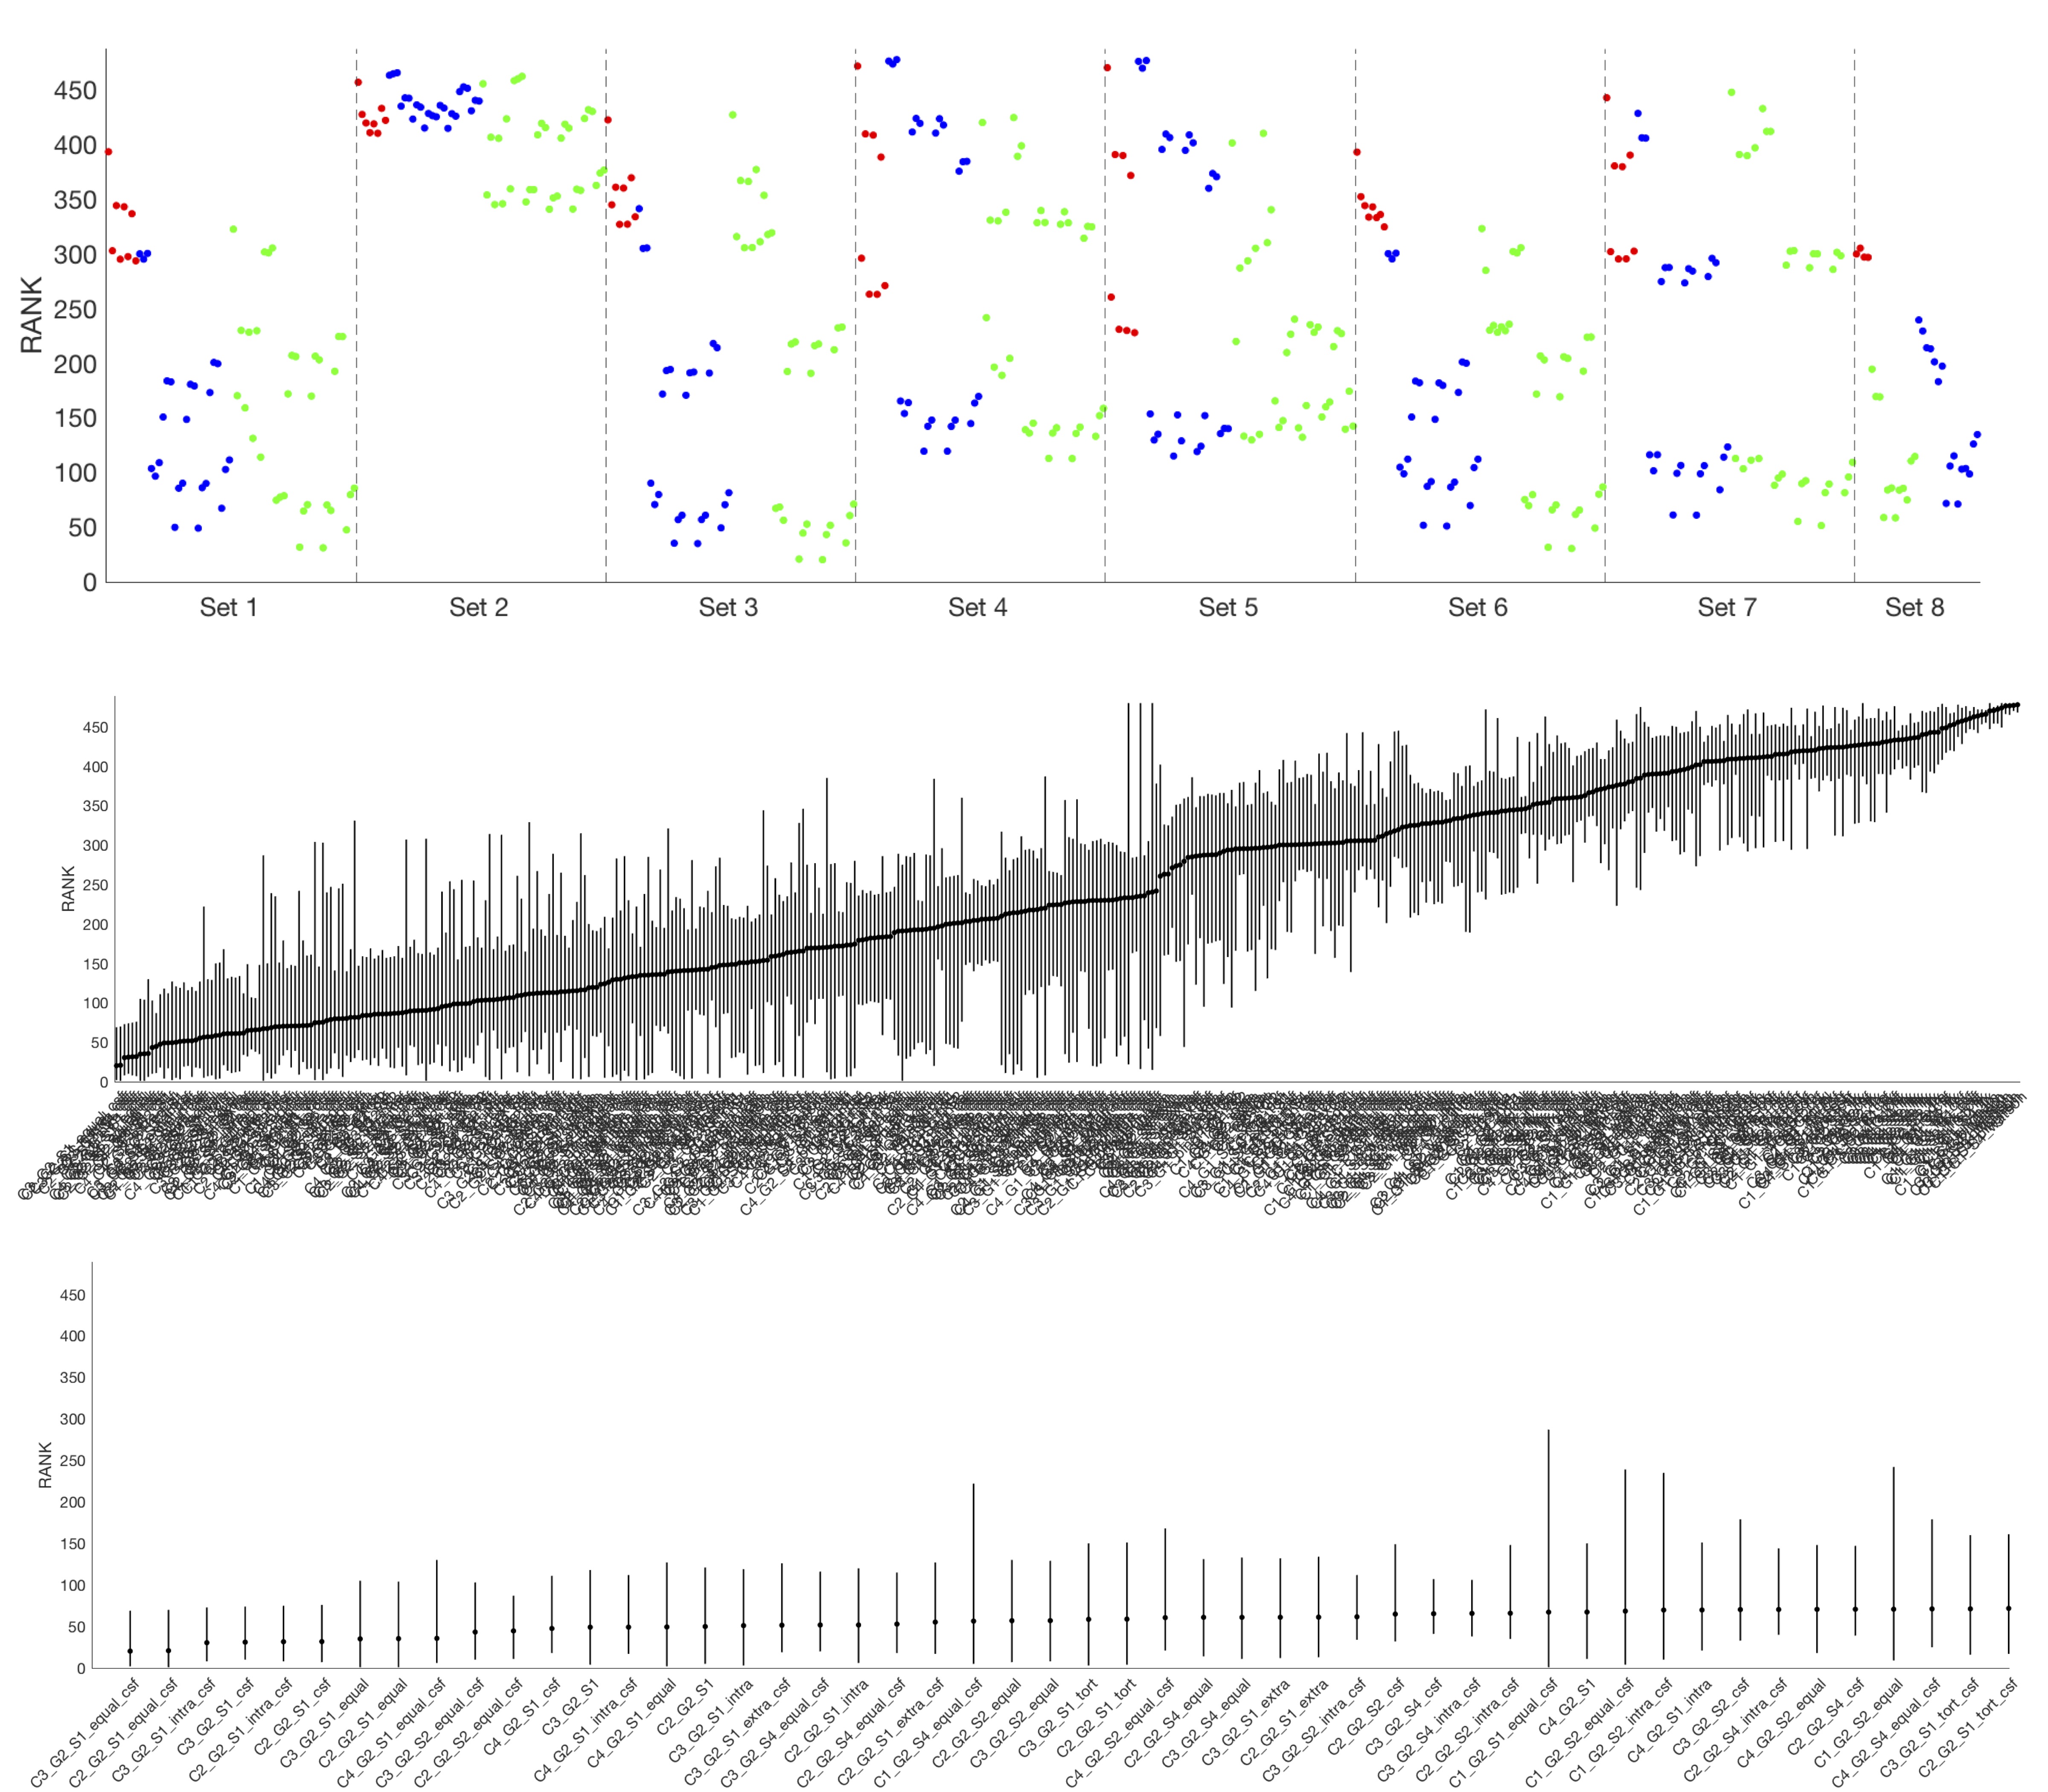
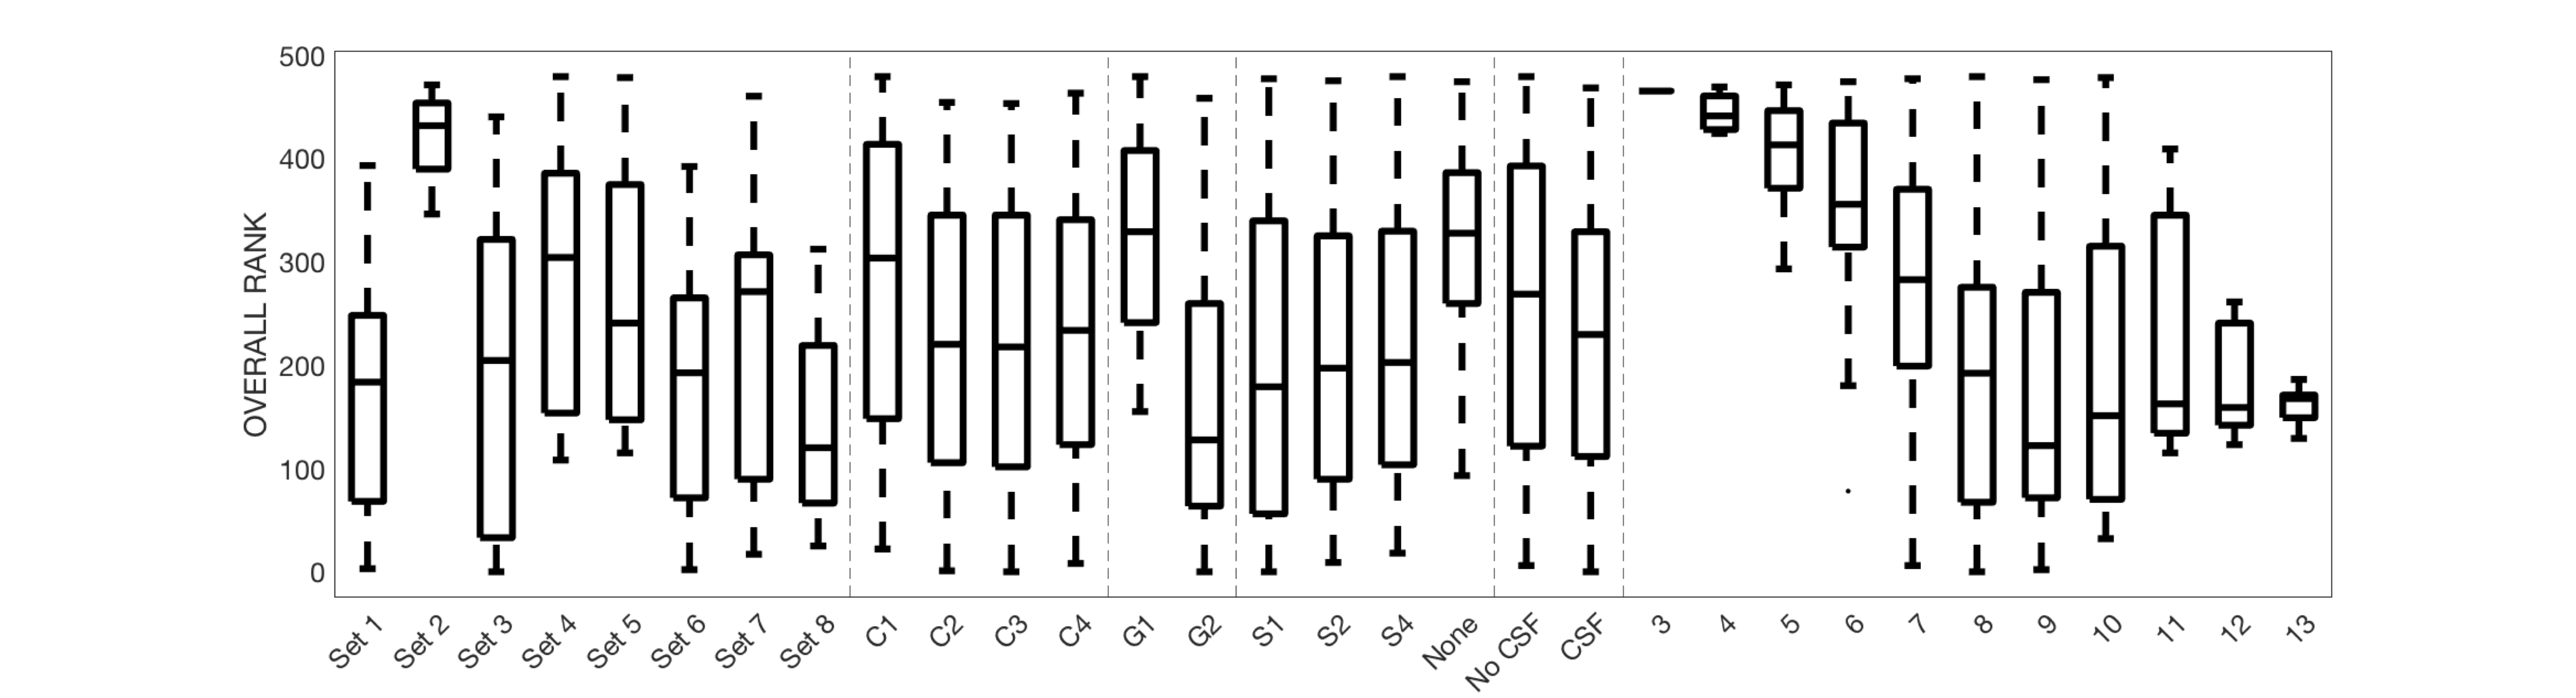
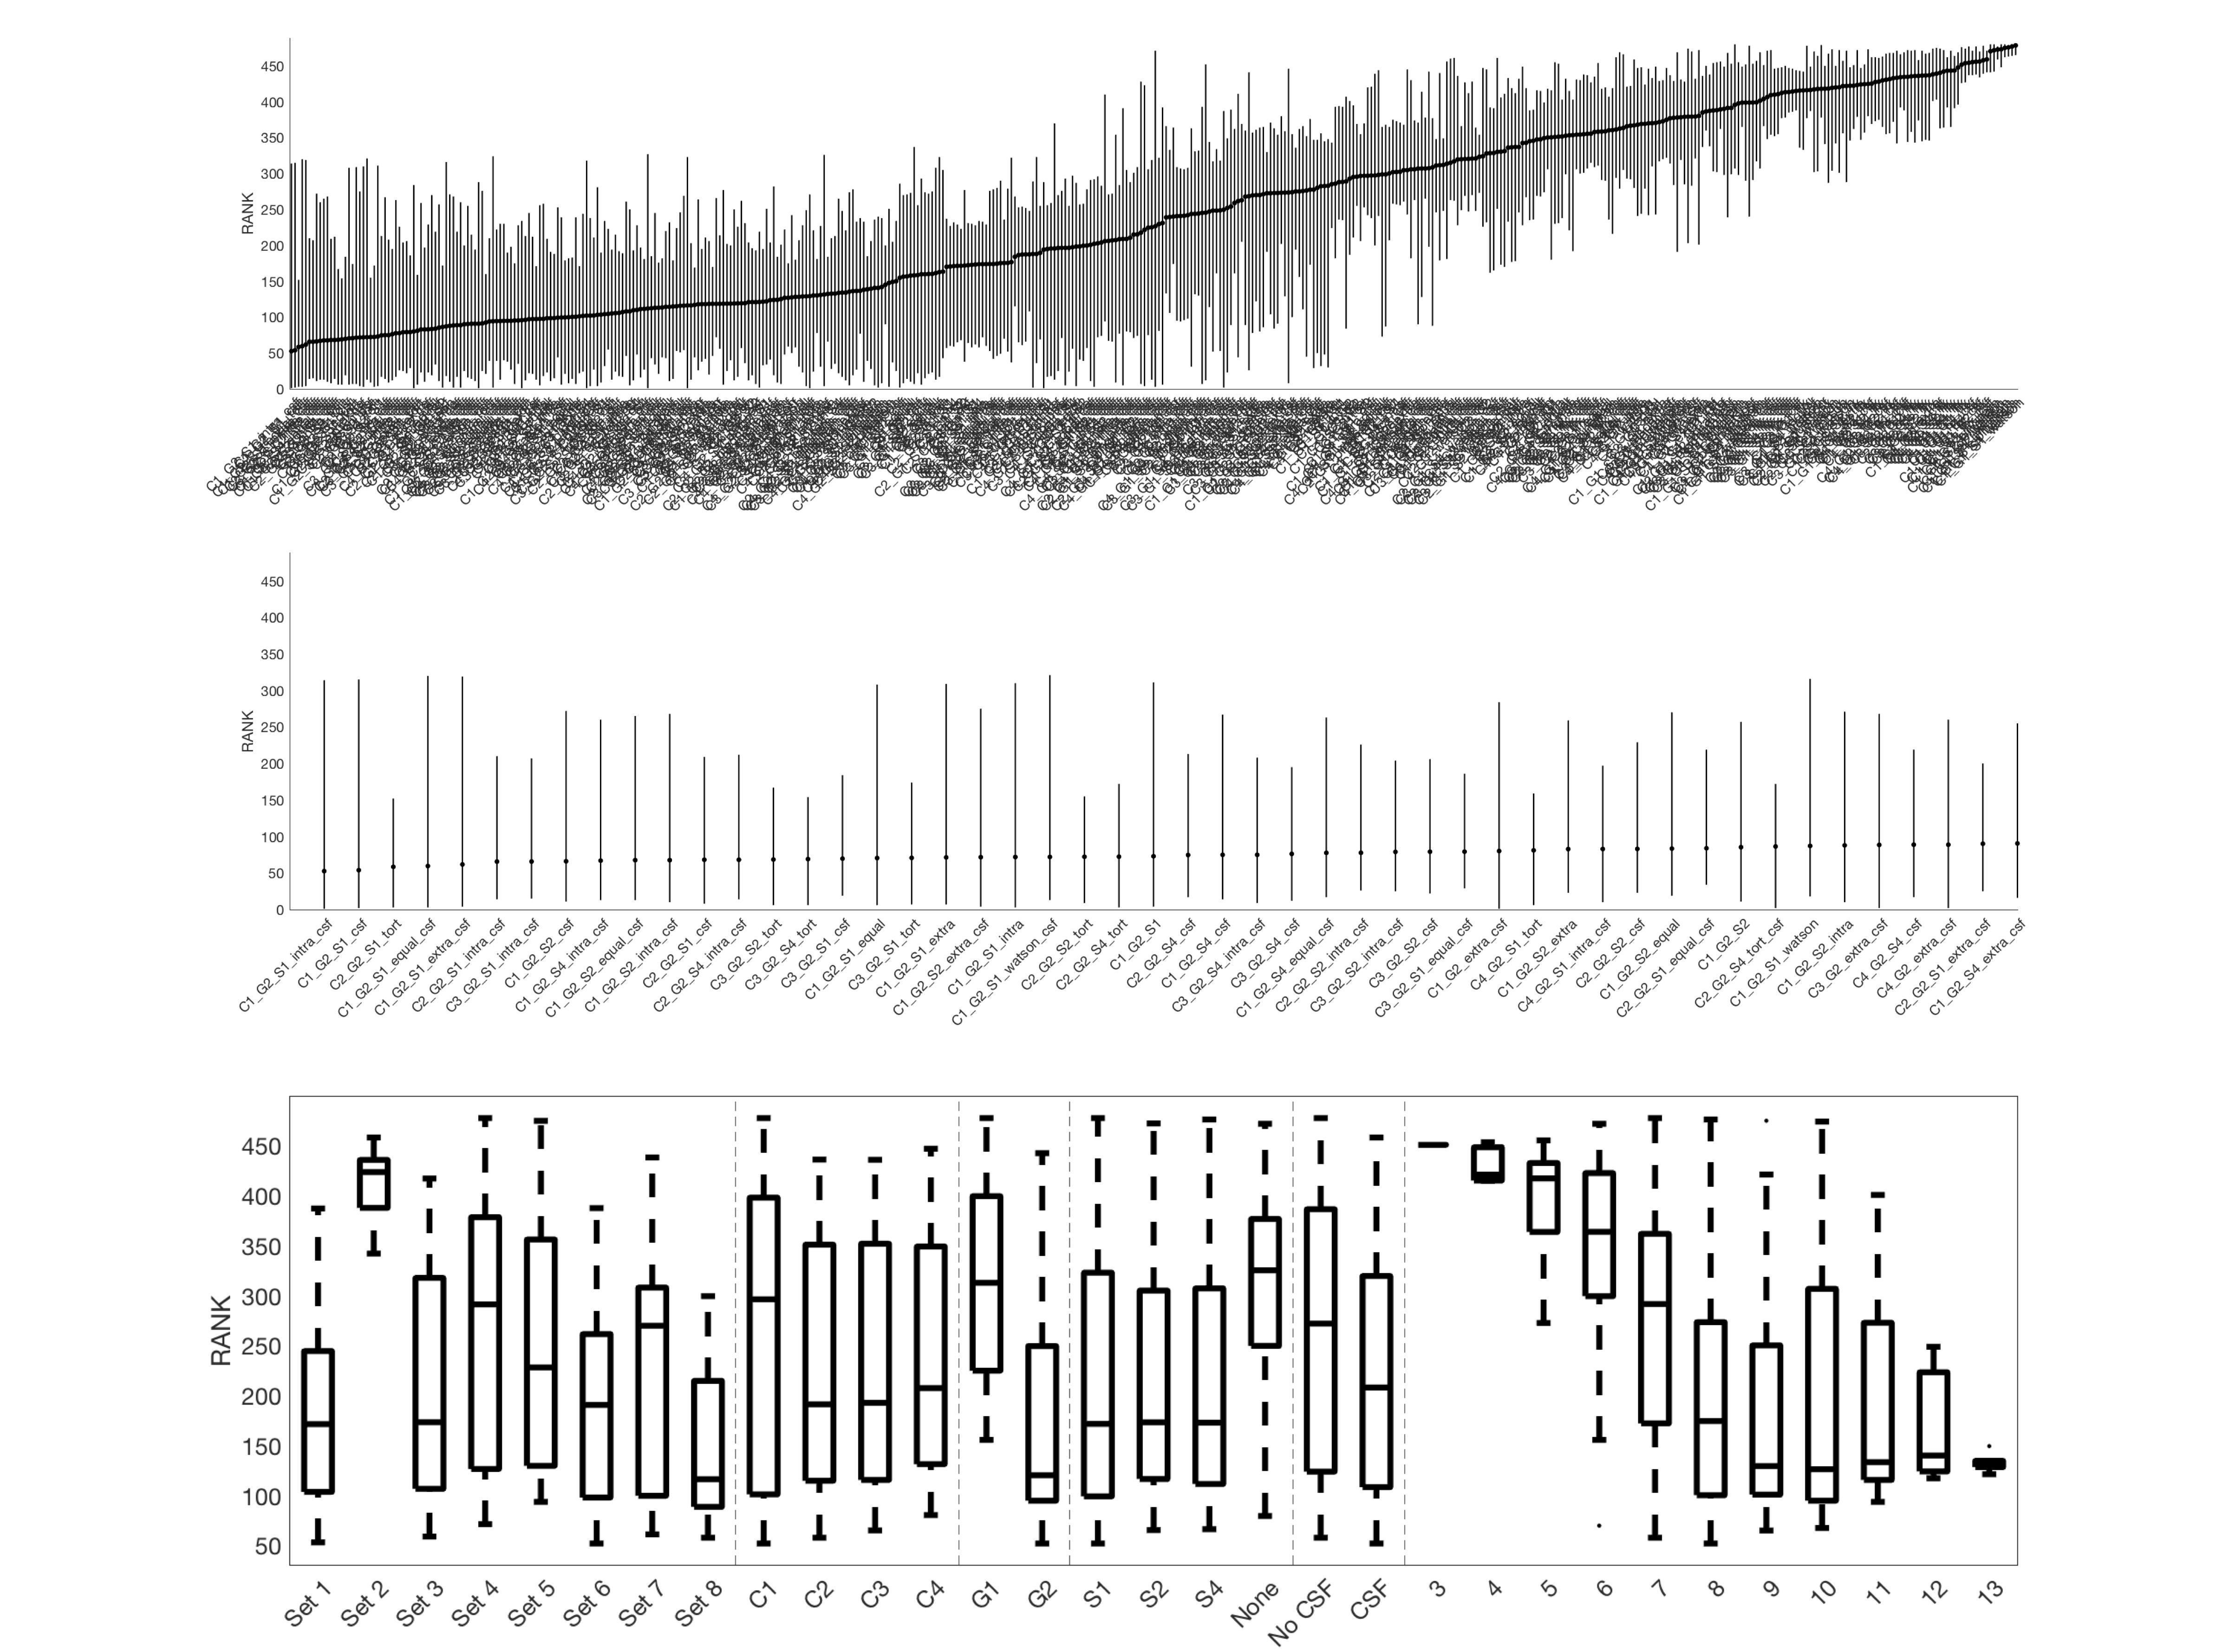
Figure 3 shows the average ranking (across 16 ROIs) for all models, displayed in plot form (top), ordered by ranking (middle) and zoomed in on the top 50 models (bottom). It is clear that certain combinations of compartments and constraints consistently rank higher than others. Qualitative observations of the top 50 models suggest inclusion of a non-zero radius cylinder and a CSF compartment.The model rankings grouped by constraints, by compartments, and by number of free parameters indicate clear trends (Figure 4). In general, model fitting is improved with (1) the tortuosity model, no constraints, and intra>extra, (2) cylinders over sticks, (3) anisotropic extracellular components, (4) including a restricted component, and (5) including a CSF compartment. Also, ranking improves with increasing degrees of freedom, up to a point where it is no longer contributing to fit.
Similar results were obtained for predicting unseen signal (Figure 5), with conclusions that parallel those from model fitting.
Discussion
Here, we have analyzed a taxonomy of multi-compartment models for fitting tissue microstructure in the spinal cord. Previous taxonomies of compartments have been limited to low numbers of models (for example 47 models), whereas we created a combinatorial large number of models, with various constraints derived from the literature.While fitting the signal, and predicting signal, are useful, the next steps are to investigate degeneracy and stability of fit, and validate against known anatomical variations in the cord. These findings should be used to investigate and converge upon a standard model of tissue microstructure in the spinal cord.
Acknowledgements
This work was supported by the National Institutes of Health under award numbers R21 NS087465-01, R01 EY023240, R01EB017230, K01 EB030039-01, and T32EB001628, by the National Multiple Sclerosis Society award number RG-1501-02840, and in part by the National Center for Research Resources grant UL1 RR024975-0.References
1. Behrens, T.E., et al., Characterization and propagation of uncertainty in diffusion-weighted MR imaging.Magn Reson Med, 2003. 50(5): p. 1077-88.
2. Barazany, D., P.J. Basser, and Y. Assaf, In vivo measurement of axon diameter distribution in the corpus callosum of rat brain.Brain, 2009. 132(Pt 5): p. 1210-20.
3. Assaf, Y., et al., AxCaliber: a method for measuring axon diameter distribution from diffusion MRI.Magn Reson Med, 2008. 59(6): p. 1347-54.
4. Assaf, Y. and P.J. Basser, Composite hindered and restricted model of diffusion (CHARMED) MR imaging of the human brain.Neuroimage, 2005. 27(1): p. 48-58.
5. Assaf, Y., et al., New modeling and experimental framework to characterize hindered and restricted water diffusion in brain white matter.Magn Reson Med, 2004. 52(5): p. 965-78.
6. Sotiropoulos, S.N., T.E. Behrens, and S. Jbabdi, Ball and rackets: Inferring fiber fanning from diffusion-weighted MRI.Neuroimage, 2012. 60(2): p. 1412-25.
7. Zhang, H., et al., NODDI: practical in vivo neurite orientation dispersion and density imaging of the human brain.Neuroimage, 2012. 61(4): p. 1000-16.
8. Jelescu, I.O., et al., Degeneracy in model parameter estimation for multi-compartmental diffusion in neuronal tissue.NMR Biomed, 2016. 29(1): p. 33-47.
9. Novikov, D.S., V.G. Kiselev, and S.N. Jespersen, On modeling.Magn Reson Med, 2018. 79(6): p. 3172-3193.
10. Panagiotaki, E., et al., Compartment models of the diffusion MR signal in brain white matter: a taxonomy and comparison.Neuroimage, 2012. 59(3): p. 2241-54.
11. Ferizi, U., et al., Diffusion MRI microstructure models with in vivo human brain Connectome data: results from a multi-group comparison.NMR Biomed, 2017. 30(9).
12. Ferizi, U., et al., White matter compartment models for in vivo diffusion MRI at 300mT/m.Neuroimage, 2015. 118: p. 468-83.
13. Ferizi, U., et al., The Importance of Being Dispersed: A Ranking of Diffusion MRI Models for Fibre Dispersion Using In Vivo Human Brain Data, in Medical Image Computing and Computer-Assisted Intervention – MICCAI 2013, K. Mori, et al., Editors. 2013, Springer Berlin Heidelberg. p. 74-81.
14. De Leener, B., et al., PAM50: Unbiased multimodal template of the brainstem and spinal cord aligned with the ICBM152 space.Neuroimage, 2018. 165: p. 170-179.
Figures