0649
Variations of quantitative MRI metrics along the cervical spinal cord: multi-vendor, multi-center, multi-subject study1Department of Neurology, Faculty of Medicine and Dentistry, Palacký University Olomouc, Olomouc, Czech Republic, 2NeuroPoly Lab, Institute of Biomedical Engineering, Polytechnique Montreal, Montreal, QC, Canada, 3Functional Neuroimaging Unit, CRIUGM, University of Montreal, Montreal, QC, Canada
Synopsis
Quantitative MRI (qMRI) of the spinal cord (SC), such as diffusion-weighted and magnetic transfer imaging can be used in diagnosis of many different diseases. In this study, we established normative qMRI metrics along C2-C5 cervical SC levels for different regions-of-interest (spinal cord, white and gray matter, white matter columns) for 3 major MRI vendors (Siemens, Philips, GE) in large open-access dataset of ~250 healthy subjects. Metrics showed dependency on vertebral levels and confirmed different microstructural organization along SC. Moreover, differences in qMRI metrics were observed between individual vendors suggesting the influence of different MRI scanner configurations.
Introduction
Quantitative magnetic resonance imaging (qMRI) techniques, such as diffusion-weighted imaging (DWI/dMRI) or magnetization transfer (MT) imaging demonstrated their ability to depict intrinsic tissue properties of the spinal cord (SC) in both healthy subjects and patients across wide spectrum of diseases.1 This in-vivo characterisation of SC microstructure could provide potential biomarkers of SC tissue damage in many pathological conditions. However, up to now, normative qMRI metrics across all major MR vendors which would serve as a gold standard for comparison with altered metrics in patients are missing. In this work, qMRI data from a large cohort of healthy volunteers (~250 subjects) acquired at multiple sites using different MRI scanners but with the same consensus spine-generica acquisition protocol were analysed using state-of-the-art pipeline to extract normative microstructural metrics of human cervical SC along cervical levels (C2-C5) and for different regions of interest (ROIs).Methods
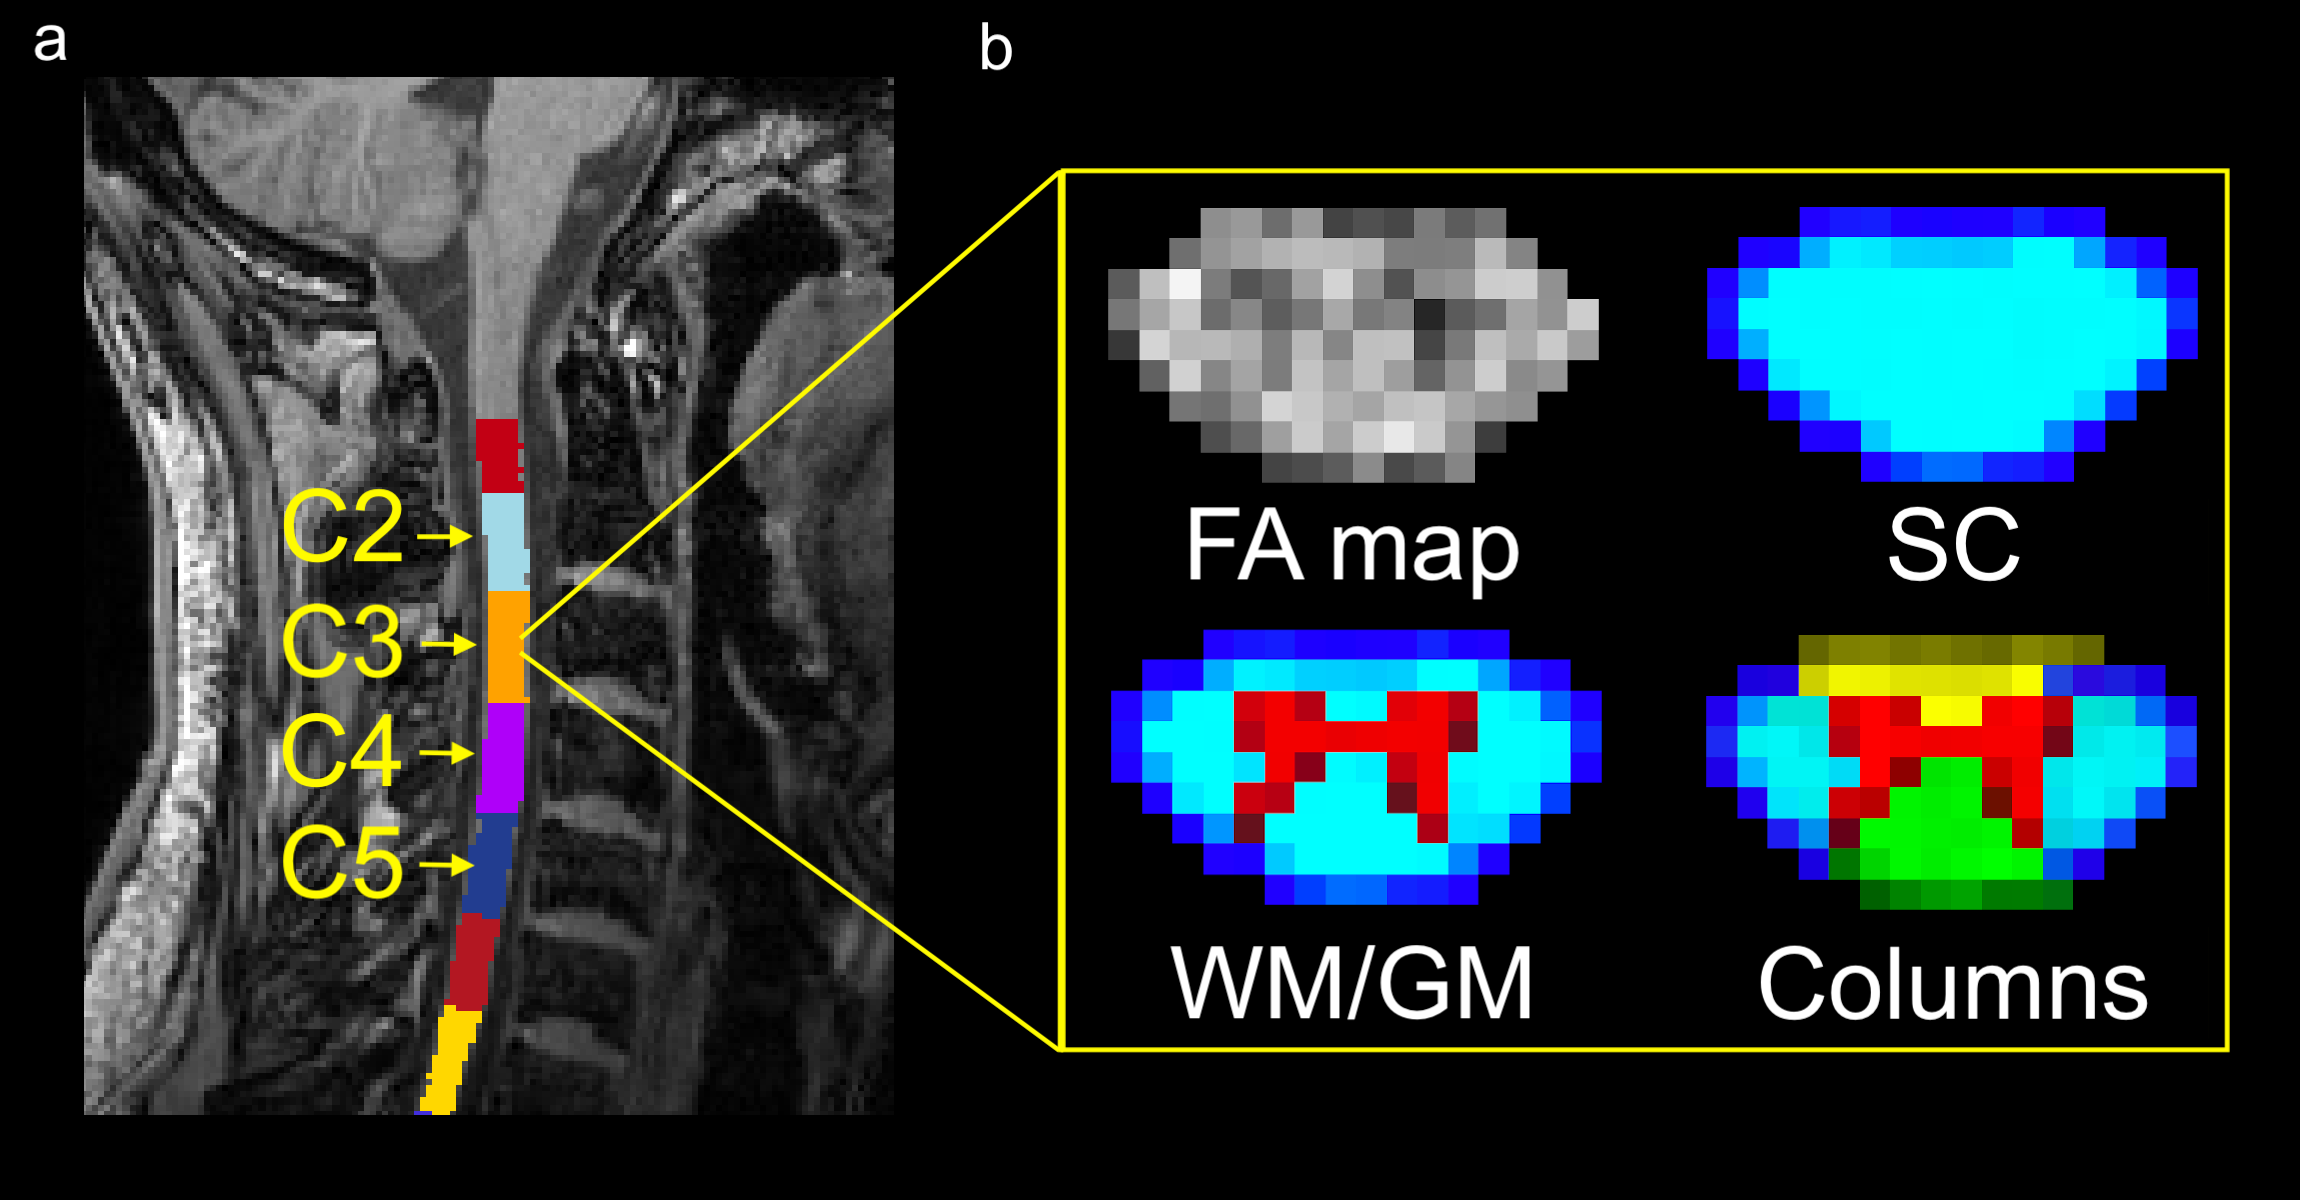
Open-access dataset2,3 of 260 healthy volunteers (139 males, 121 females) aged between 19 and 56 years collected across 42 sites acquired by MRI scanners from 3 major vendors (Siemens, Philips, GE) were used. Data were scanned using spine-generic acquisition protocolb and consisted of T1-w, T2-w, T2*-w, DWI, MTR; for more details see 4. Individual subjects' data were processed using spine-generic consensus analysis pipeline2 v2.5 utilizing Spinal Cord Toolbox (SCT)5 v5.0.1. Single-subject normative qMRI metrics were then extracted from DTI (FA, MD, AD, MD) and MT (MTR and MTsat) data for individual ROIs (spinal cord, white matter, gray matter, dorsal, ventral and lateral columns/funiculi) for each C2 to C5 vertebral level using normative-metrics pipelinec, Figure 1. To compensate for possible partial volume effect, maximum a posteriori6 approach was used for metric extraction. Mean, standard deviation (SD) and coefficient of variation (COV) were calculated for individual vendors for each ROI and each vertebral level.Results
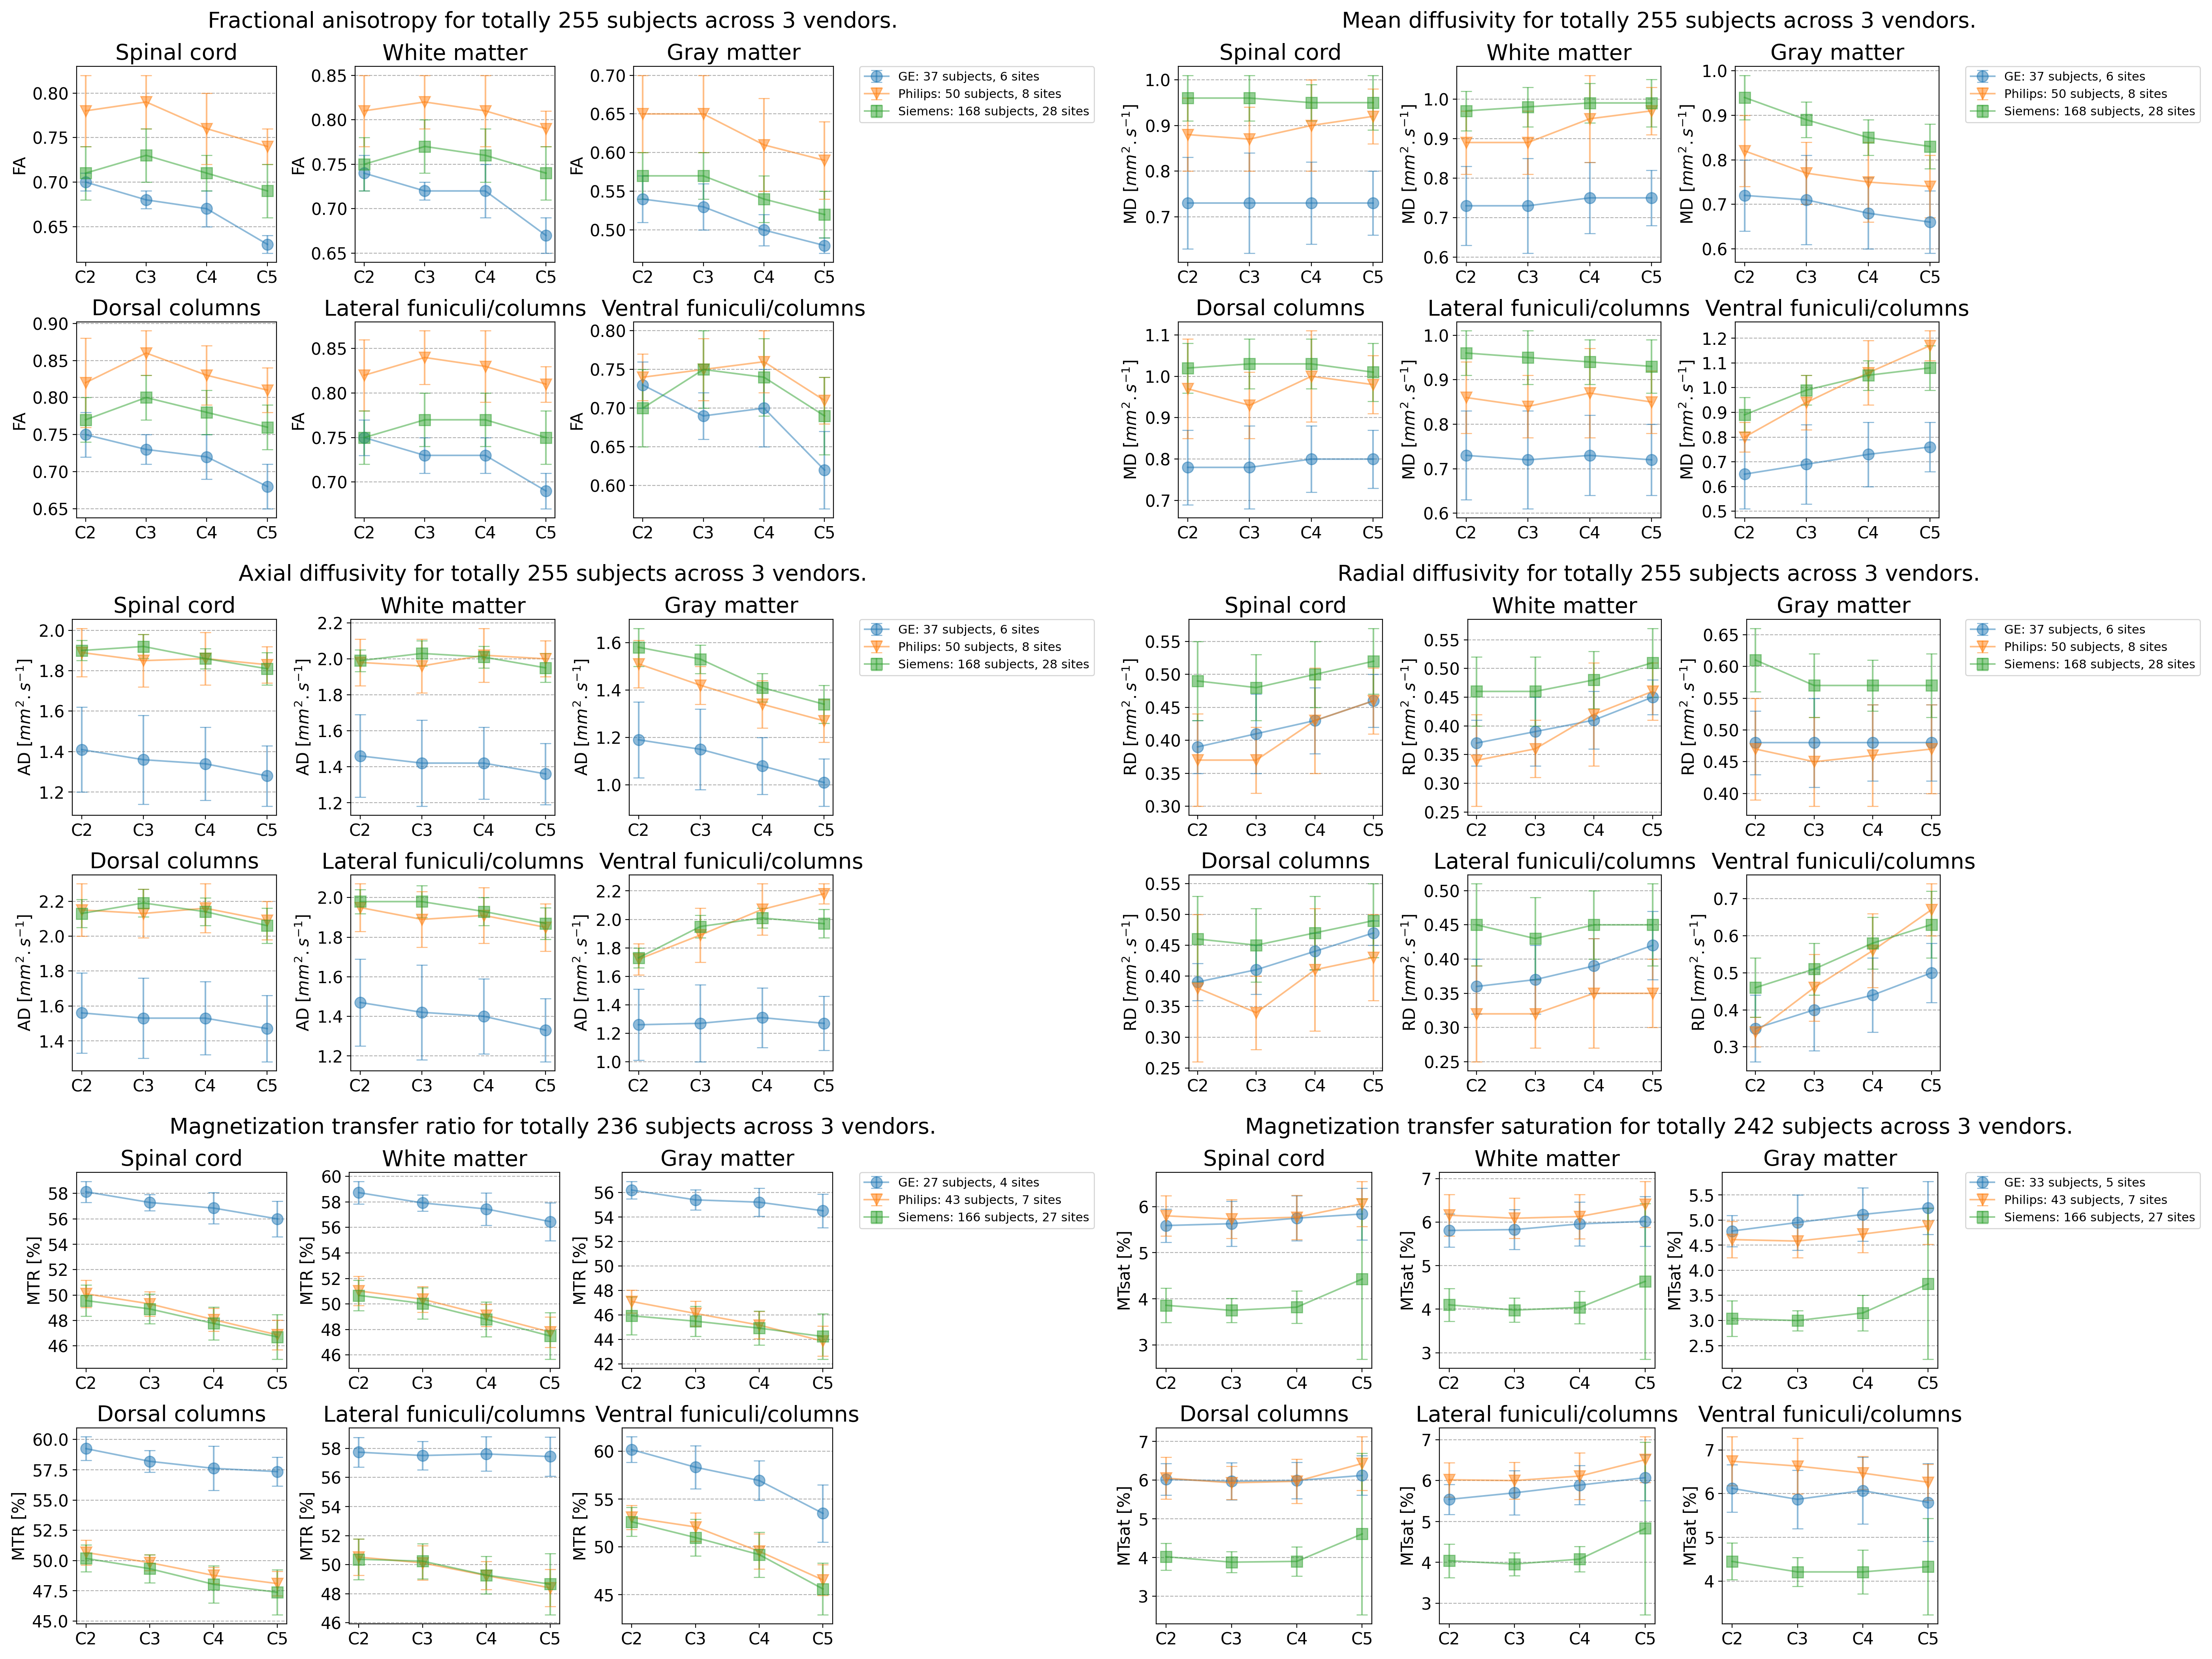
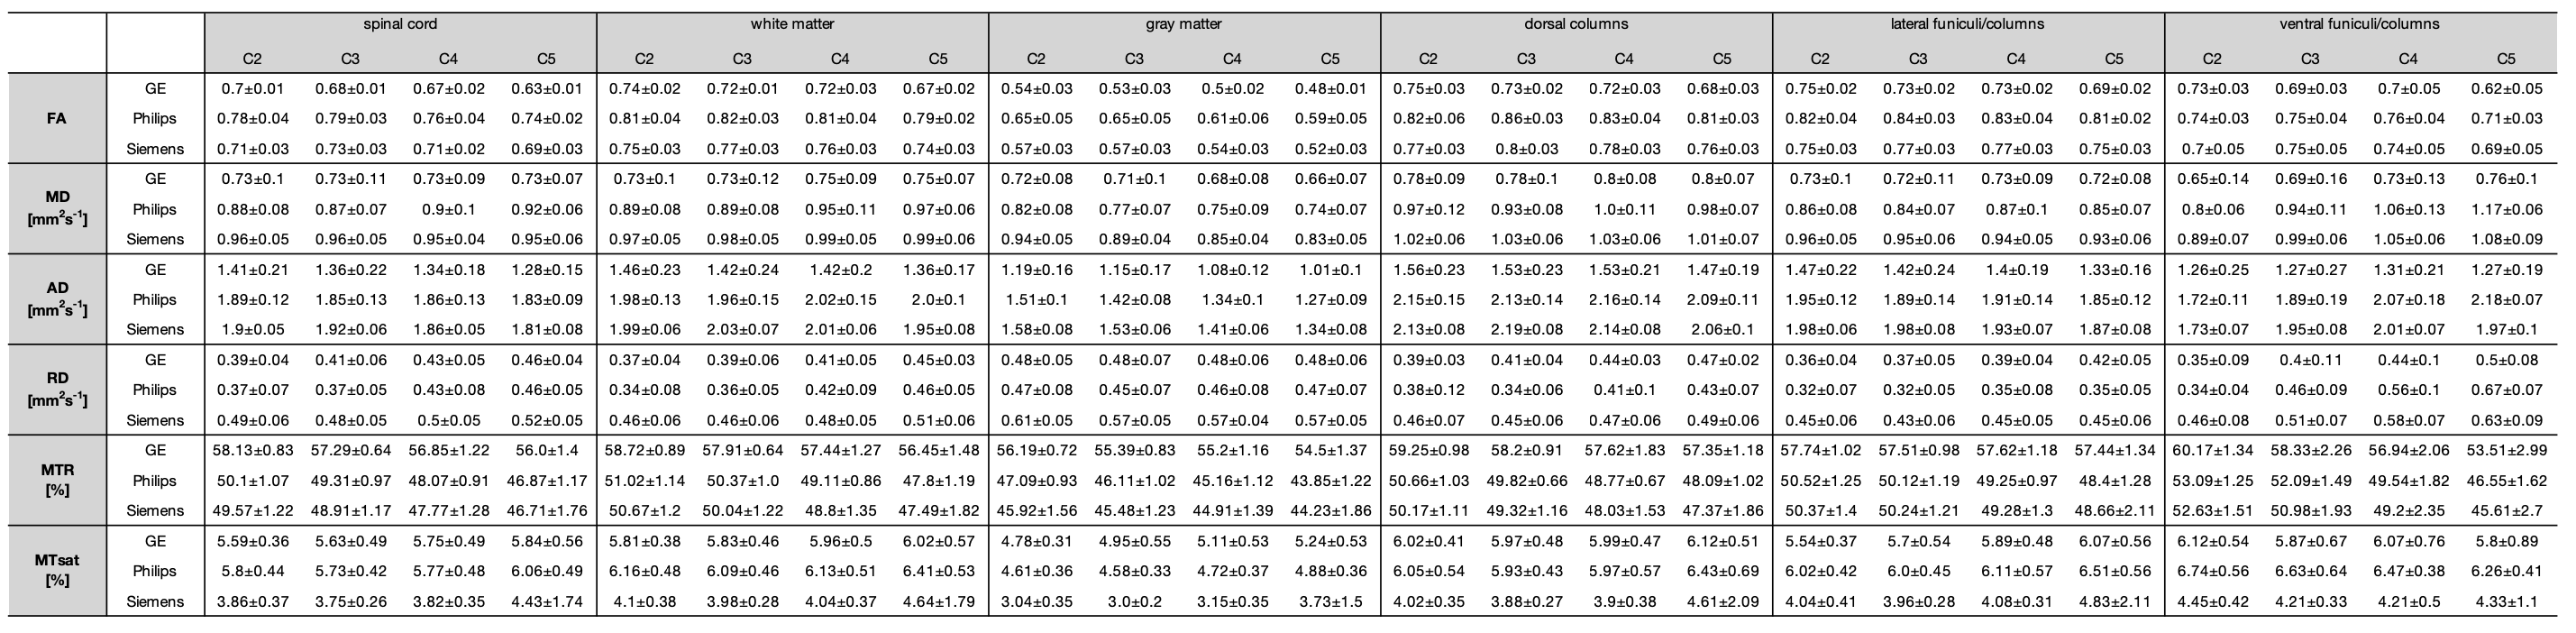
Several subjects were excluded from the analysis due to the presence of artifacts in data or issues during processingd, resulting in 255 completely processed subjects for DTI metrics, 236 subjects for MTR and 242 subjects for MTsat. Variations of individual qMRI metrics across vertebral levels for individual ROIs and each vendor are shown in Figure 2, mean and SD values are presented in Table 1.DTI metrics (FA, MD, AD, MD) showed clear dependency on vertebral levels, with generally decreasing trends from C2 to C5 level for FA and AD and increasing or constant trends from C2 to C5 level for MD and RD. These trends exhibited subtle differences among individual ROIs, mainly for gray matter and ventral columns. GE demonstrated noticeably lower values of FA, MD and AD compared to Siemens and Phillips for all ROIs.
MTR demonstrated decreasing trends from C2 to C5 level for all ROIs and all vendors with remarkably higher values across all levels for GE compared to Siemens and Philips. MTsat showed almost linear trends for all vendors for all ROIs from C2 to C5 level, with the exception of C5 level for Siemens (Figure 2) where a large COV (up to 45.42%) was also detected.
Discussion
This study showed dependency of qMRI metrics on vertebral levels for all 3 major MRI vendors on the large dataset of healthy volunteers. Although the spine-generic acquisition protocol was designed to provide similar measures across all vendors, differences between vendors in qMRI metrics were observed. GE demonstrated lower FA, MD and AD, possibly caused by lower value of primary DTI eigenvalue (λ1) which directly reflects AD and pulls down also values of MD and FA. Lower λ1 can be the result of different noise properties or slightly different diffusion gradient parameters. GE also showed higher MTR, possibly caused by different MT pulse shape and different acquisition matrix. These findings suggest that comparison of absolute values of qMRI metrics between individual vendors (and scanners) across studies should be done cautiously.Detected qMRI trends from C2 to C5 vertebral level point to different SC microstructure organization along SC, specifically to different axonal organization (lower FA and AD), higher extracellular space (higher RD) and lower myelin content (lower MTR) in caudal levels and are consistent with previous study on 48 healthy volunteers acquired at 3T Siemens Verio scanner.7 qMRI values for Philips at C3 level also correspond with study performed on 21 healthy controls scanned on 3T Philips Achieva.8
Differences in trends between individual ROI highlight the need to analyse qMRI spinal cord data at the level of individual tissues and even columns, otherwise these effects can be mixed in the analysis of whole SC ROI. More detailed tract-specific analysis will be the focus of future research.
Conclusion
We established normative qMRI metrics from a large open-source dataset of ~250 healthy volunteers for 3 major MRI vendors across individual vertebral levels and for individual ROIs. This study demonstrated that these qMRI metrics are able to reflect different microstructural organization along individual cervical levels and in different ROIs. Established normative metrics can be used as a gold standard for studies on various diseases.Acknowledgements
This research is funded by the Czech Health Research Council grant n. NV18-04-00159.References
1. Cohen-Adad, J. Microstructural imaging in the spinal cord and validation strategies. NeuroImage 182, 169–183 (2018).
2. Cohen-Adad, J. et al. Open-access quantitative MRI data of the spinal cord: Reproducibility across subjects, sites and vendors. Sci. Data submitted, (2020).
3. Cohen-Adad, J. et al. Spine Generic Public Database (Multi-Subject). (2020). doi:10.5281/zenodo.4299140
4. Cohen-Adad, J. et al. Consensus acquisition protocol for quantitative MRI of the spinal cord. Nat. Protoc. submitted, (2020).
5. De Leener, B. et al. SCT: Spinal Cord Toolbox, an open-source software for processing spinal cord MRI data. Neuroimage 145, 24–43 (2017).
6. Lévy, S. et al. White matter atlas of the human spinal cord with estimation of partial volume effect. Neuroimage 119, 262–271 (2015).
7. Taso, M. et al. Tract-specific and age-related variations of the spinal cord microstructure: A multi-parametric MRI study using diffusion tensor imaging (DTI) and inhomogeneous magnetization transfer (ihMT). NMR Biomed. 29, 817–832 (2016).
8. Schilling, K. G. et al. Diffusion MRI microstructural models in the cervical spinal cord – Application, normative values, and correlations with histological analysis. Neuroimage 201, (2019).
a. https://spine-generic.readthedocs.io/en/latest/
b. https://github.com/spine-generic/protocols
c. https://github.com/sct-pipeline/normative-metrics
d. https://github.com/spine-generic/data-multi-subject/blob/master/exclude.yml
Figures