0646
SPHERIOUSLY? The challenges of estimating spherical pore size non-invasively in the human brain from diffusion MRI1Cardiff University Brain Research Imaging Centre (CUBRIC), School of Psychology, Cardiff University, Cardiff, United Kingdom, 2Clinical Sciences Lund, Radiology, Lund University, Lund, Sweden, 3Centre for Medical Image Computing, Department of Computer Science, University College London, London, United Kingdom
Synopsis
Soma and Neurite Density Imaging (SANDI) was recently proposed to disentangle cylindrical and spherical geometries, attributed to neurite and soma compartments. In this work, using: (i) ultra-strong gradients; (ii) a combination of linear, planar, and spherical b-tensor encodings; and (iii) analysing the signal in the frequency domain, three main challenges were identified; First, the Rician noise floor biases estimation of soma properties. Second there is an empirical lower bound on the spherical signal fraction and pore-size. Third, if there is sensitivity to the transverse intra-cellular diffusivity in cylindrical structures, estimation of spherical pore-size is challenging.
Introduction
Diffusion magnetic resonance imaging (dMRI) is a non-invasive technique used to model brain microstructure1-5. Most dMRI models separate the tissue into intra- and extra- neurite non-exchanging compartments which is not a good representation of the signal in gray matter 6-12. Addressing this model insufficiency, Palombo et al.13 introduced a three-compartment model called Soma And Neurite Density Imaging (SANDI) which may suffer from degeneracy14-19.Q-space trajectory imaging was recently introduced20, where linear, planar, and spherical tensor encoding (LTE, PTE, and STE) are defined when the b-tensor has respectively, one, two, and three non-zero eigenvalues18,21-24.
In this study, we used b-tensor encoding and frequency-domain analysis in SANDI model and we found that fitting the spherical pore properties remains challenging for small signal fractions, i.e. <~10%.
F-statistic shows a lower bound on the detectable MRI signal fraction ($$$10\%$$$ for SNR=50).
Numerical simulations, yielded a lower limit of $$$3\,\mu m$$$ while the one from power-law is $$$7\,\mu m$$$.
The fitting becomes more challenging if we have cylinders instead of sticks.
Theory
For a general B-matrix, the diffusion-weighted MR signal of a three-compartment model is:$$S(\mathbf{B})/S_0=f_{\mathrm{cylinder}}\int_{\mathbb{S}^2} W(\kappa,\mathbf{n}) e^{-\mathbf{B}:\mathbf{D}_{\rm{cylinder}}(\mathbf{n},t)} \mathrm{d}\mathbf{n}+f_{\rm{sphere}}S_{\rm{sphere}}(D_{\rm{sphere}}(t),\mathbf{B})+f_{\rm{ball}} e^{-bD_{\rm{ball}}}\;\;\;(1)$$
where
$$$f_{\mathrm{cylinder}},\,f_{\mathrm{ball}},\,f_{\mathrm{sphere}},\,\mathbf{D}_{\mathrm{cylinder}}(\mathbf{n},t)=(D_{\mathrm{in}}^{\mid\mid}-D_{\mathrm{in}}^{\perp}(t))\mathbf{n}\mathbf{n}^T+D_{\mathrm{in}}^{\perp}(t)I,\,D_{\mathrm{ball}}\,\rm{and}\,D_{\mathrm{sphere}}$$$ are the cylinder, ball and sphere signal fractions and diffusivities, respectively 25. $$$W(\mathbf{n})$$$ is the Watson orientation distribution function with $$$\kappa$$$ as the dispersion parameter. $$$\mathbf{B}=\int_0^{TE}\mathbf{q}(t)\mathbf{q}^\intercal(t)\rm{d}t$$$ where $$$\mathbf{q}(t)=\gamma\int_0^t\mathbf{g}(t^\prime)\rm{d}t^\prime$$$ 20,26, and $$$\gamma$$$ is the gyromagnetic ratio. Axial and radial elements in the diagonal axisymmetric b-tensor are $$$b_{\mid\mid}$$$ and $$$b_\perp$$$ respectively, b-value, $$$b$$$ is the trace of $$$B$$$-matrix and $$$b_\Delta=(b_{\mid\mid}-b_\perp)/b$$$26.
The acquired signal is averaged over all diffusion directions for each shell27,28. Compartmental diffusion is represented with axisymmetric diffusion tensors with isotropic diffusivity, $$$D_I=1/3D_{\mid\mid}+2/3\,D_{\perp}$$$, and anisotropy, $$$D_\Delta=(D_{\mid\mid}-D_{\perp})/(D_{\mid \mid}+2\,D_{\perp})$$$ where $$$D_{\mid\mid}$$$ and $$$D_{\perp}$$$ are the axial and radial diffusivities, respectively. The signal attenuation from the $$$k$$$th compartment is given by19,26:
$$A_k(b,b_\Delta,D_{I;k},D_{\Delta;k})=\exp(-b\,D_{I;k}[1-b_\Delta\,D_{\Delta;k}])\cdot\,g(3b D_{I;k}\,b_\Delta\,D_{\Delta;k})\;\;\;(2)$$
where
$$g(\alpha)=\int_0^1\,\exp(-\alpha\,x^2)\mathrm{d}x=\sqrt{\frac{\pi}{4\alpha}}\rm{erf}(\sqrt{\alpha})\;\;\;(3)$$
and $$$\rm{erf}(.)$$$ is the error function 29. Therefore, the full signal equation is:
$$S/S_0=f_{\rm{cylinder}/\rm{stick}}A_{\rm{cylinder}/\rm{stick}}+f_{\rm{sphere}}A_{\rm{sphere}}+f_{\rm{ball}}A_{\rm{ball}}\;\;\;(4)$$
For complex gradient waveforms, the diffusion time is ill-defined. The analysis is taken in the frequency domain and therefore we consider the diffusion spectrum $$$D_{\rm{cylinder}}^\perp(\omega),\,D_{\rm{sphere}}(\omega)$$$30,31.
Method
The numerical simulations were performed using the model in Eq (1), with $$$f_{\rm{sphere}}=0.01:0.01:0.1,\,0.15,\,0.2:0.1:1,\,f_{\rm{ball}}=f_{\rm{stick}}=(1-f_{\rm{sphere}})/2,\,D_{\rm{in}}^{\mid\mid}=2\;\mu m^2/ms,\,D_{\rm{ball}}=0.6\;\mu m^2/ms,\,R_{\rm{sphere}}=1:1:10\;\mu m$$$, and $$$R_{\rm{cylinder}}=4\;\mu m$$$. The simulated protocol comprised 10 $$$b=0$$$ and 8 non-zero shells ($$$b=1,\,2,\,3,\,4.5,\,6,\,7.5,\,9,\,10.5\;ms/\mu m^2$$$) in ($$$10,\,31,\,31,\,31,\,31,\,61,\,61,\,61,\,61$$$) directions for LTE and 5 shells ($$$b=1,\,2,\,3,\,4.5,\,6\;ms/\mu m^2$$$) in ($$$31,\,31,\,31,\,31,\,61$$$) directions 32 for PTE and 5 shells for STE ($$$b=0.2,\,1,\,2,\,3,\,4.5\;ms/\mu m^2$$$) in ($$$6,\,9,\,9,\,12,\,15$$$) directions and SNR=50.To identify the empirical lower bound on detectable spherical pore size, we fitted a power-law8,9,17 to the direction-averaged signal from the LTE measurements for $$$b=6,\,7.5,\,9,\,10.5\,ms/\mu m^2$$$ ($$$S/S_0=\beta\,b^{-\alpha}$$$) and then compared the values of $$$\alpha$$$, with values observed in vivo.
Diffusion-weighted images (DWIs) were acquired from two healthy participants with the protocol detailed in the simulation on a 3T Connectom MR imaging system. Forty-two axial slices with $$$3\,mm$$$ isotropic voxel size and a 78$$$\times$$$78 matrix size, $$$TE=88\,ms$$$, $$$TR=3000\,ms$$$ were obtained.
DWIs were corrected for Gibbs ringing33, motion, eddy currents 34, and gradient nonlinearity 35. A 3D Gaussian filter with a standard deviation of 0.5 was applied to smooth the images.
Results
Fig. 1 shows the gradient waveforms and the signal decay inside the spherical and cylindrical compartments.Fig. 2 (a) shows the results of fitting the sphere radius under different noise simulations. The results of F-test (p-value) show when the sphere radius or the signal fraction of the sphere is small ($$$R_{\rm{sphere}}<2\,\mu m$$$ and $$$f_{\rm{sphere}}<0.05$$$) the simplified model is preferred.
Fig. 2 (b) shows the estimated sphere size when there is a non-zero diameter cylinder, (SNR = 200).
Fig. 3 shows the results of fitting the model to the signal from five different ROIs in the brain.
Fig. 4 illustrates the estimated parameters on in vivo data including the noise floor as an extra parameter.
Fig. 5 (a) shows the effect of sphere signal fraction and size on the estimated exponent, $$$\alpha$$$, in the power-law fit ($$$S/S_0=\beta\,b^{-\alpha}$$$).
In Fig. 5 (b) we do not observe values of $\alpha$ less than 0.5 in the white matter. This places a lower bound on the size of spherical pores of around $$$7\,\mu m$$$.
Discussion and Conclusion
In this work, we have demonstrated key challenges and limitations in estimating spherical pore size non-invasively in the human brain from dMRI.Our simulations show the effect of Rician bias and identified the lower bound limit of the sphere signal fraction and size that can be detected from the diffusion-weighted signal from both an SNR and empirical perspective.
We showed that for small signal fraction of soma, ($$$<10\%$$$) this is a problem. However, we know from detailed microscopy of brain cortex 36,37, that in GM the soma signal fraction is on average $$$>20\%$$$. Therefore, reliable estimation of soma properties in GM is possible, while in WM it presents several challenges.
Using the ultra-strong gradients of the Connectom scanner, the diffusion signal in the white matter can be made sensitive to the axon diameter, and therefore we have the cylinder+ball+sphere model which has two time-dependencies. Disentangling these two by only changing the frequency content of the encoding waveform is challenging.
Studying all these challenges prevents misinterpretation of the biased estimated parameters as the potential biomarkers in clinical studies.
Acknowledgements
The data were acquired at the UK National Facility for In Vivo MR Imaging of Human Tissue Microstructure funded by the EPSRC (grant EP/M029778/1), and The Wolfson Foundation. MA and DKJ are supported by a Wellcome Trust Investigator Award (096646/Z/11/Z) and a Wellcome Trust Strategic Award (104943/Z/14/Z). The authors would like to thank Filip Szczepankiewicz for providing the pulse sequences for b-tensor encoding. We thank Lars Mueller for setting up the protocol for b-tensor encoding. MP is supported by UK EPSRC EP/N018702/1 and UKRI Future Leaders Fellowship MR/T020296/1.References
1- Mitra, P.P., Sen, P.N., Schwartz, L.M., Le Doussal, P. Diffusion propagator as a probe of the structure of porous media. Physical review letters 1992;68(24):3555.
2- Wiegell, M.R., Larsson, H.B., Wedeen, V.J. Fiber crossing in human brain depicted with diffusion tensor MR imaging. Radiology2000;217(3):897–903.
3- Stanisz, G., Wright, G., Henkelman, R., Szafer, A. An analytical model of restricted diffusion in bovine optic nerve. Magnetic Resonance in Medicine 1997;37(1):103–111.
4- Zhang, H., Schneider, T., Wheeler-Kingshott, C., Alexander, D. NODDI: practical in vivo neurite orientation dispersion and density imaging of the human brain. Neuroimage 2012;61(4):1000–1016.
5- Assaf, Y., Blumenfeld-Katzir, T., Yovel, Y., Basser, P. Axcaliber: a method for measuring axon diameter distribution from diffusion MRI. Magnetic Resonance in Medicine: An Official Journal of the International Society for Magnetic Resonance in Medicine 2008;59(6):1347–1354.
6- Afzali, M., Aja-Fern ́andez, S., Jones, D.K. Direction-averaged diffusion-weighted MRI signal using different axisymmetric b-tensor encoding schemes. Magnetic Resonance in Medicine 2020a;
7- Afzali, M., Pieciak, T., Newman, S., Garifallidis, E., ̈Ozarslan, E., Cheng, H., Jones, D.K. The sensitivity of diffusion MRI to microstructural properties and experimental factors. Journal of Neuroscience Methods 2020b; 108951.
8- McKinnon, E.T., Jensen, J.H., Glenn, G.R., Helpern, J.A. Dependence on b-value of the direction-averaged diffusion-weighted imaging signal in brain. Magnetic resonance imaging 2017;36:121–127.
9- Veraart, J., Fieremans, E., Novikov, D.S. On the scaling behavior of water diffusion in human brain white matter. NeuroImage 2019;185:379–387.
10- Palombo, M., Shemesh, N., Ianus, A., Alexander, D., Zhang, H.. Abundance of cell bodies can explain the stick model's failure in grey matter at high b value. ISMRM (International Society for Magnetic Resonance in Medicine); 2018a.
11- Henriques, R.N., Jespersen, S.N., Shemesh, N. Microscopic anisotropy misestimation in spherical-mean single diffusion encoding MRI. Magnetic resonance in medicine 2019;81(5):3245–3261.
12- Jespersen, S.N., Olesen, J.L., Ianu ̧s, A., Shemesh, N. Effects of nongaussian diffusion on isotropic diffusion measurements: an ex-vivo microimaging and simulation study. Journal of Magnetic Resonance 2019;300:84–94.
13- Palombo, M., Ianus, A., Guerreri, M., Nunes, D., Alexander, D.C., Shemesh, N., Zhang, H.. SANDI: a compartment-based model for non-invasive apparent soma and neurite imaging by diffusion MRI. NeuroImage 2020;:116835.
14- Jelescu, I., Veraart, J., Fieremans, E., Novikov, D. Degeneracy in model parameter estimation for multi-compartmental diffusion in neuronal tissue. NMR in Biomedicine 2016;29(1):33–47.
15- Novikov, D.S., Kiselev, V.G., Jespersen, S.N. On modeling. Magnetic resonance in medicine 2018b;79(6):3172–3193.
16- Jones, D.K., Kn ̈osche, T.R., Turner, R.. White matter integrity, fiber count, and other fallacies: the do’s and don’ts of diffusion MRI. Neuroimage 2013;73:239–254.
17- Lampinen, B., Szczepankiewicz, F., M ̊artensson, J., van Westen, D., Sundgren, P.C., Nilsson, M. Neurite density imaging versus imaging of microscopic anisotropy in diffusion MRI: a model comparison using spherical tensor encoding. Neuroimage 2017;147:517–531.
18- Lampinen, B., Szczepankiewicz, F., M ̊artensson, J., van Westen, D., Hansson, O., Westin, C.F., Nilsson, M.. Towards unconstrained compartment modeling in white matter using diffusion-relaxation MRI with tensor-valued diffusion encoding. Magnetic Resonance in Medicine 2020;84(3):1605–1623.
19- Lampinen, B., Szczepankiewicz, F., Nov ́en, M., van Westen, D., Hansson, O., Englund, E., M ̊artensson, J., Westin, C.F., Nilsson, M.. Searching for the neurite density with diffusion MRI: challenges for biophysical modeling. Human brain mapping 2019;40(8):2529–2545.
20- Westin, C.F., Knutsson, H., Pasternak, O., Szczepankiewicz, F., ̈Ozarslan, E., van Westen, D., Mattisson, C., Bogren, M., O’donnell, L.J., Kubicki, M., et al. Q-space trajectory imaging for multidimensional diffusion MRI of the human brain. Neuroimage 2016;135:345–362.
21- Reisert, M., Kiselev, V.G., Dhital, B. A unique analytical solution of the white matter standard model using linear and planar encodings. Magnetic resonance in medicine 2019;81(6):3819–3825.
22- Coelho, S., Pozo, J.M., Jespersen, S.N., Jones, D.K., Frangi, A.F. Resolving degeneracy in diffusion MRI biophysical model parameter estimation using double diffusion encoding. Magnetic Resonance in Medicine 2019;82(1):395–410.
23- Fieremans, E., Veraart, J., Benjamin, A., Filip, S., Nilsson, M., Novikov, D. Effect of combining linear with spherical tensor encoding on estimating brain microstructural parameters. Proceedings of the ISMRM, Paris 2018.
24- Gyori, N., Clark, C., Dragonu, I., Alexander, D., Kaden, E. In-vivo neural soma imaging using b-tensor encoding and deep learning. In: Proceedings of the 27th Annual Meeting of ISMRM, Montreal, Canada. 2019.
25- Murday, J., Cotts, R.M. Self-diffusion coefficient of liquid lithium.The Journal of Chemical Physics 1968;48(11):4938–4945.
26- Eriksson, S., Lasiˇc, S., Nilsson, M., Westin, C.F., Topgaard, D. NMR diffusion-encoding with axial symmetry and variable anisotropy: Distinguishing between prolate and oblate microscopic diffusion tensors with unknown orientation distribution. The Journal of chemical physics 2015;142(10):104201.
27- Jespersen, S.N., Lundell, H., Sønderby, C.K., Dyrby, T.B. Orientationally invariant metrics of apparent compartment eccentricity from double pulsed field gradient diffusion experiments. NMR in Biomedicine 2013;26(12):1647–1662.
28- Lasiˇc, S., Szczepankiewicz, F., Eriksson, S., Nilsson, M., Topgaard, D. Microanisotropy imaging: quantification of microscopic diffusion anisotropy and orientational order parameter by diffusion MRI with magic-angle spinning of the q-vector. Frontiers in Physics 2014;2:11.
29- Callaghan, P., Jolley, K., Lelievre, J. Diffusion of water in the endosperm tissue of wheat grains as studied by pulsed field gradient nuclear magnetic resonance. Biophysical journal 1979;28(1):133–141.
30- Stepiˇsnik, J.. Time-dependent self-diffusion by NMR spin-echo.Physica B: Condensed Matter 1993;183(4):343–350.
31- Lundell, H., Nilsson, M., Dyrby, T., Parker, G., Cristinacce, P.H., Zhou, F.L., Topgaard, D., Lasiˇc, S. Multidimensional diffusion MRI with spectrally modulated gradients reveals unprecedented microstructural detail. Scientific reports 2019;9(1):9026.
32- Knutsson, H.. Towards optimal sampling in diffusion MRI. In: International Conference on Medical Image Computing and Computer-Assisted Intervention. Springer; 2018. p. 3–18.
33- Kellner, E., Dhital, B., Kiselev, V.G., Reisert, M.. Gibbs-ringing artifact removal based on local subvoxel-shifts. Magnetic resonance in medicine 2016;76(5):1574–1581.
34- Andersson, J.L., Sotiropoulos, S.N. An integrated approach to correction for off-resonance effects and subject movement in diffusion MR imaging. Neuroimage 2016;125:1063–1078.
35- Rudrapatna, U., Parker, G.D., Jamie, R., Jones, D.K. A comparative study of gradient nonlinearity correction strategies for processing diffusion data obtained with ultra-strong gradient MRI scanners. Magnetic Resonance in Medicine 2020.
36- Beul, S.F., Hilgetag, C.C. Neuron density fundamentally relates to architecture and connectivity of the primate cerebral cortex. NeuroImage 2019;189:777–792.
37- Collins, C.E., Airey, D.C., Young, N.A., Leitch, D.B., Kaas, J.H. Neuron densities vary across and within cortical areas in primates. Proceedings of the National Academy of Sciences 2010;107(36):15927–15932.
Figures
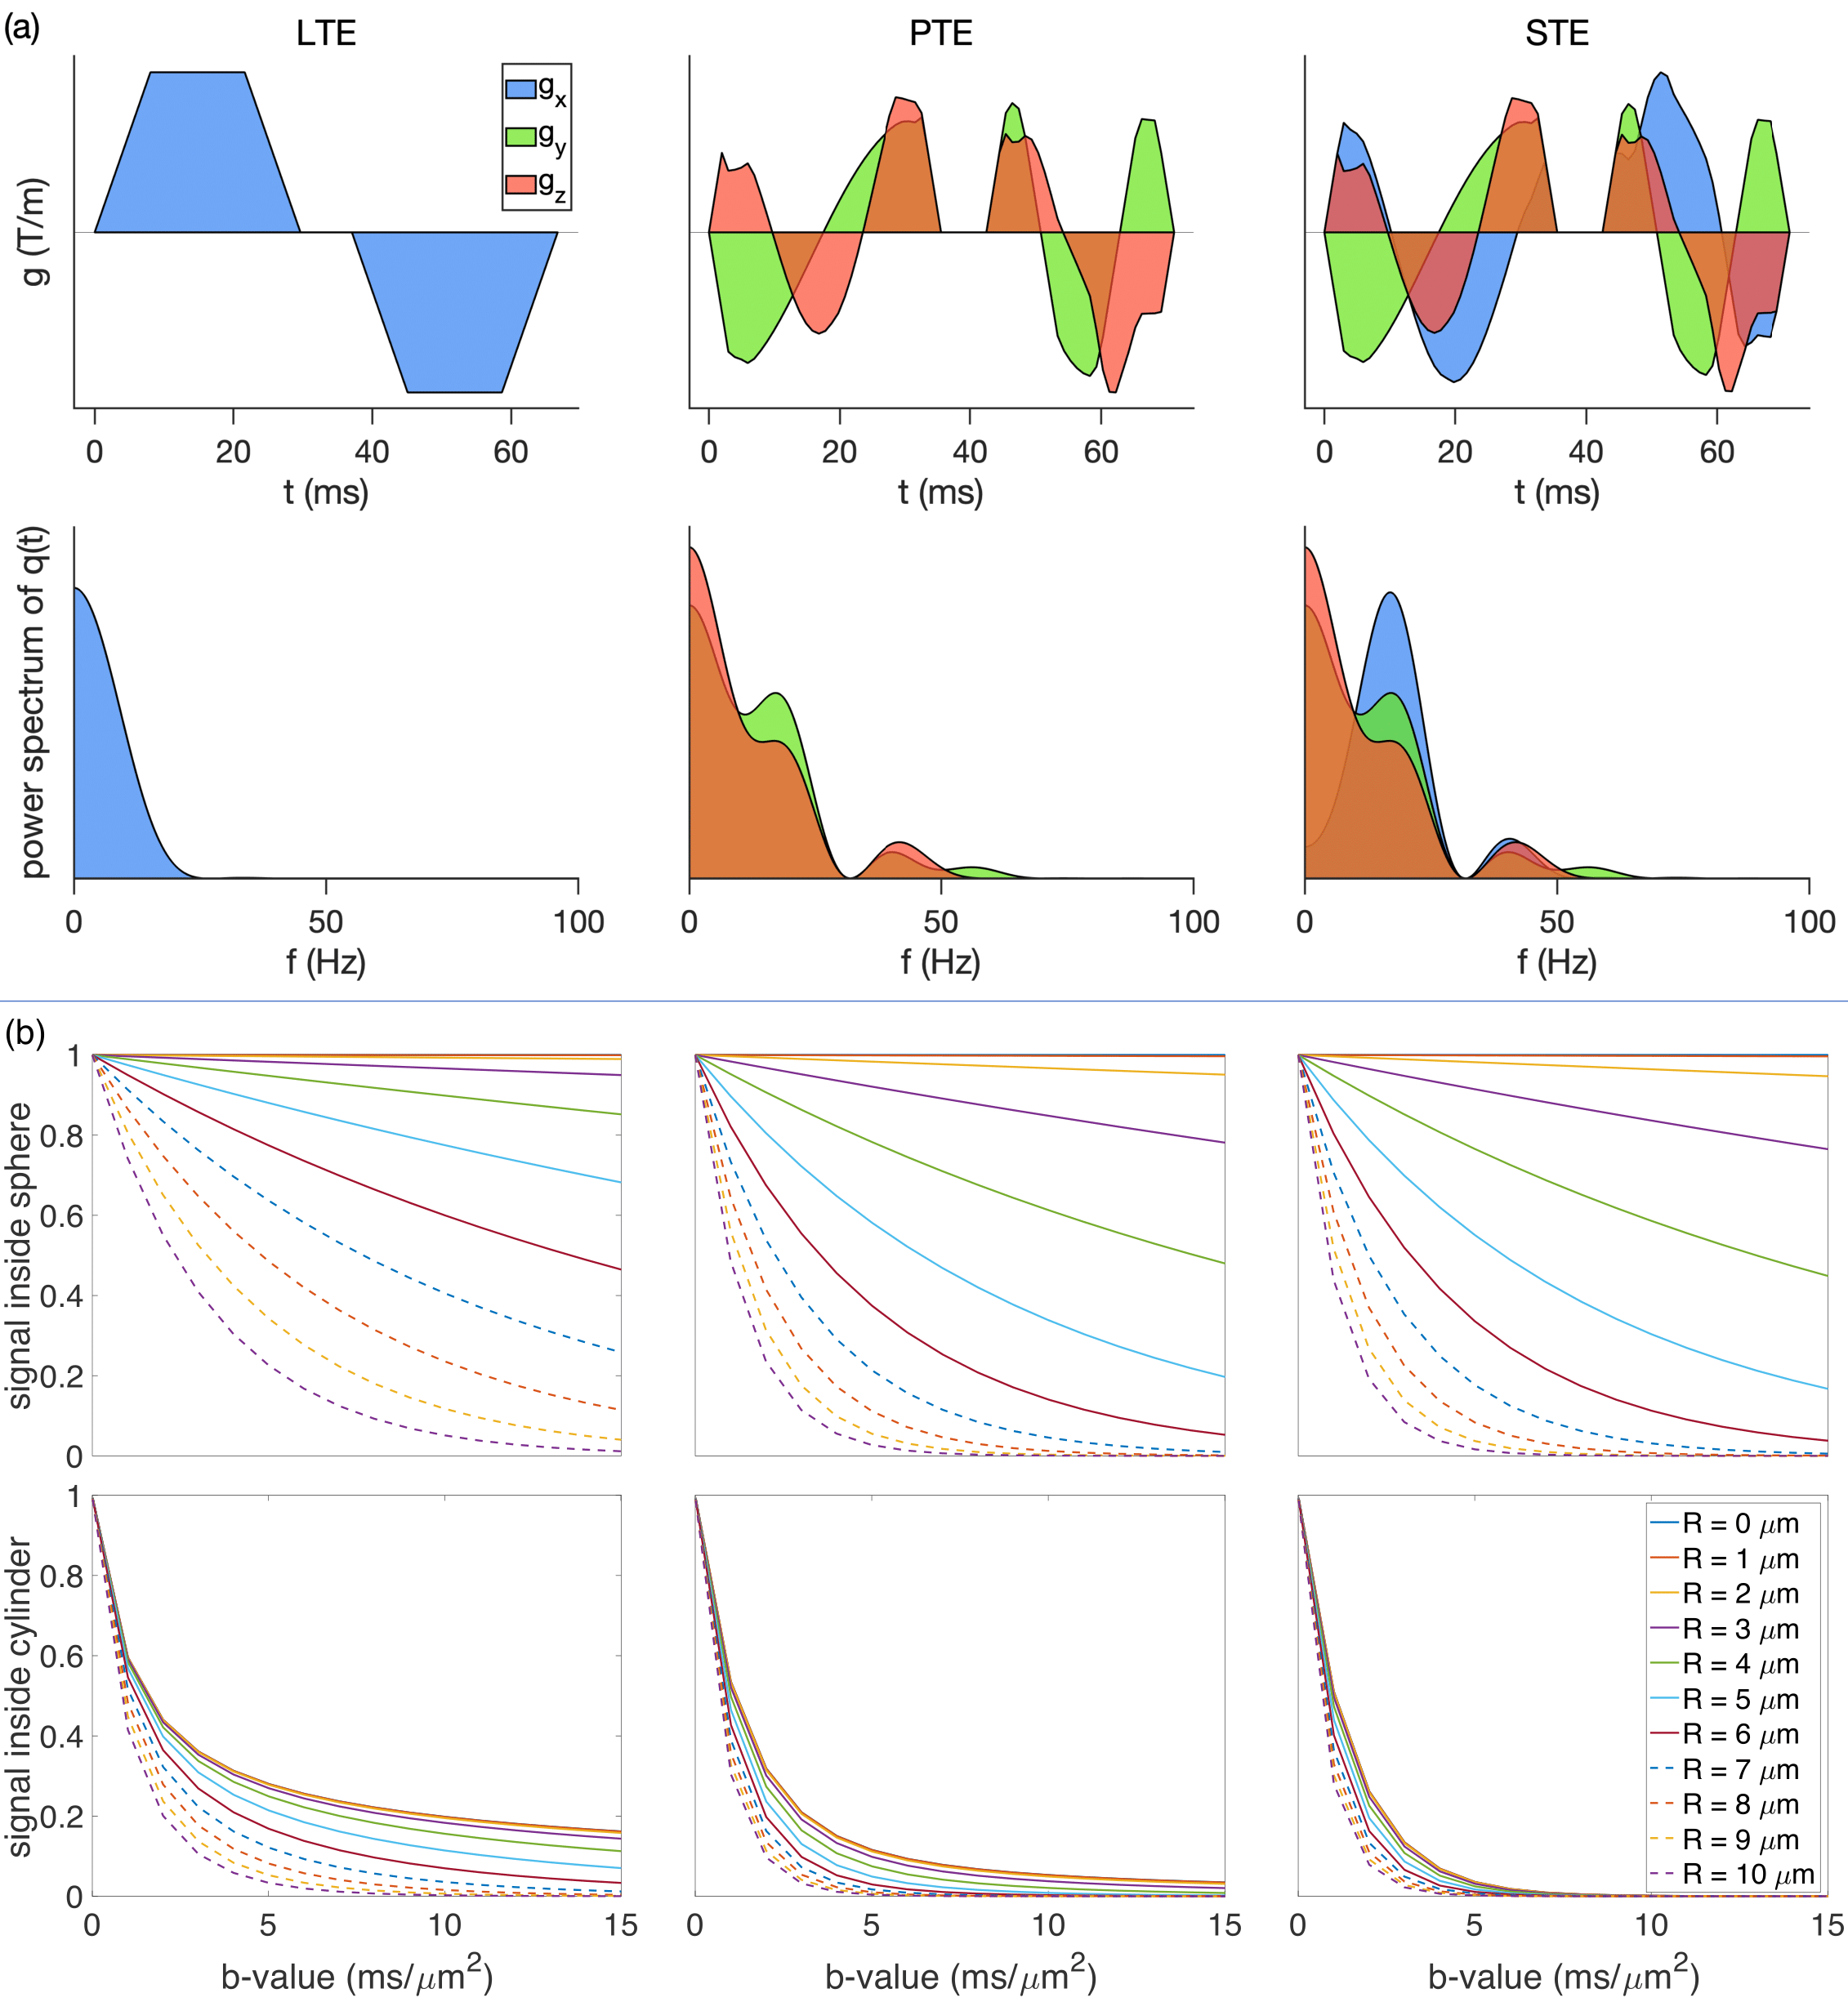
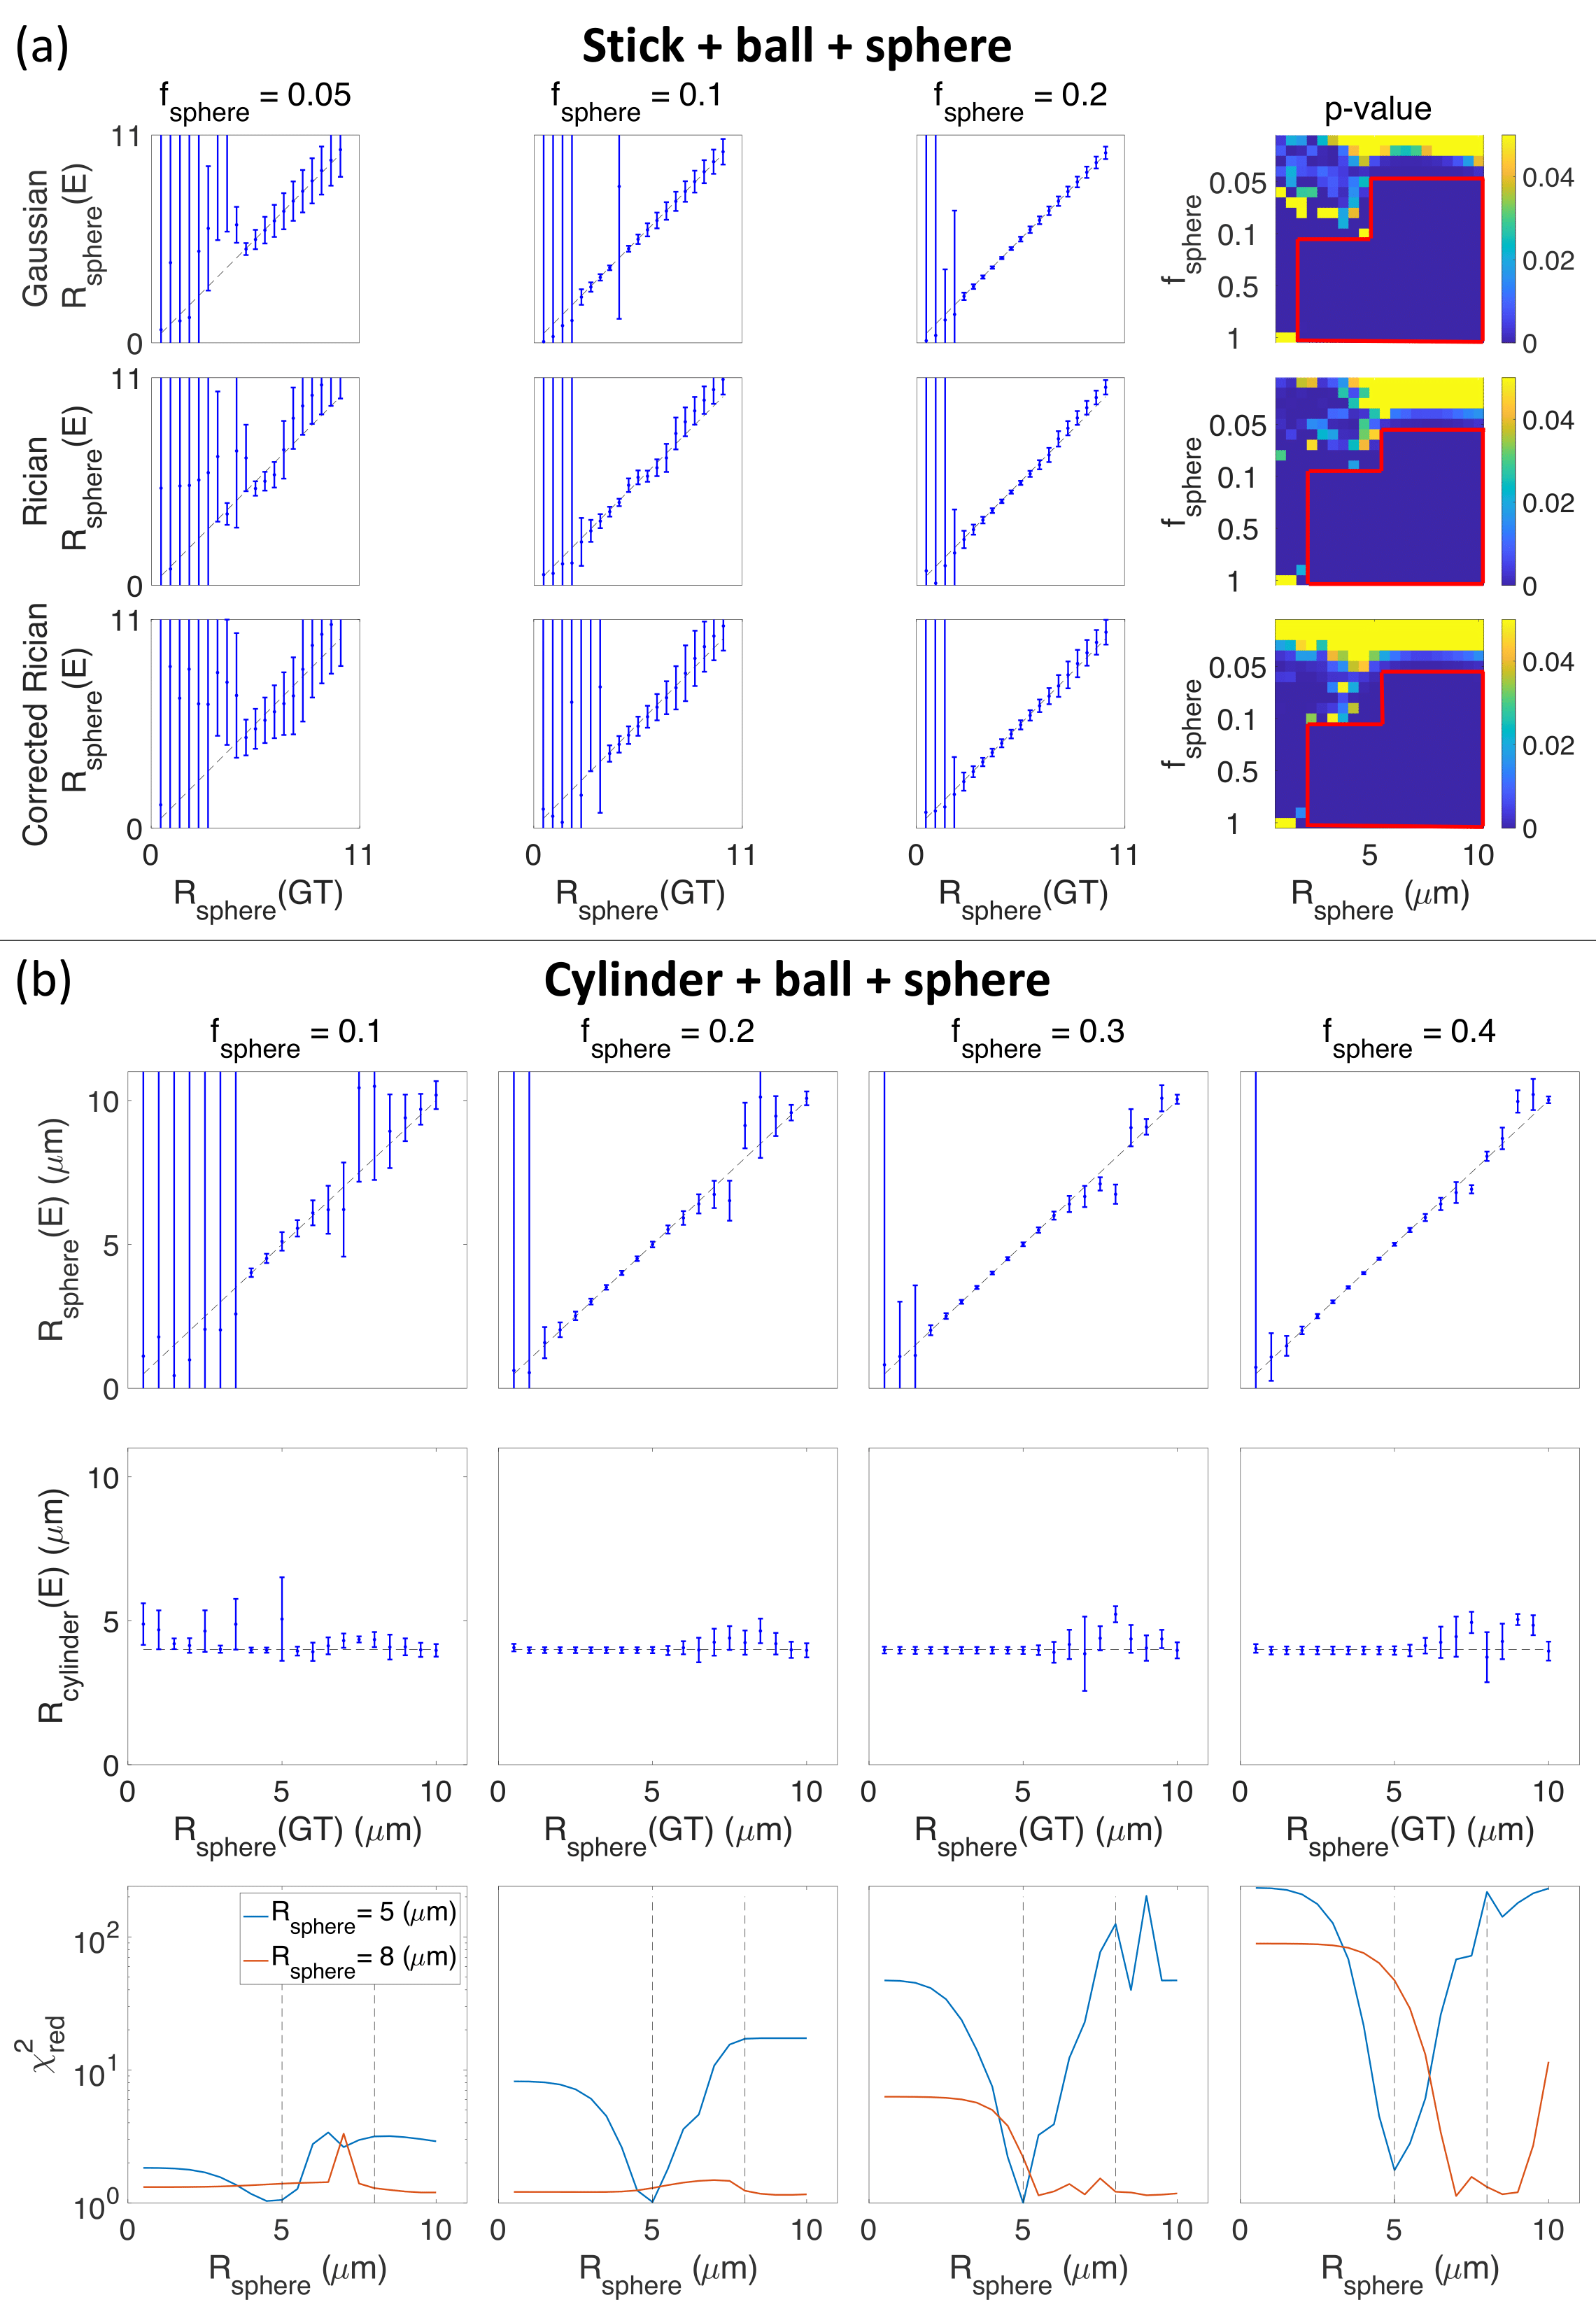
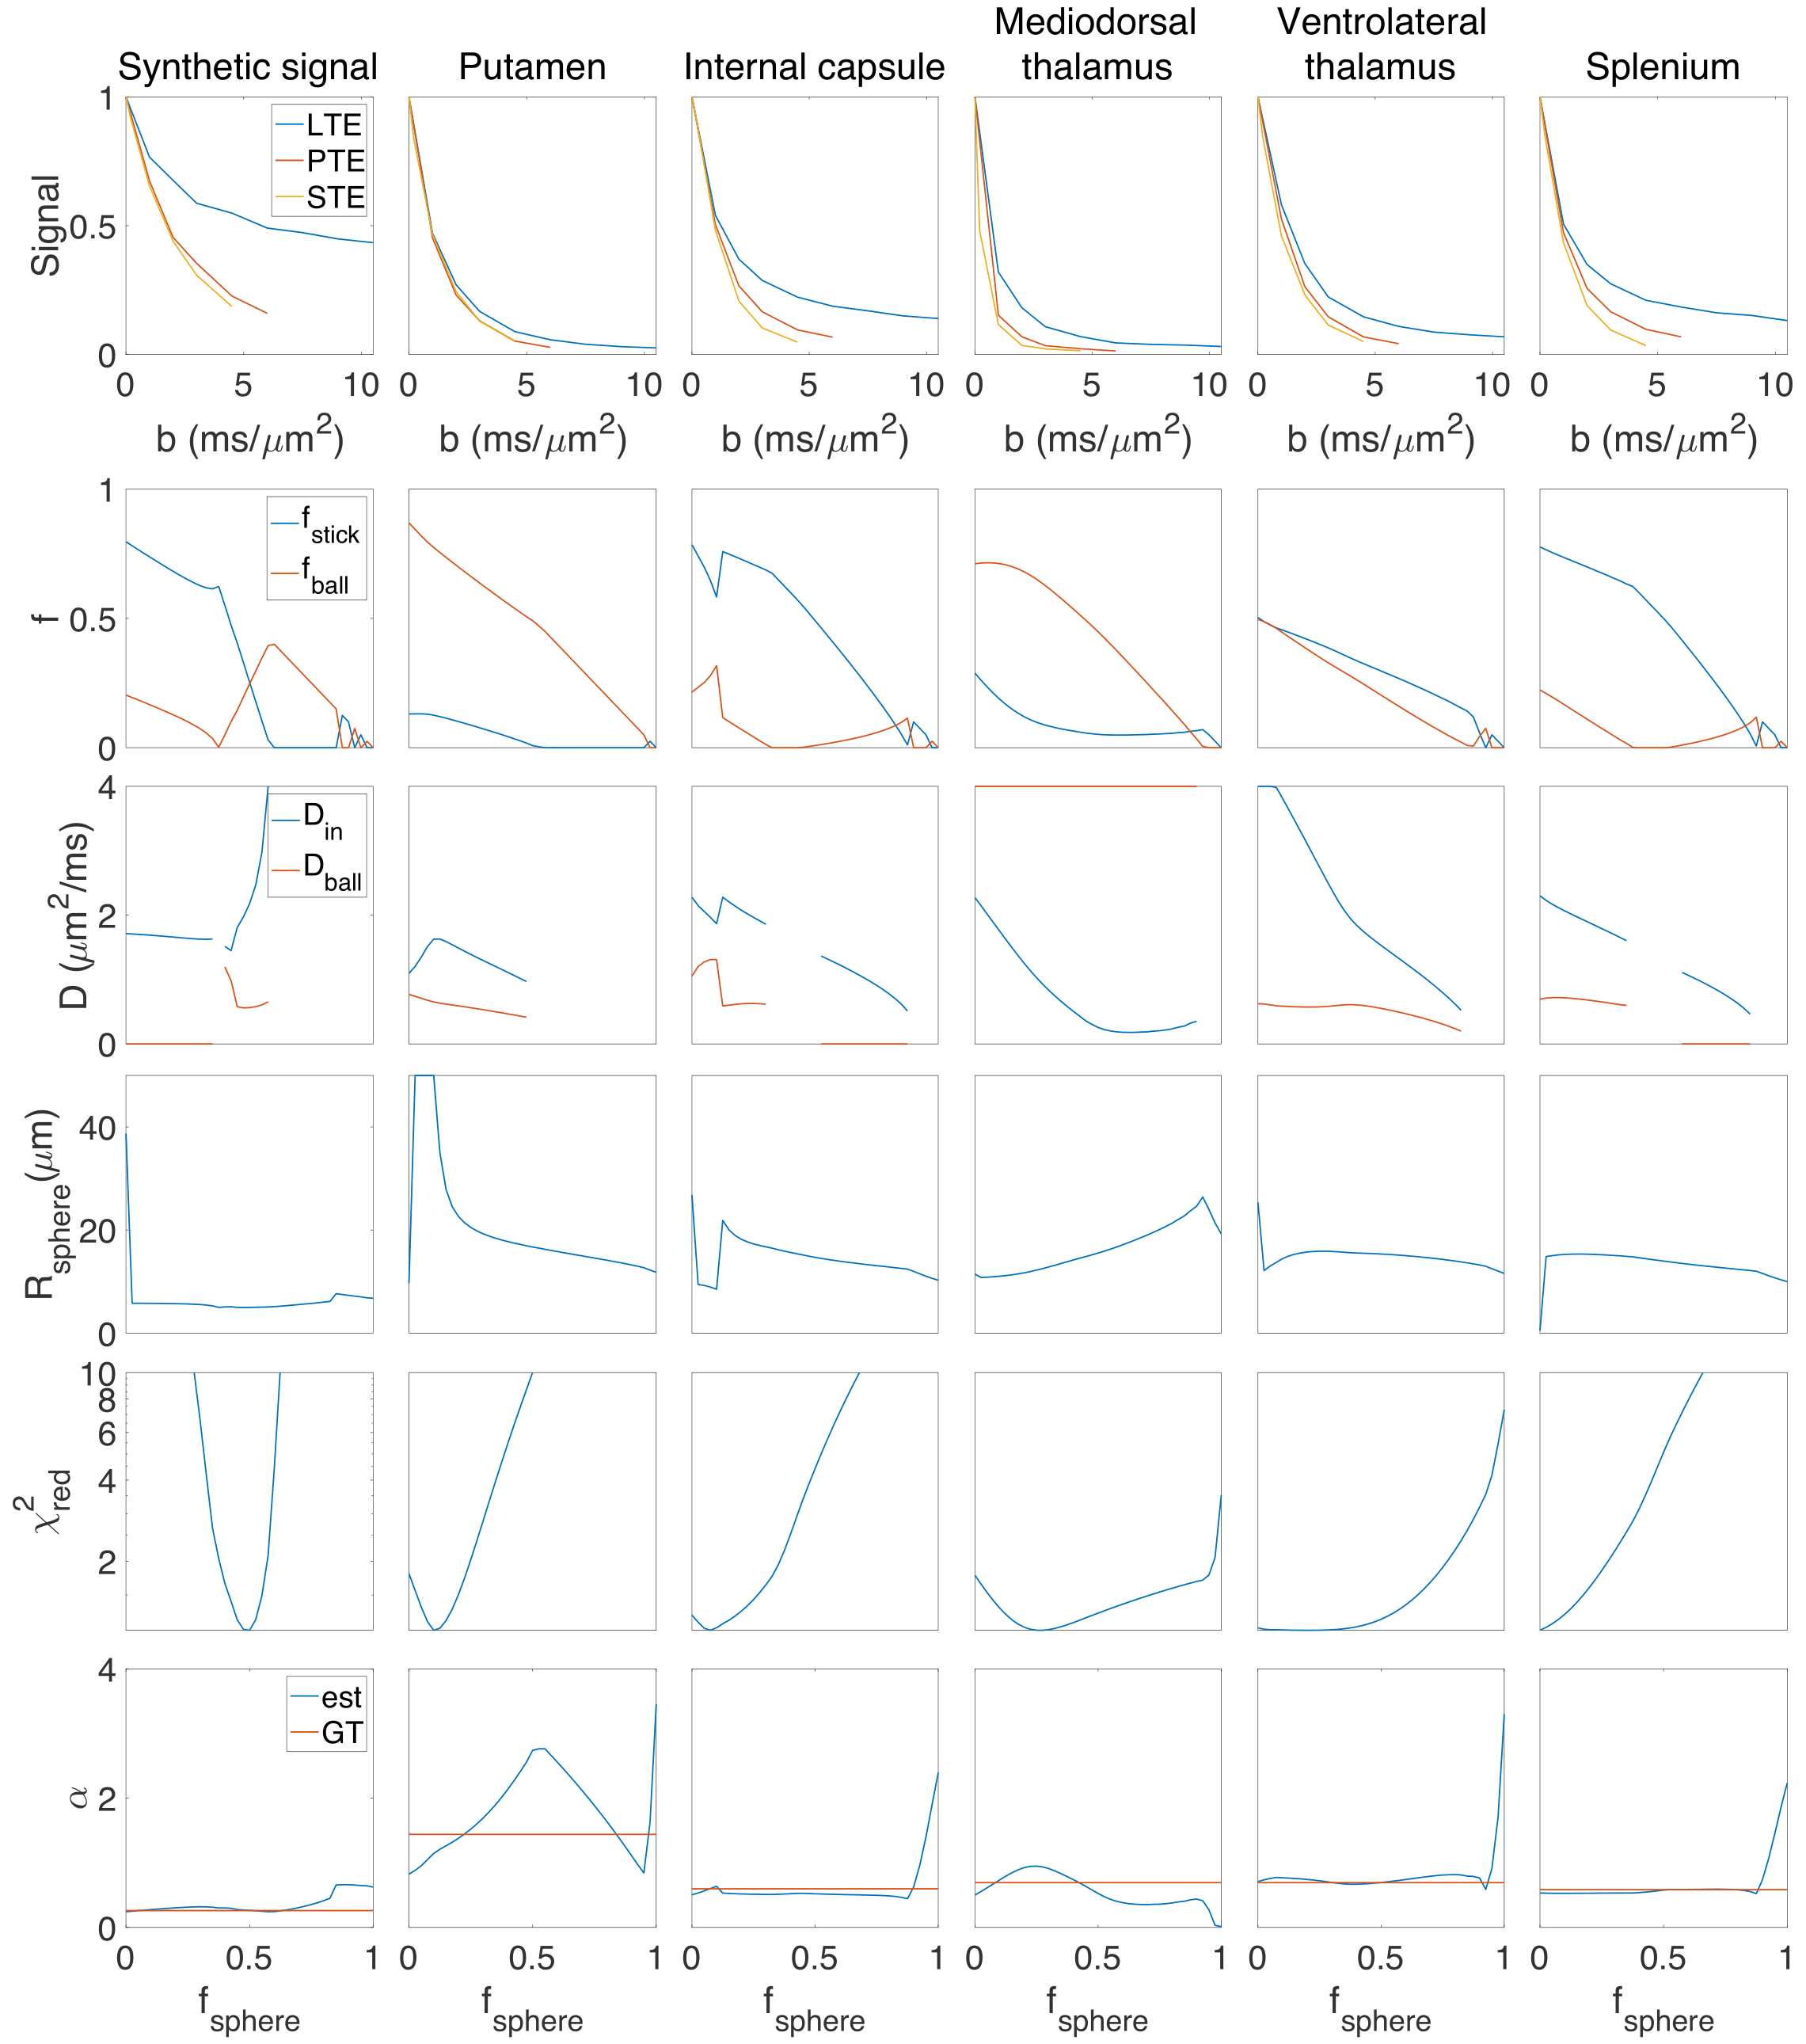
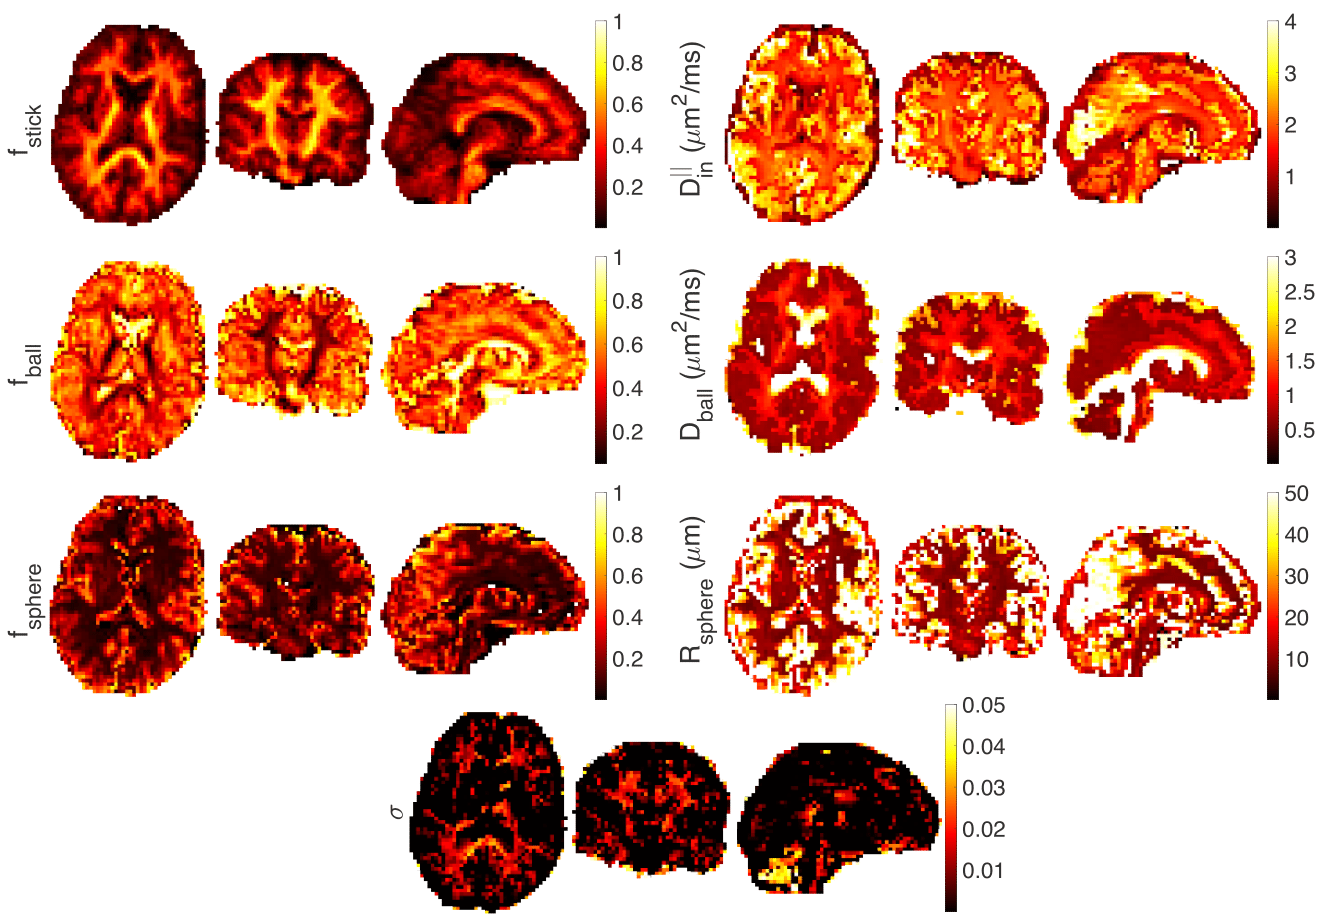
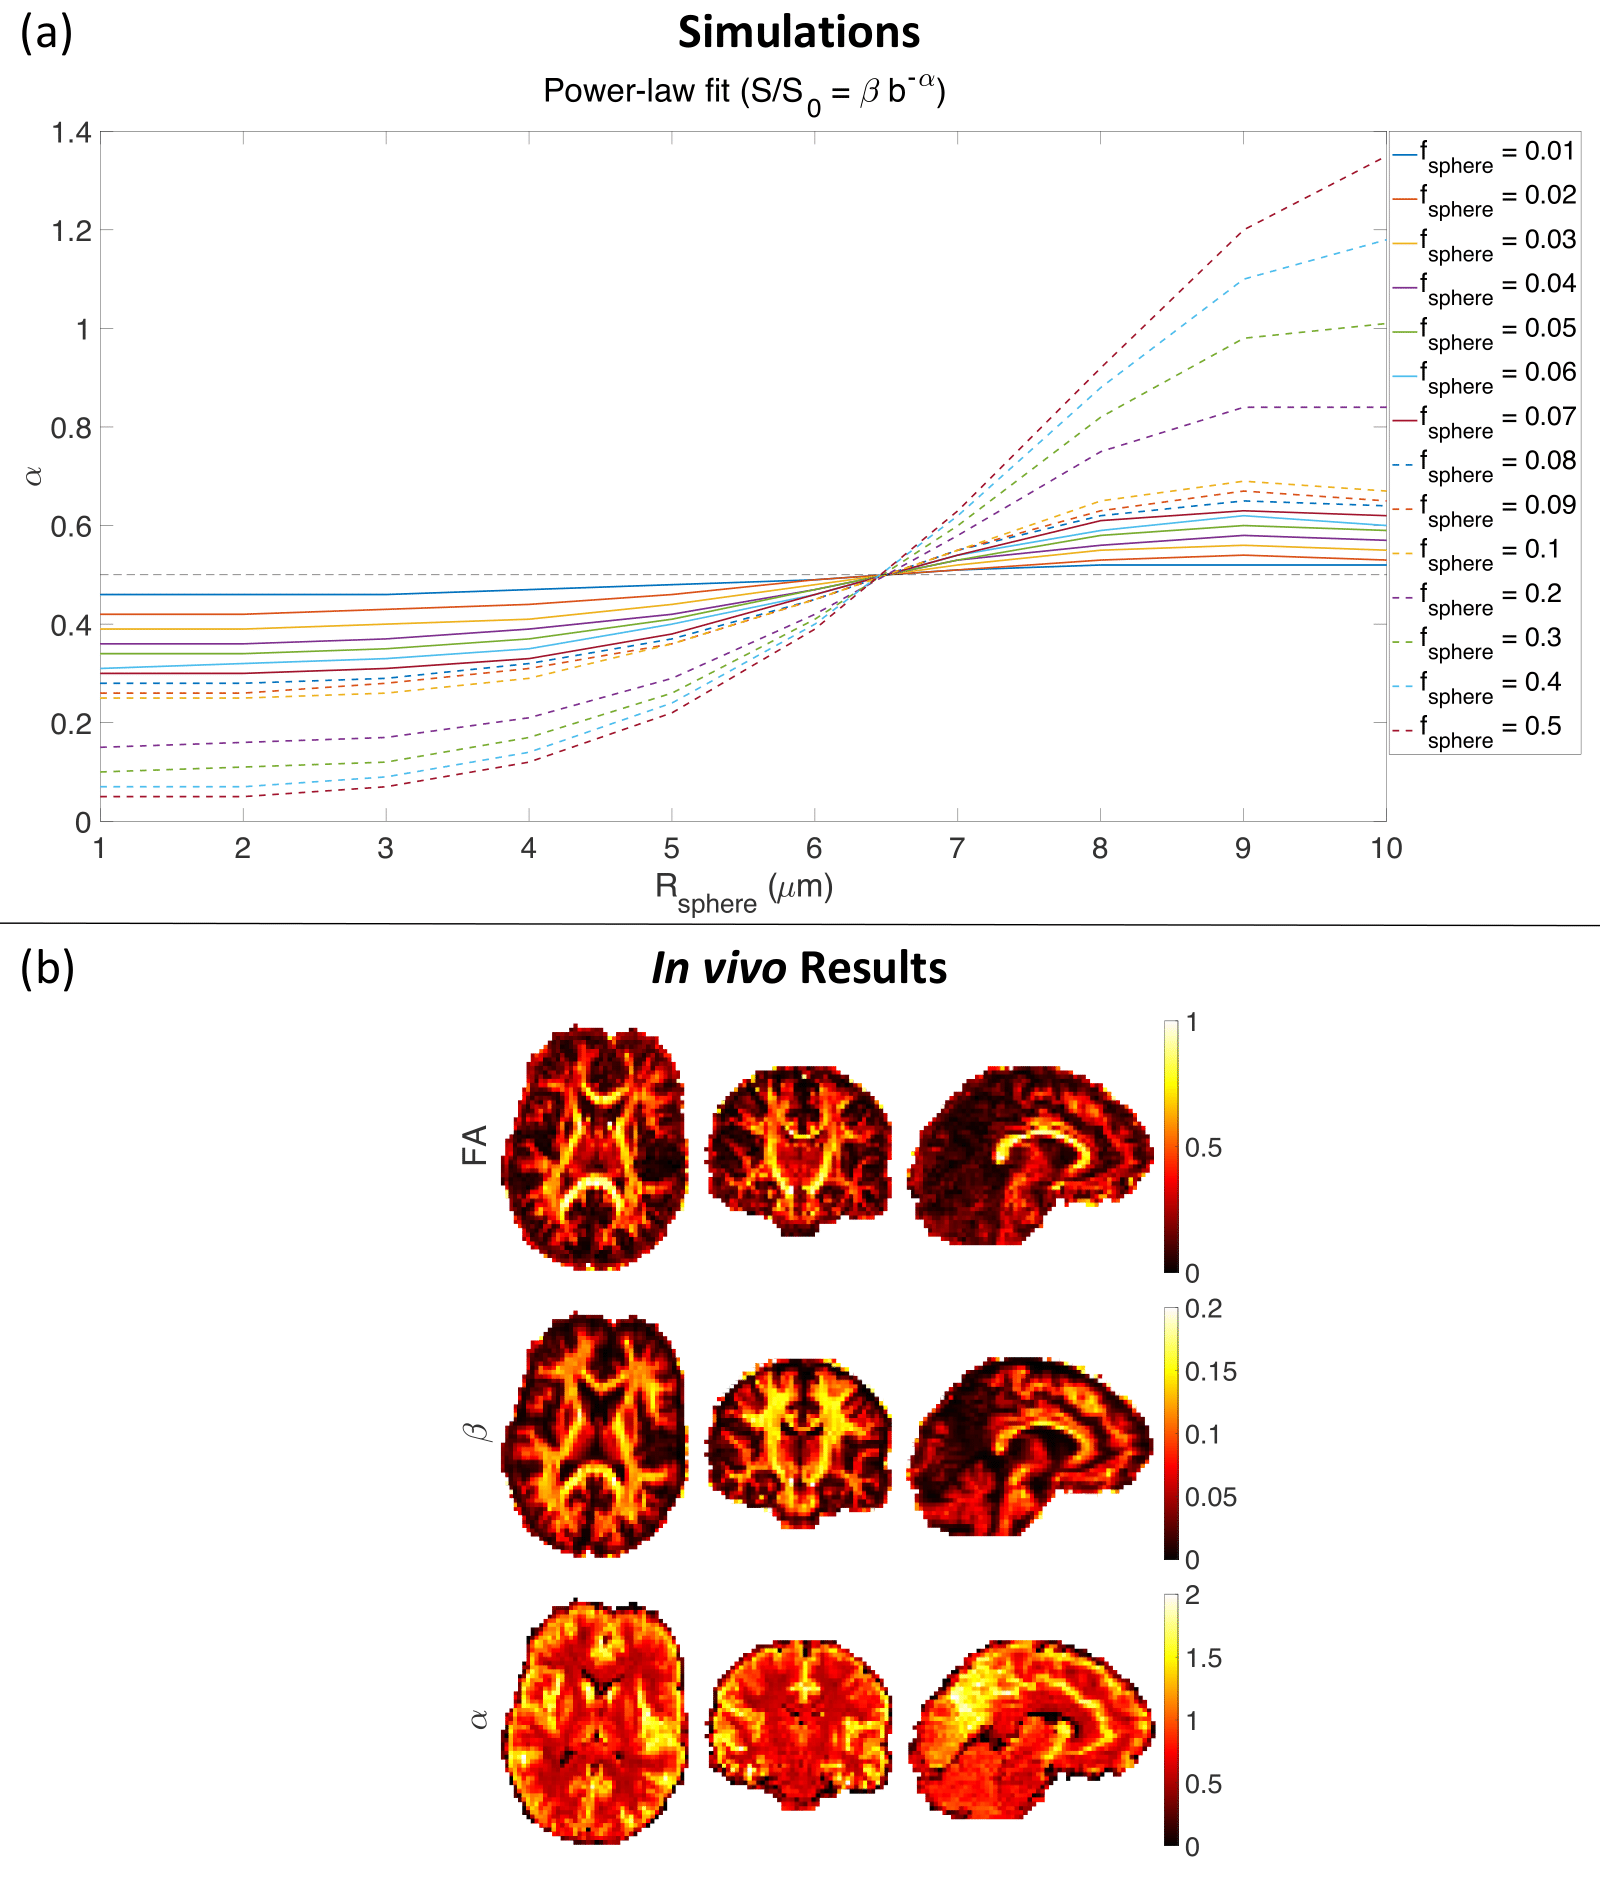
Fig . 5 (a) The effect of sphere size and signal fraction on exponent α (similar to Fig. 2 in 10). ($$$f_{\rm{sphere}} = 0.01:0.01:0.1,\,0.2:0.1:0.5$$$, $$$f_{\rm{ball}} = f_{\rm{stick}} = (1 - f_{\rm{sphere}})/2$$$, $$$D_{\rm{in}}^{\mid\mid} = 2 \; \mu m^2/ms$$$, $$$D_{\rm{ball}} = 2 \; \mu m^2/ms$$$, $$$R_{\rm{sphere}} = 1:1:10 \; \mu m$$$, δ = 29.65 ms, and Δ = 37.05 ms). (b) Estimated FA, parameter β and α of the power-law fit ($$$S/S_0 = \beta b^{-\alpha}$$$) from axial, coronal, and sagittal views of the brain image.