0643
Power-law scaling of the diffusion signal in gray matter and the influence of exchange1Center of Functionally Integrative Neuroscience (CFIN) and MINDLab, Aarhus University, Aarhus, Denmark, 2Department of Physics and Astronomy, Aarhus University, Aarhus, Denmark, 3Champalimaud Research, Champalimaud Centre for the Unknown, Lisbon, Portugal
Synopsis
Diffusion models can be validated by observing their functional dependencies, exemplified by the b-1/2 power-law scaling recently used to validate the “stick” compartment in white matter. In contrast, such behavior has not been observed in grey matter (GM), potentially due to a) water exchange between dendrites and extra-neurite space and/or b) a distinct signal contribution from somas. We report the first observation of the stick power-law in GM at very large b-values consistent with b). Nevertheless, the dependence on diffusion time indicates significant water exchange affecting the scaling range. The combined observations thus offer a window into more complicated microstructure.
Introduction
Biophysical modeling of diffusion MRI promises specificity to tissue microstructural properties, but validation is challenging yet crucial1,2. A promising strategy involves identification of characteristic functional dependencies discriminating competing models, such as the signature $$$1/\sqrt{b}$$$ power-law decay of the powder averaged signal from zero radius cylinders at large b-values3. This behavior was recently observed in brain white matter (WM)3–5, providing strong support for a “stick” compartment, presumably axons, of highly anisotropic spaces with effectively zero radial diffusivity6,7. In contrast, the power-law was not observed in gray matter (GM)4,5, which has been attributed to a dominance of unmyelinated dendrites potentially exhibiting faster water exchange to the extra-neuronal space4. Recently, neuron somas have been suggested to necessitate a separate signal component8, which could obscure the power law. Indeed, recent simulations indicate the power law to persist in realistic neuron geometries, but only when the soma component is suppressed9 at sufficiently large b-values and short sequence timings.Here we set out to meet this requirement in an ex vivo rat brain by studying diffusion weighting and diffusion time dependence using powerful gradients. We confirm an apparent power-law in GM, supporting an approximate description of dendrites as sticks in this regime. At the same time, the observed diffusion time dependence indicates a significant exchange of water between intra- and extra-neuronal spaces. The combined observations are not quantitatively compatible with any of the suggested explanations, indicating a more complicated microstructure.
Methods
For data interpretation, we employ the SANDI model8 and a two-component exchange model, which we refer to as the Kärger SM (Standard Model). SANDI consists of three compartments representing neurites (sticks), extra-cellular water (isotropic Gaussian), and somas (isotropic Gaussian). In the Kärger SM the somas are removed and exchange between the neurite and extra-cellular compartments is introduced. The exchange is implemented with the Kärger model10 generalized to finite pulse widths11. Specifically, the signal $$$A(b,\delta,\Delta,\hat{n}\cdot\hat{g})$$$ for a given stick orientation $$$\hat{n}$$$ relative to the gradient $$$\hat{g}$$$ is given by numerically integrating the generalized rate equations. The powder averaged signal is obtained using Gauss-Legendre quadrature with respect to $$$\varepsilon\equiv\hat{n}\cdot\hat{g}$$$.Model parameters are estimated by least-squares-fitting with 1000 random initializations. These fits include a signal offset since this has generally been reported for ex vivo data12,13.
Data
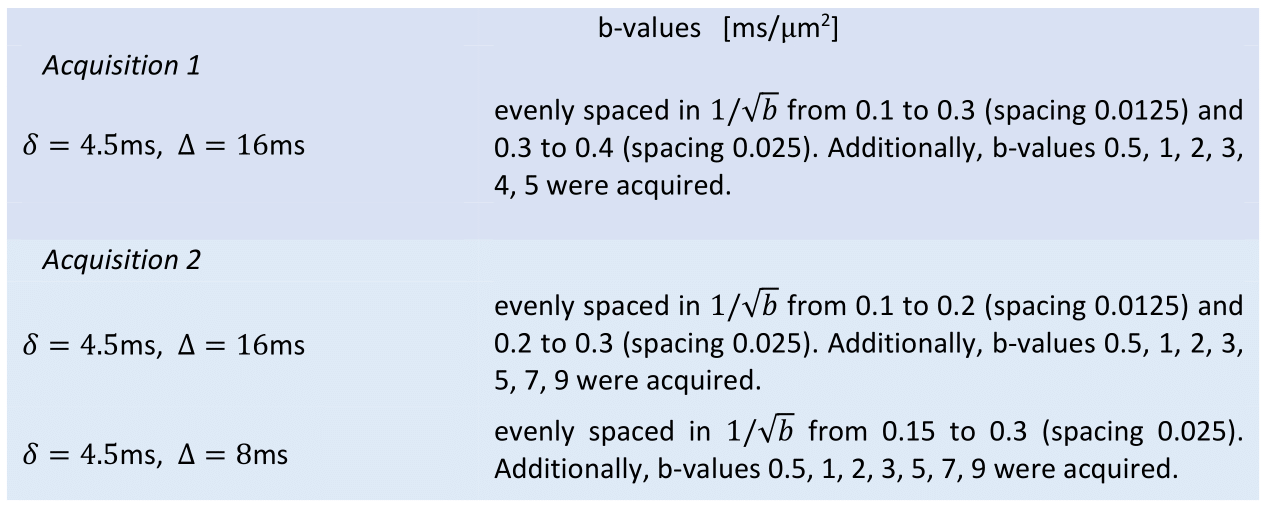
Animal experiments were preapproved by the competent institutional and national authorities (European Directive 2010/63). Rat brain specimens were transcardially perfused, immersed in 4% Paraformaldehyde (PFA) solution (24h), and washed in Phosphate-Buffered Saline (PBS) solution (48h). A hemisphere was isolated and placed in a 5mm NMR tube with Fluorinert kept at 37°C and scanned using a 16.4T Bruker Aeon scanner with a Micro5 probe (producing gradients up to 3000mT/m). Diffusion data was recorded with thirty directions, resolution=138x138x1000μm3, and TR/TE=4000/30ms. This was done for N=2 rats with b-values and pulse timings given in Table 1. Data was denoised14 and corrected for Rician bias15 and drift16.
Results
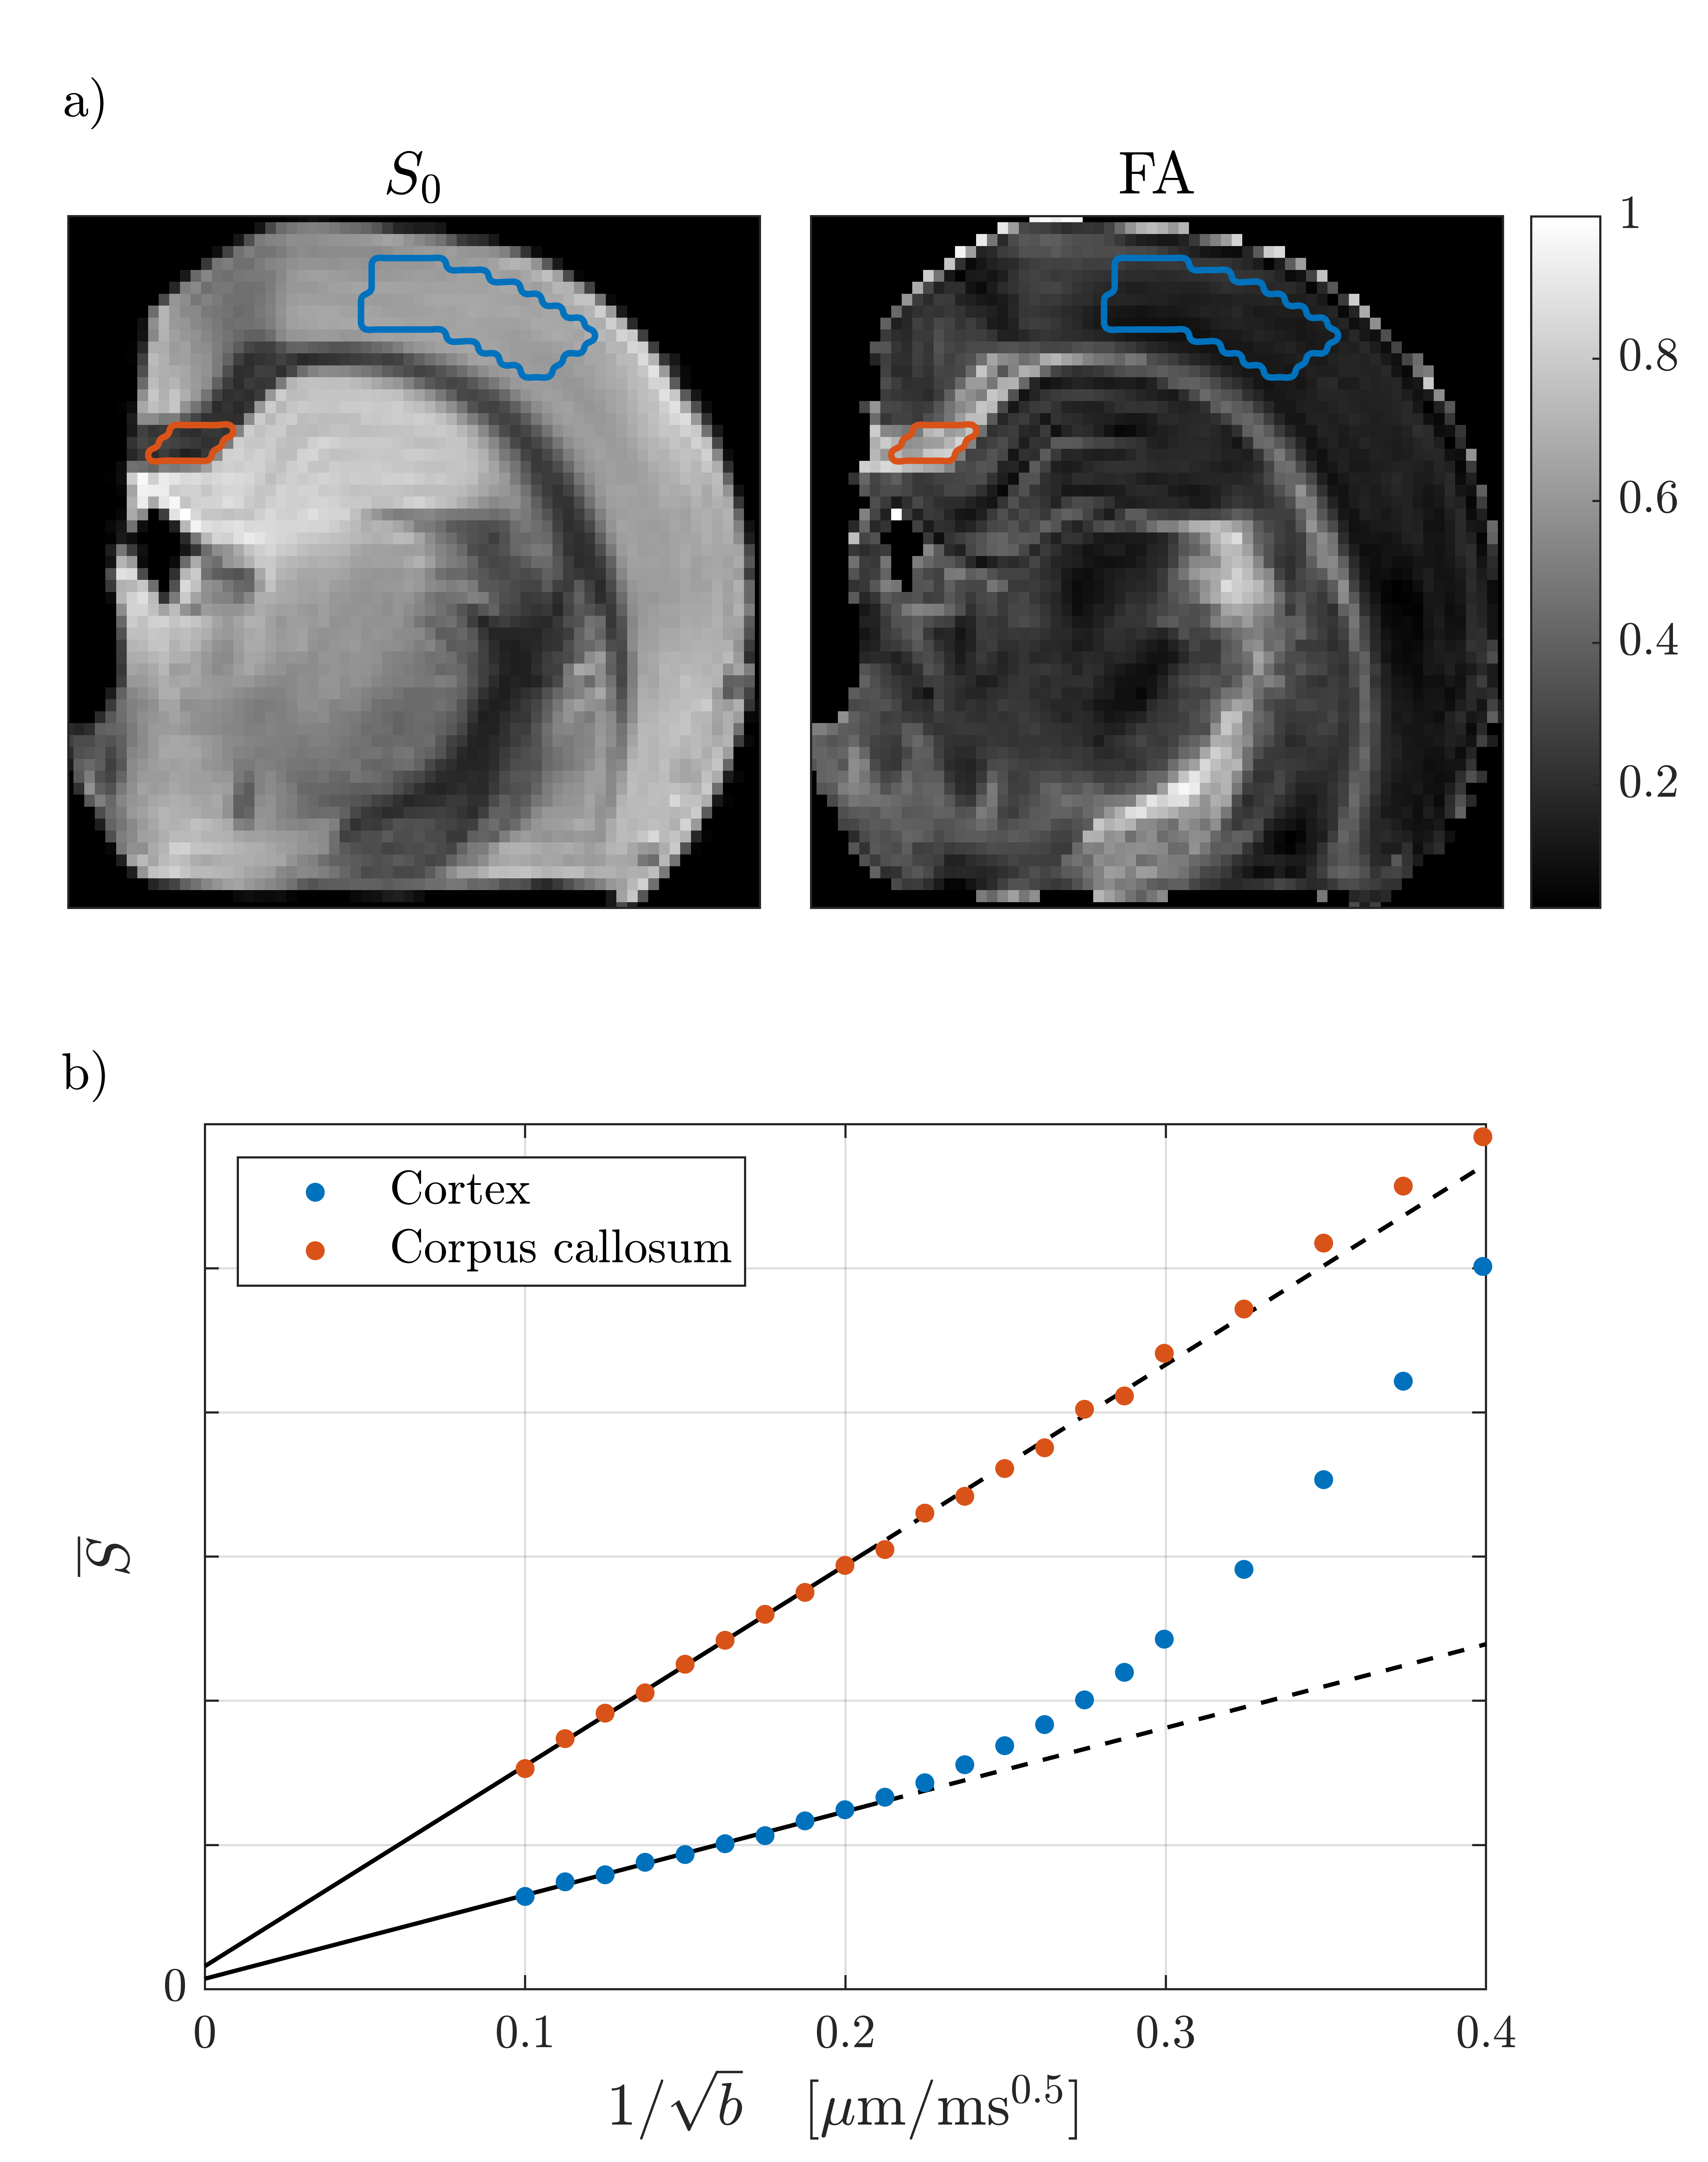
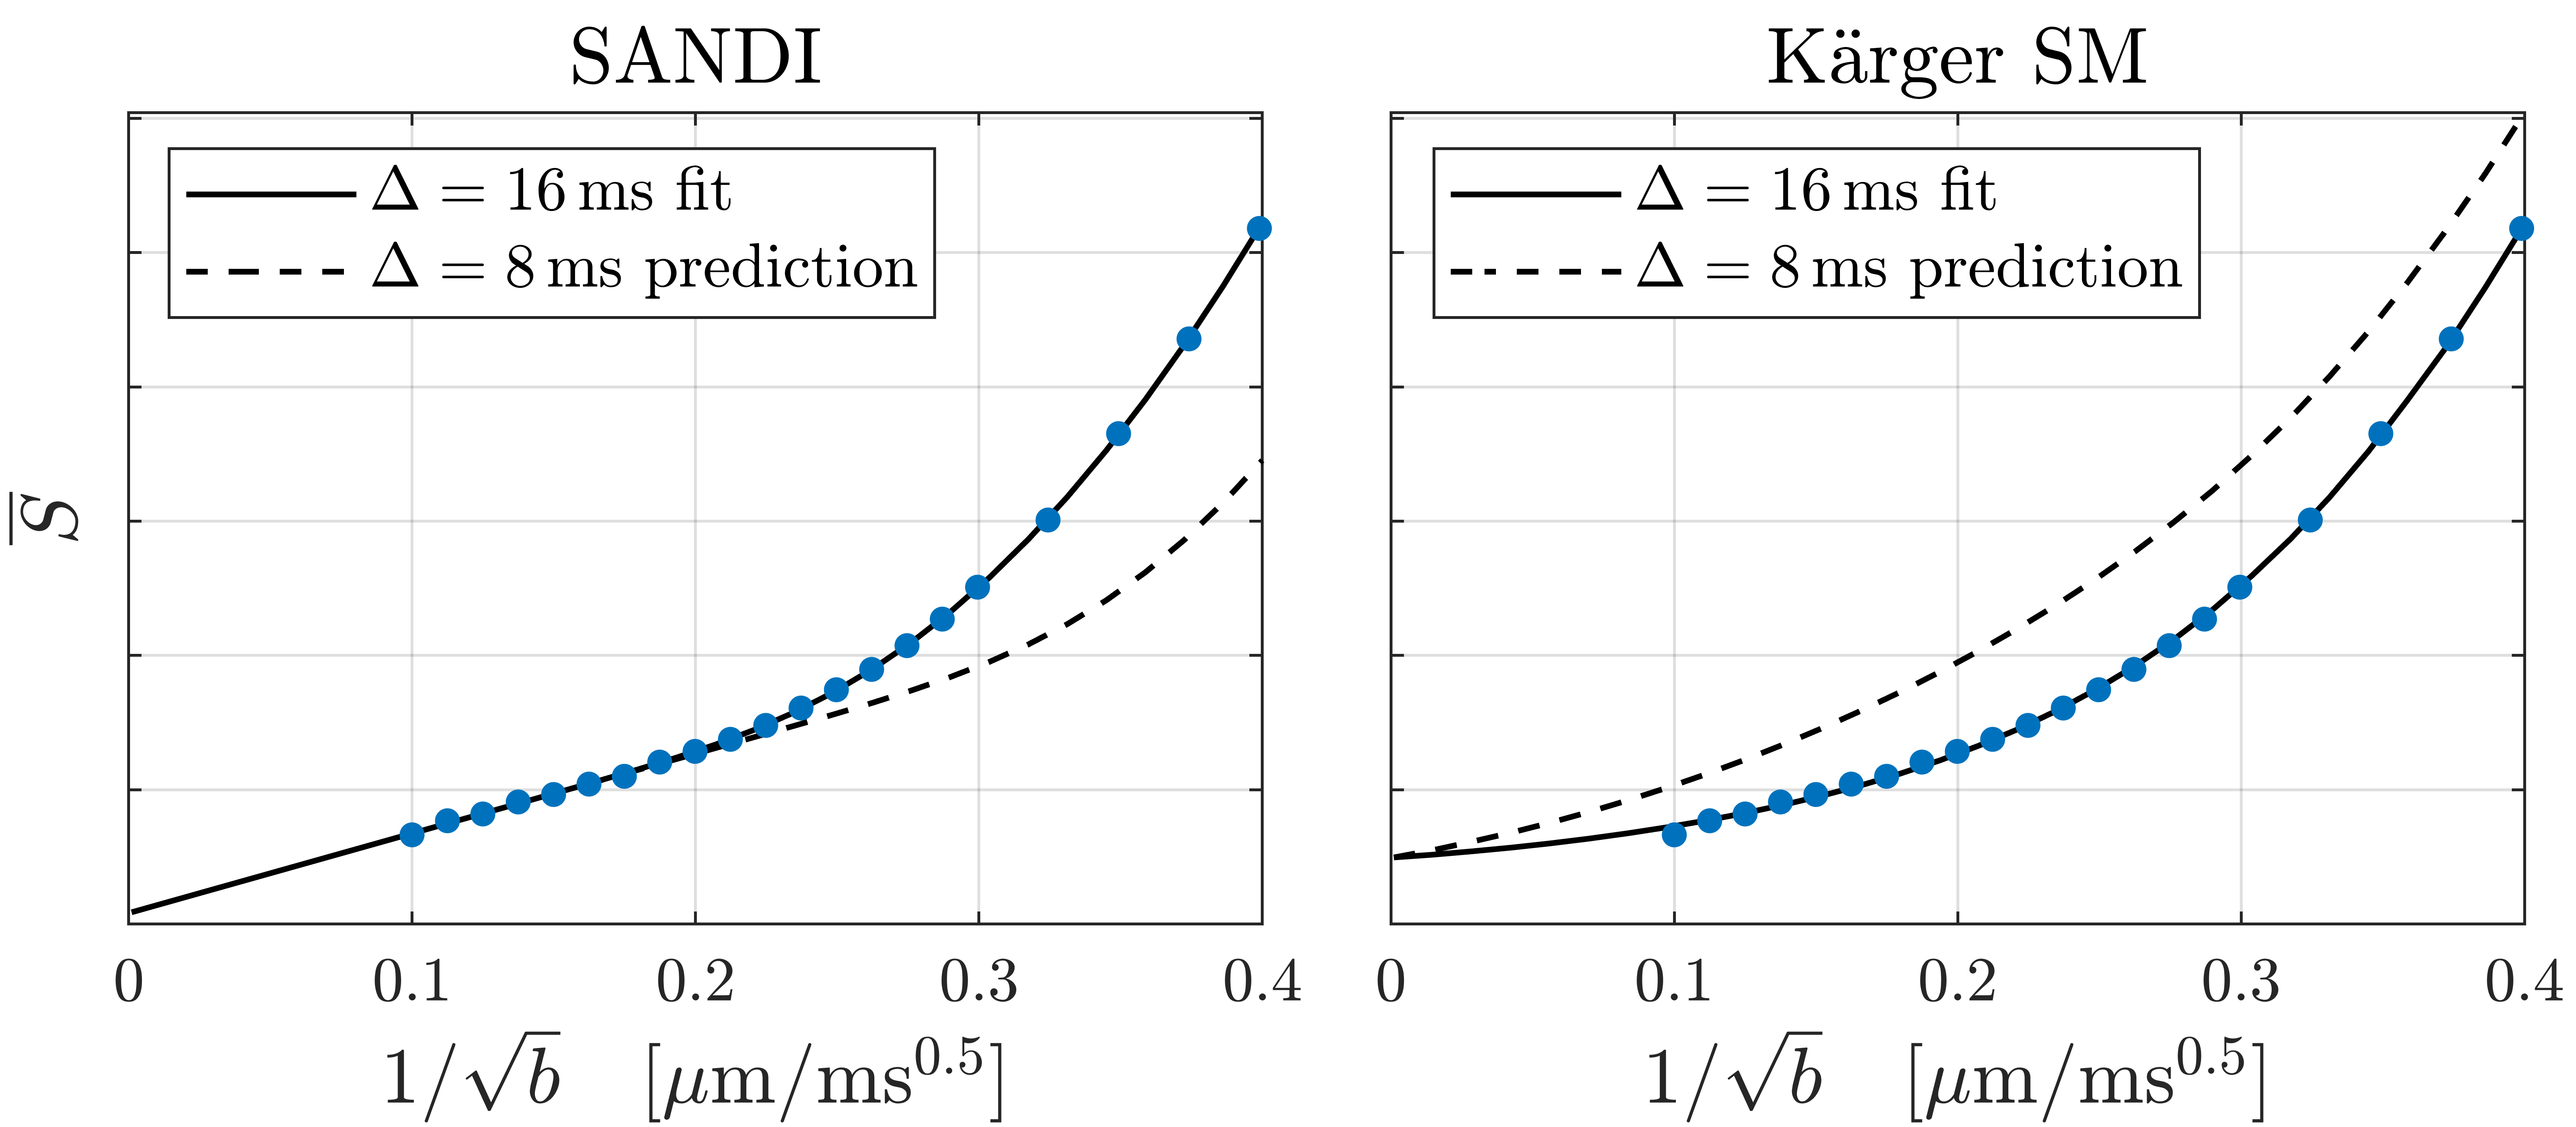
WM (corpus callosum) and GM (cortex) signals are shown as a function of $$$1/\sqrt{b}$$$ in Fig. 1. We reproduce linear dependence on $$$1/\sqrt{b}$$$ over the entire shown range for WM, and report for the first time a linear behavior also for GM above b=25ms/µm2 (b-1/2≤0.2µm/ms1/2). This is consistent with neurites exhibiting stick power-law scaling obscured by the soma contribution at smaller b-values. Accordingly, SANDI provides a good description of the data from acquisition 1 as shown in Fig. 2. In comparison, the Kärger SM produces a qualitatively reasonable fit, albeit with a significantly worse Bayesian information criterion ( ΔBIC>10)17,18.To discriminate further between the two signal descriptions, we illustrate in Fig. 2 opposite predicted behaviors of SANDI and the Kärger SM as function of diffusion time: the Gaussian compartment signals exp(-bD(t)) increase as function of t, since D(t) decreases, while the Kärger model behaves oppositely as can be shown analytically for the solvable case of narrow pulses. In Fig. 3, we show that the signal from acquisition 2 decreases as a function of diffusion time at fixed b-value, qualitatively supporting the Kärger SM picture. SANDI and the corresponding view of the microstructure is thus not compatible with the present data obtained in acquisition 2.
Although Fig. 3 shows that the Kärger SM reproduces the correct overall time dependence of the data, it fails to capture the curve shapes for the individual sequence timings. A minimal modification, which remedies this, is the addition of a sub-population of non-exchanging neurites. As shown in Fig. 3, this enables the model to account very well for the data features. In both cases, the estimated exchange rates are much faster than previously estimated19–21.
Conclusion
We report the first observation of power-law scaling of the diffusion signal in GM at large b-values. We characterized its behavior as function of diffusion time, and found water exchange, rather than soma, to be a dominant mechanism. Nevertheless, the employed model yielded much faster exchange rates than previously observed. While this cannot be excluded (and may possibly be due to fixation), it is likely that better biophysical models are needed. Similarly, neuronal somas are an expected component of a full description of the diffusion signal, due to their considerable volume fraction in GM.Acknowledgements
We thank Beatriz Cardoso for extracting and preparing the scanned specimens.
SJ and JO are supported by the Danish National Research Foundation (CFIN), and the Danish Ministry of Science, Innovation, and Education (MINDLab). Additionally, JO is supported by the VELUX Foundation (ARCADIA, grant no. 00015963). NS was supported in part by the European Research Council (ERC) (agreement No. 679058). The authors acknowledge the vivarium of the Champalimaud Centre for the Unknown, a facility of CONGENTO which is a research infrastructure co-financed by Lisboa Regional Operational Programme (Lisboa 2020), under the PORTUGAL 2020 Partnership Agreement through the European Regional Development Fund (ERDF) and Fundação para a Ciência e Tecnologia (Portugal), project LISBOA-01-0145-FEDER-022170.
References
1. Novikov D, et al. On modeling. Magn. Reson. Med. 2018; 79.
2. Novikov D, et al. Quantifying brain microstructure with diffusion MRI: Theory and parameter estimation. NMR Biomed 2019; 32.
3. Veraart J, et al. On the scaling behavior of water diffusion in human brain white matter. Neuroimage 2019; 185.
4. Veraart J, et al. Noninvasive quantification of axon radii using diffusion MRI. Elife 2020; 9.
5. McKinnon E, et al. Dependence on b-value of the direction-averaged diffusion-weighted imaging signal in brain. Magn. Reson. Imaging 2017; 36.
6. Jespersen S, et al. Modeling dendrite density from magnetic resonance diffusion measurements. Neuroimage 2007; 34.
7. Kroenke C, et al. On the nature of the NAA diffusion attenuated MR signal in the central nervous system. Magn. Reson. Med. 52, 1052–1059 (2004).
8. Palombo M, et al. SANDI: A compartment-based model for non-invasive apparent soma and neurite imaging by diffusion MRI. Neuroimage 2020; 215.
9. Olesen J, et al. Stick power law scaling in neurons withstands realistic curvature and branching. in ISMRM, 2020.
10. Kärger J. NMR self-diffusion studies in heterogeneous systems. Adv. Colloid Interface Sci. 1985; 23.
11. Ning L, et al. Cumulant expansions for measuring water exchange using diffusion MRI. J. Chem. Phys. 2018; 148.
12. Stanisz G, et al. An analytical model of restricted diffusion in bovine optic nerve. Magn. Reson. Med. 1997; 37.
13. Alexander D, et al. Orientationally invariant indices of axon diameter and density from diffusion MRI. Neuroimage 2010; 52.
14. Veraart J, et al. Denoising of diffusion MRI using random matrix theory. Neuroimage 2016; 142.
15. Koay C, et al. Analytically exact correction scheme for signal extraction from noisy magnitude MR signals. J. Magn. Reson. 2006; 179.
16. Vos S, et al. The importance of correcting for signal drift in diffusion MRI. Magn. Reson. Med. 2017; 77.
17. Schwarz G. Estimating the Dimension of a Model. Ann. Stat. 1978; 6.
18. Kass R, et al. Bayes Factors. J. Am. Stat. Assoc. 1995; 90.
19. Yang D, et al. Intracellular water preexchange lifetime in neurons and astrocytes. Magn. Reson. Med. 2018; 79.
20. Nilsson M, et al. Noninvasive mapping of water diffusional exchange in the human brain using filter-exchange imaging. Magn. Reson. Med. 2013; 69.
21. Williamson N, et al. Magnetic resonance measurements of cellular and sub-cellular membrane structures in live and fixed neural tissue. Elife 2019; 8.
Figures