0637
Submillimeter Arterial Blood Contrast fMRI at 7T1Spinoza Center, Amsterdam, Netherlands, 2Maastricht University, Maastricht, Netherlands, 3Donders Institute for Brain, Cognition and Behaviour, Radboud University Nijmegen, Nijmegen, Netherlands, 4Erwin L. Hahn Institute for MRI, University of Duisburg-Essen, Essen, Germany
Synopsis
BOLD-fMRI has transformed human neuroscience, but is limited in its spatial specificity compared to cerebral blood-volume approaches. Arterial-Blood-Contrast was recently suggested as a cerebral-blood-volume method based on Magnetization transfer. Here, we apply Arterial-Blood-Contrast in the SAR-constrained 7T environment and examine its submillimeter usage. The results suggest good localization compared to BOLD and high-sensitivity.
Introduction
fMRI has transformed human neuroscience, by allowing the in-vivo exploration of the neural underpinnings of behavior1. In its typical implementation, fMRI uses gradient-echo T2*-weighted EPI, that is sensitive to the presence of deoxyhemoglobin in the venous blood, downstream of the neuronal activation2. This limits the spatial specificity of the BOLD signal and it constrains the exploration of the cortical layers, since they overlap with the similarly depth-dependent venous drainage3.Cerebral blood-volume (CBV-weighted) techniques colocalize better with neuronal activity4. Saturating the bound-pool that then transfers spin-coherence over magnetization-transfer (MT) to the free-water-pool may produce a CBV-weighted functional signal5,6, since MT is amplified in macromolecular-rich regions (e.g. brain tissue) compared to blood. An increase in blood-volume will therefore differentially increase the brain tissue signal, resulting in arterial-blood-contrast (ABC)7, though possible localization benefits have not been explored so far.
The RF-heavy MT is SAR-constrained at 7T, where the increased SNR allows sufficient spatial resolution to explore the cortical microstructure. Efficient saturation can be achieved with high-amplitude rectangular pulses on-resonance that preferentially saturate the macromolecular (short-T2) pool7. Still, the SAR-constraint at 7T necessitates either shorter saturation pulses or more time between successive saturations. Sparser saturations can easier accommodate high-resolution readouts and may retain MT-weighting at 7T due to the longer T1.
In this study, we examine the implementation of ABC in the SAR-constrained setting of 7T and explore if the functional responses are better localized compared to BOLD.
Methods
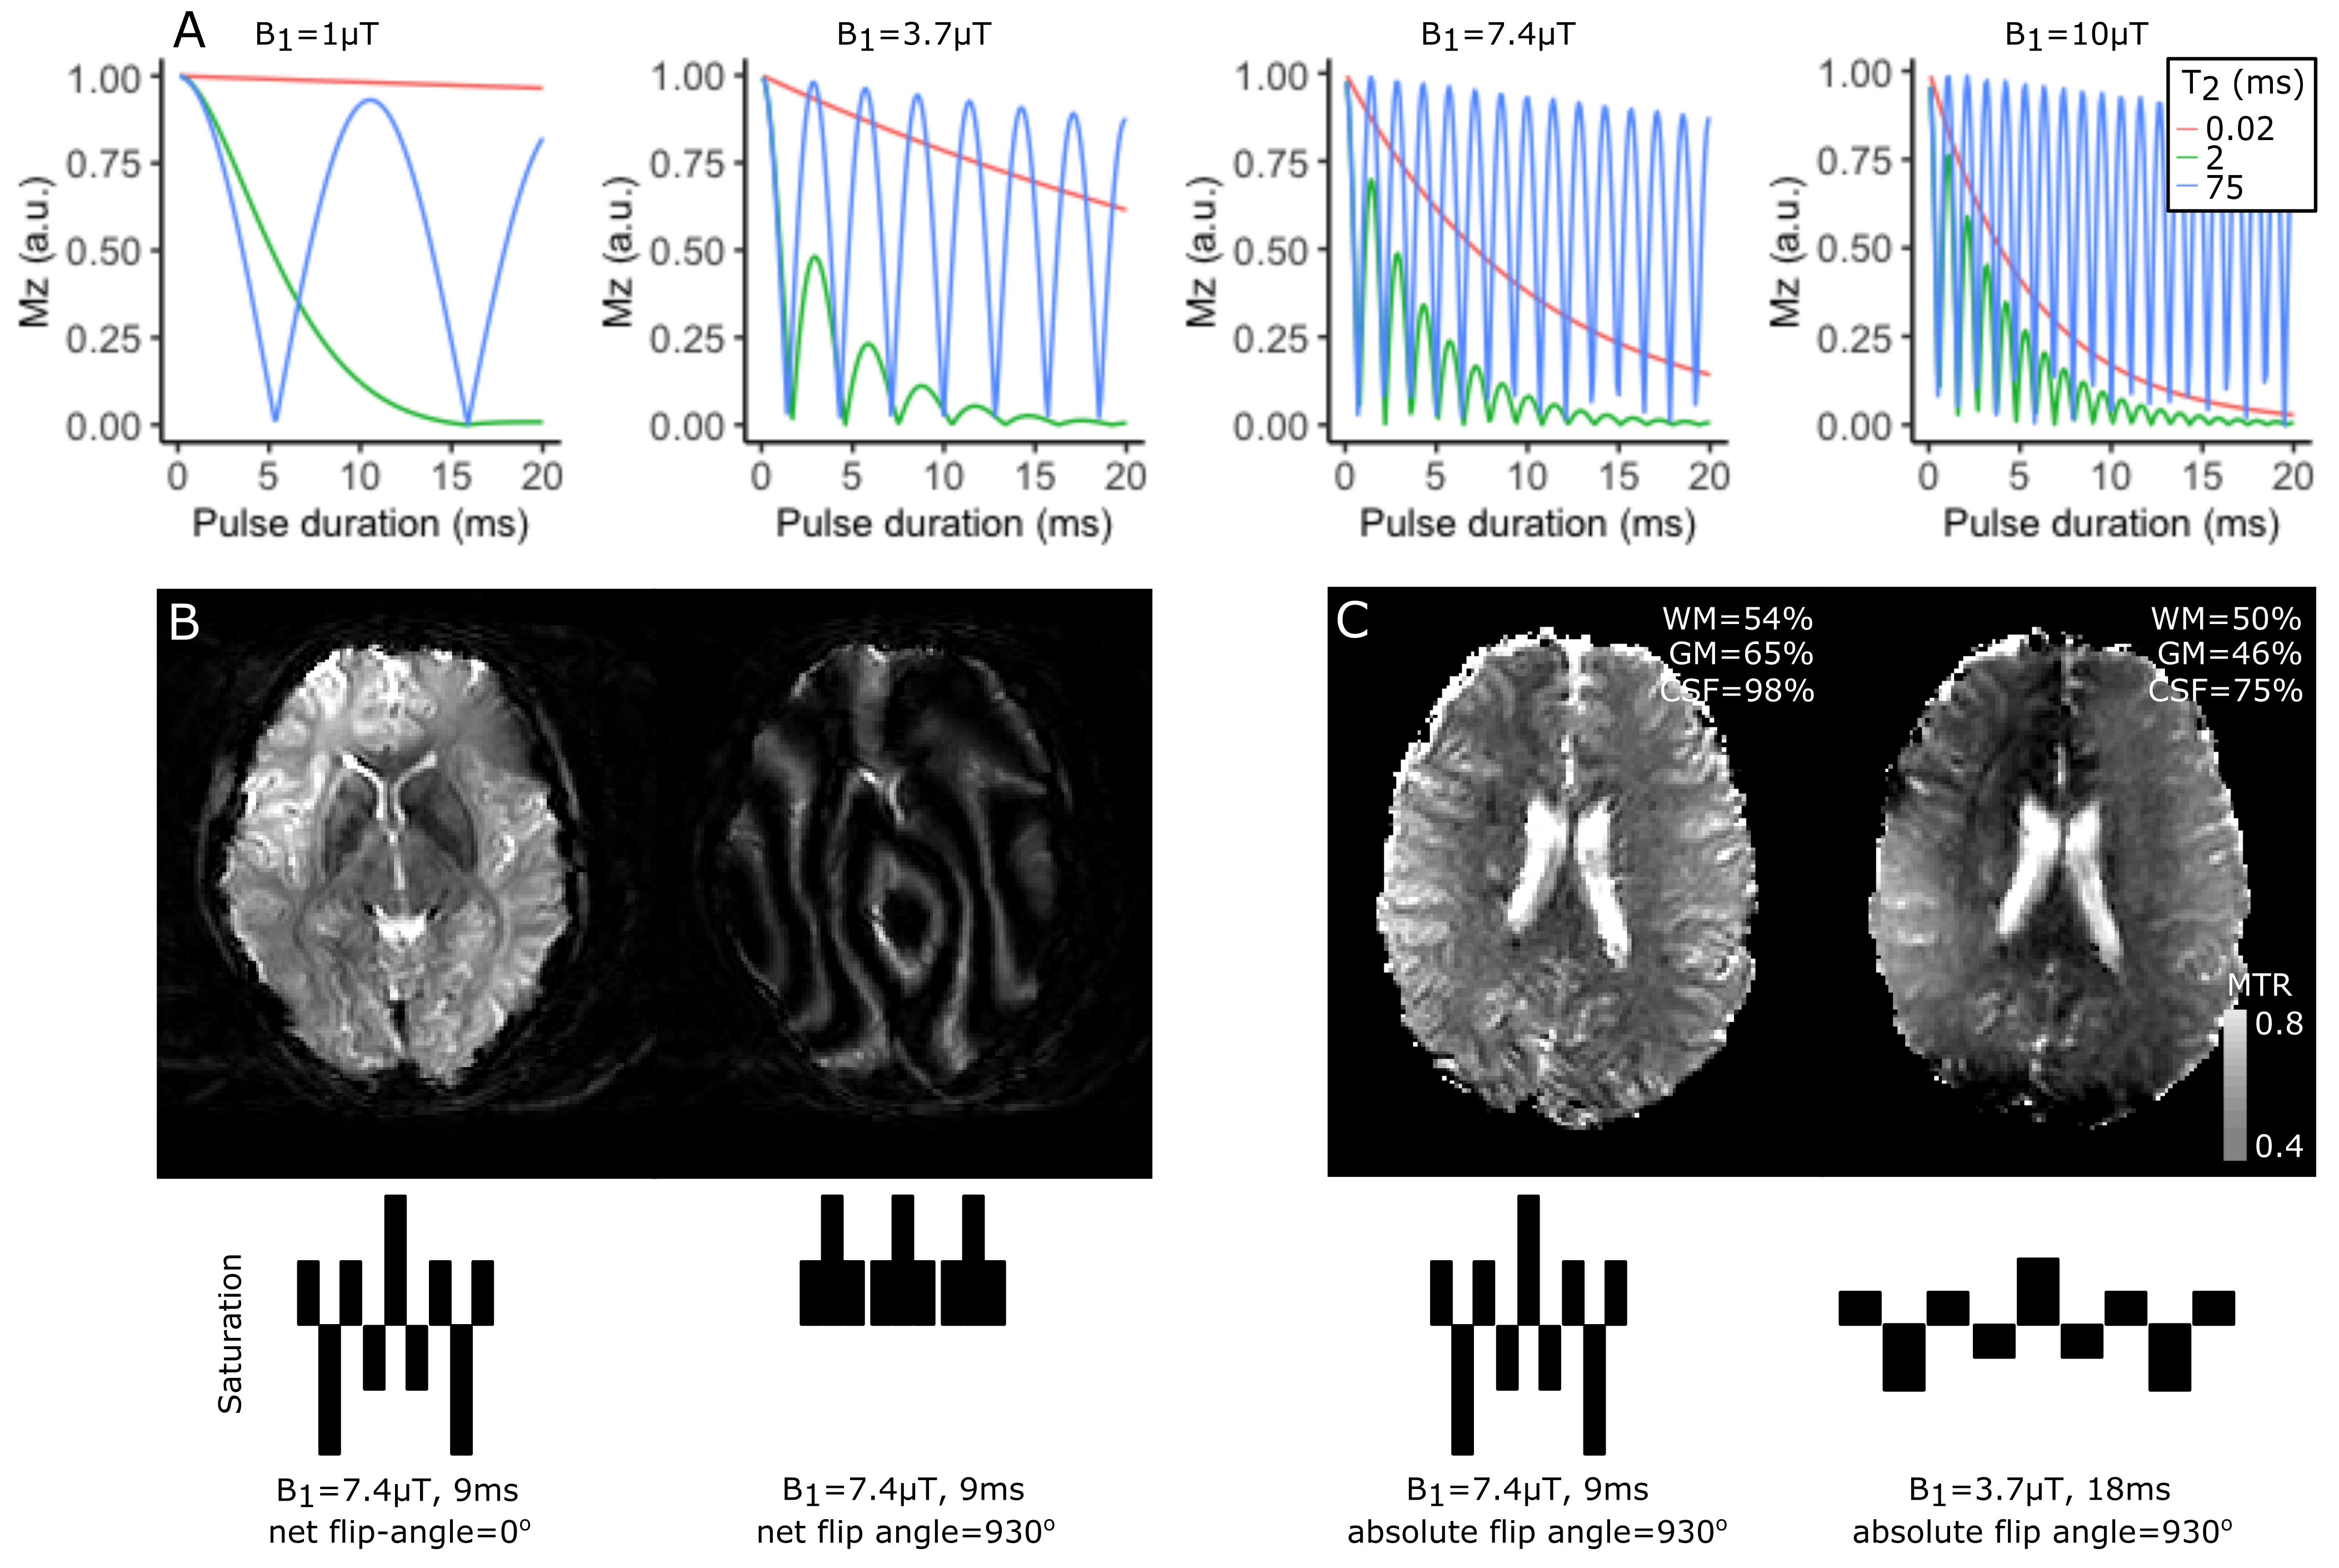
All four participants were scanned in a Philips Achieva 7T with a 2Tx/32Rx whole-head coil (Nova Medical). To acquire BOLD-and-ABC-weighted and BOLD-weighted images, a whole-brain Turbo-Flash EPI (TFEPI) was used (FOV=220x220x176mm3, voxel-size=1.8mm isotropic, TRvolume/TR/TE=3000ms/33ms/17ms, flip-angle=13o, SENSEy/z=2.1/2.5, partial-Fouriery/z=0.75), where saturation trains (or an equilength delay) can be placed every N excitations.A maximum-allowed B1 was empirically determined (7.2μT) and the bound- and free-pool saturation it produces were simulated through the Bloch equations8. MTR maps (MTR=MTon/MToff) at 7.2uT and 3.6uT B1, both |α|=930o) were acquired in one participant with a binomial, phase-modulated pulse.
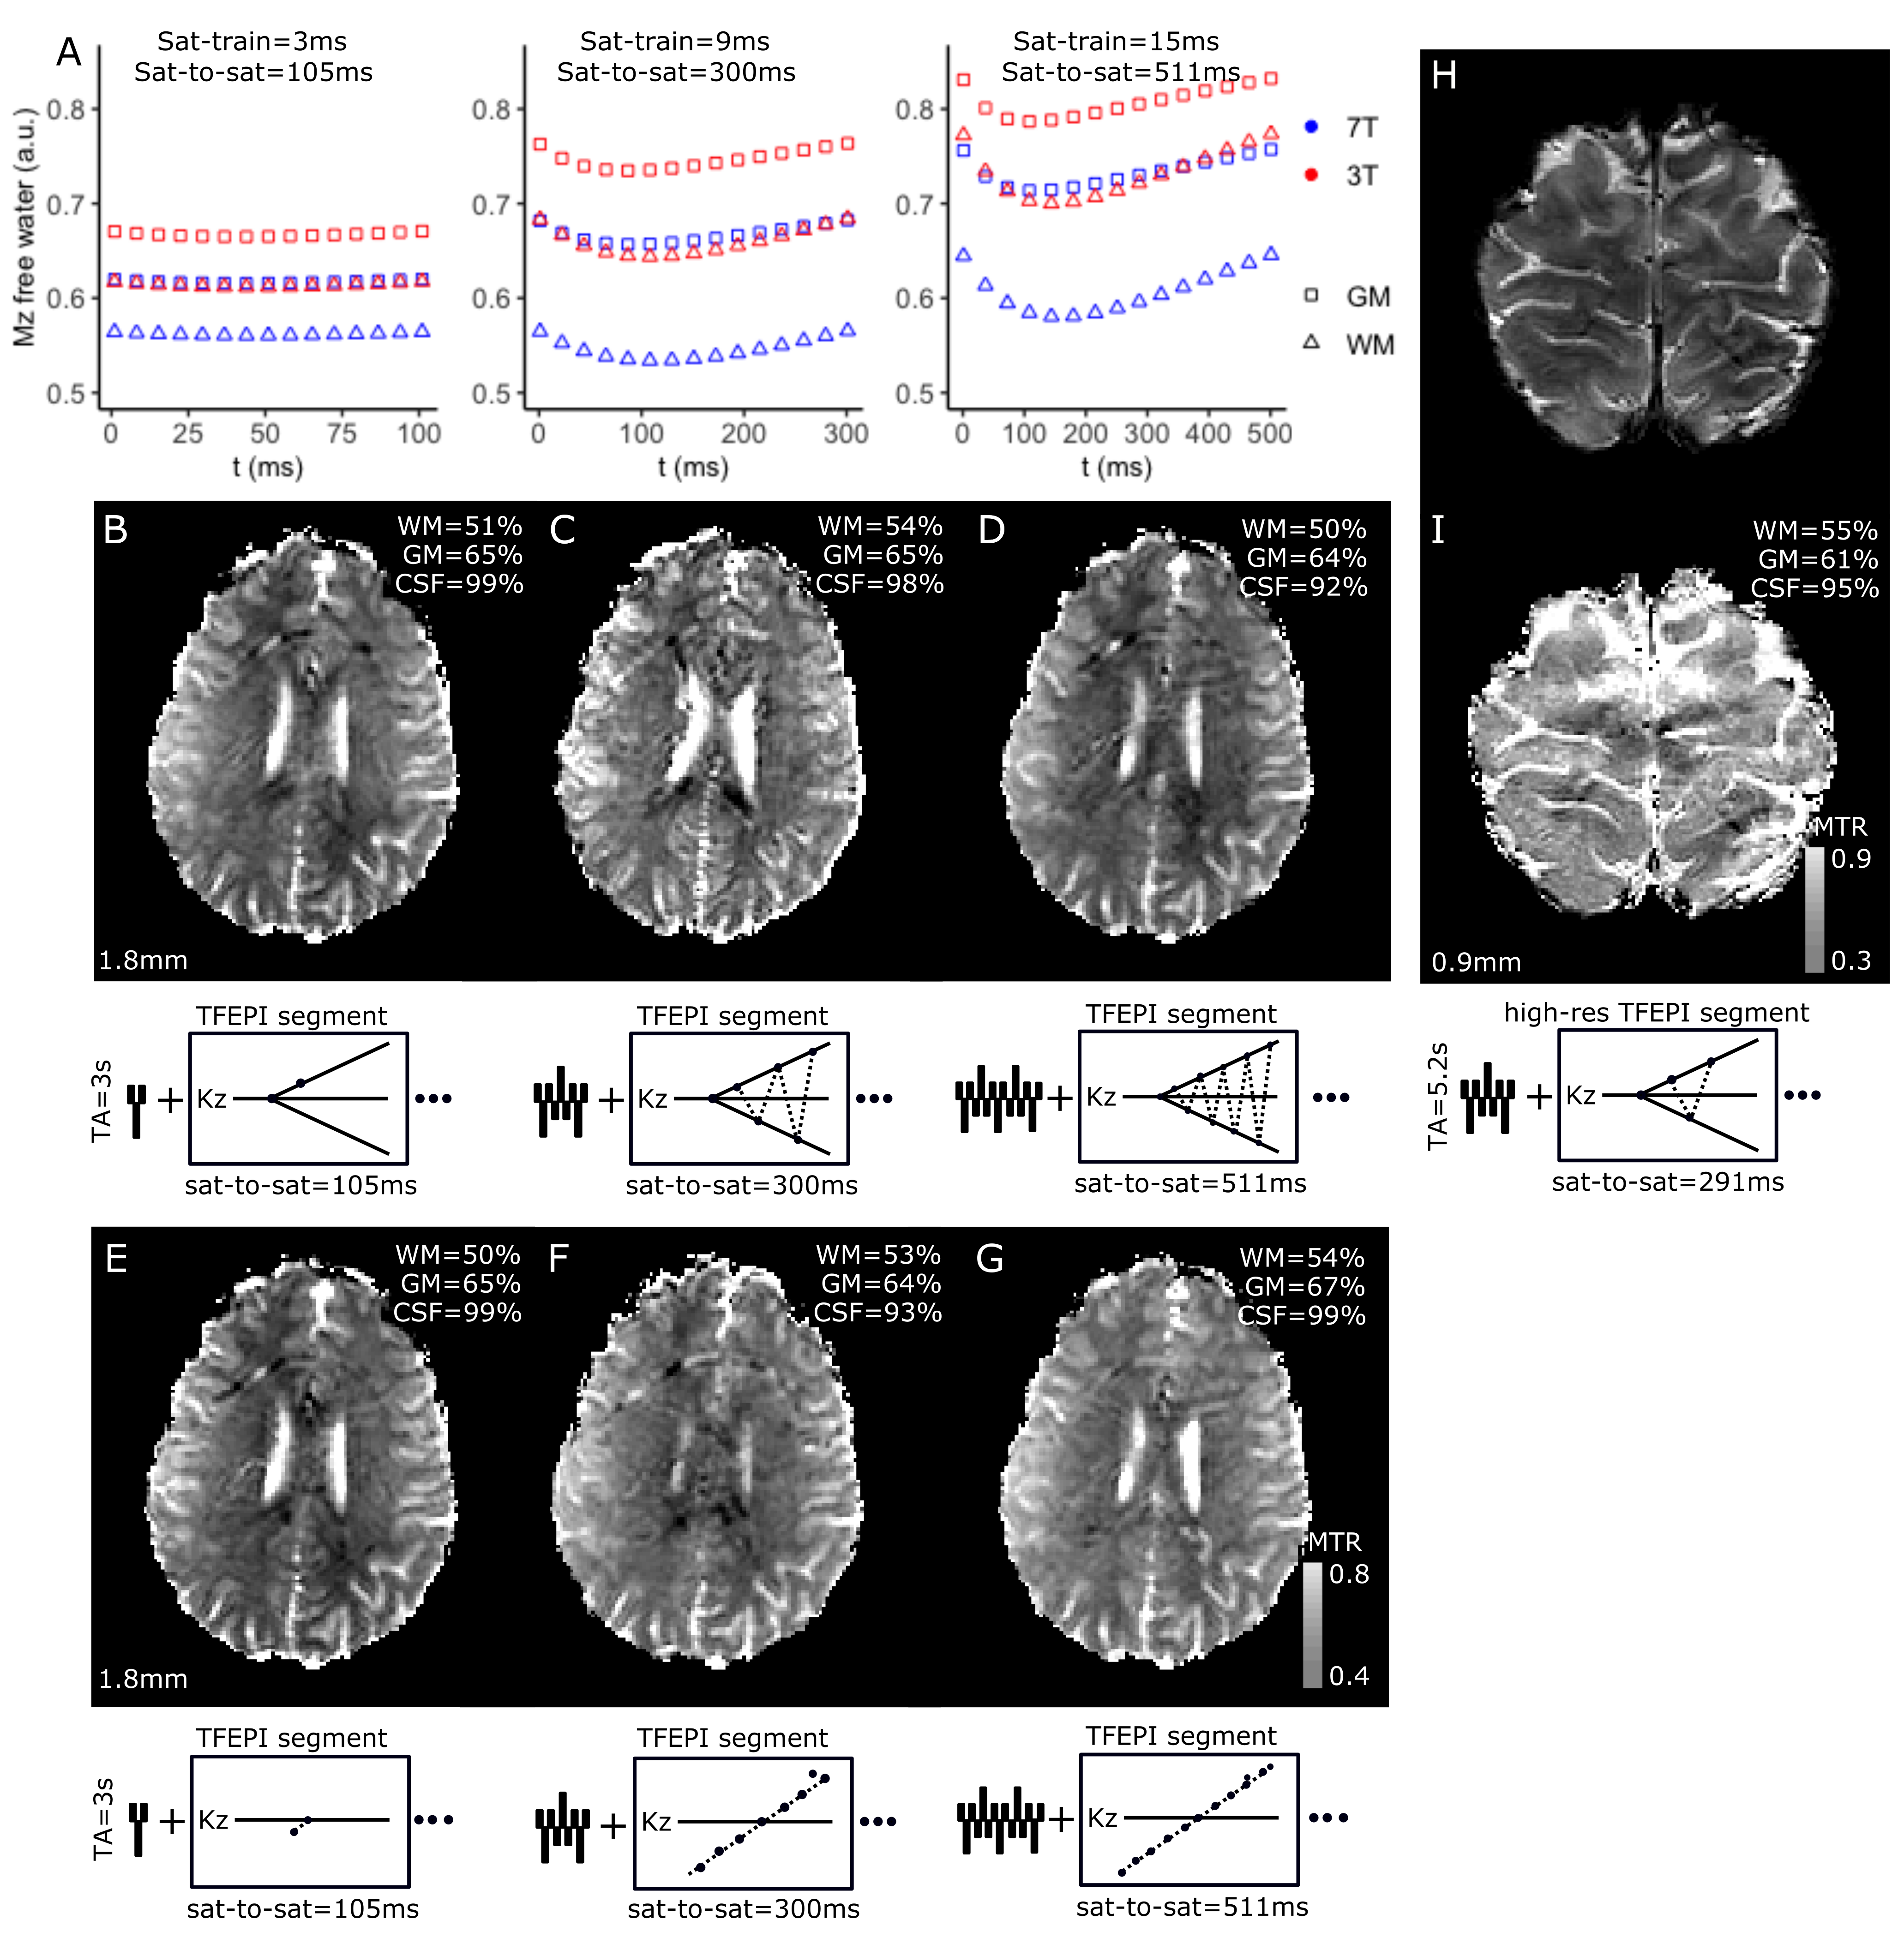
Three maximum-SAR saturation-durations/saturation-train-spacings combinations were empirically determined given B1=7.2μT and same TE/TR/TA. The Mzfree-water between saturations was simulated, for each saturation-duration/saturation-train-spacing combination with a biexponential MT model9, assuming previous estimates of T1bound/free for 3/7T10 and bound-to-free-protons-ratiogrey/white matter=10/25%. MTR maps were collected with both center-slice-out and linear schemes.
The participants performed a finger-tapping task (ON=13s/OFF=13s/task-duration=5min) with their left hand, while either the BOLD or BOLD-and-ABC-weighted TFEPI was acquired. Two participants performed two more runs with a submillimeter TFEPI (FOV=192x159x59mm3, voxel-size=0.9mm isotropic, TRvolume/TR/TE=5200ms/45ms/17ms, flip-angle=13o, SENSEy/z=3/1.4, partial-Fouriery/z=0.75). An MPRAGE (FOV=200x221x180mm3, voxel-size=0.9mm isotropic, TR/TE=150ms/3ms, flip-angle=7o, SENSEy/z=2/2.5, TI=1300ms) was also acquired.
The fMRI data were motion/distortion-corrected and a GLM (finger-tapping>rest) was fitted. The BOLD and BOLD-and-ABC data were projected to the middle space between them (FSL6.0.1). Layer profiles were extracted from activation ROIs (LAYNII).
Results
Our chosen B1 (7.4uT) is not likely to directly-saturate the long-T2 pool (Fig.1A), as confirmed experimentally (CSF in Fig.1C).The MT simulations show that, at 7T, sparser saturations with longer irradiation can retain MT-weighting at the same SAR, though a steady-state between successive saturations is not necessarily achieved (Fig.2A-C). These results were largely confirmed in-vivo, where the center-slice-out scheme was beneficial for the longer saturation-to-saturation times. Based on the scheme that maximized MT in the simulation, we opted for saturation-duration=9ms and saturation-to-saturation=300ms for both task protocols (Fig.2C,H).
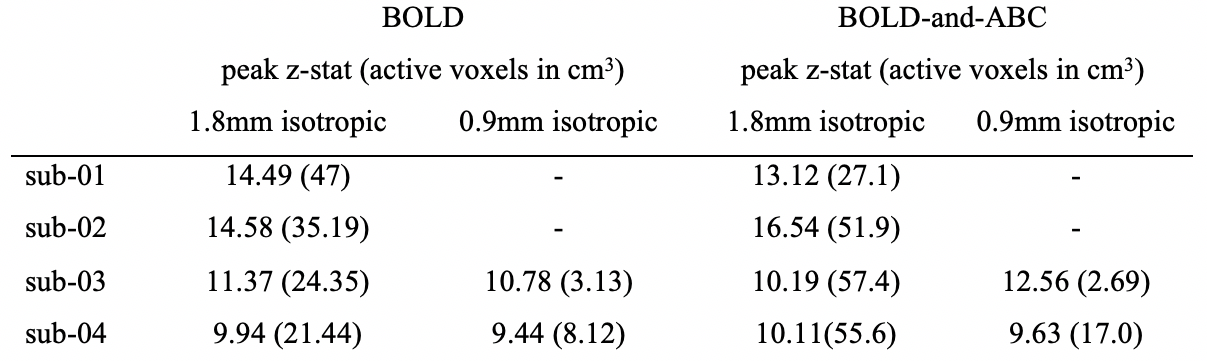
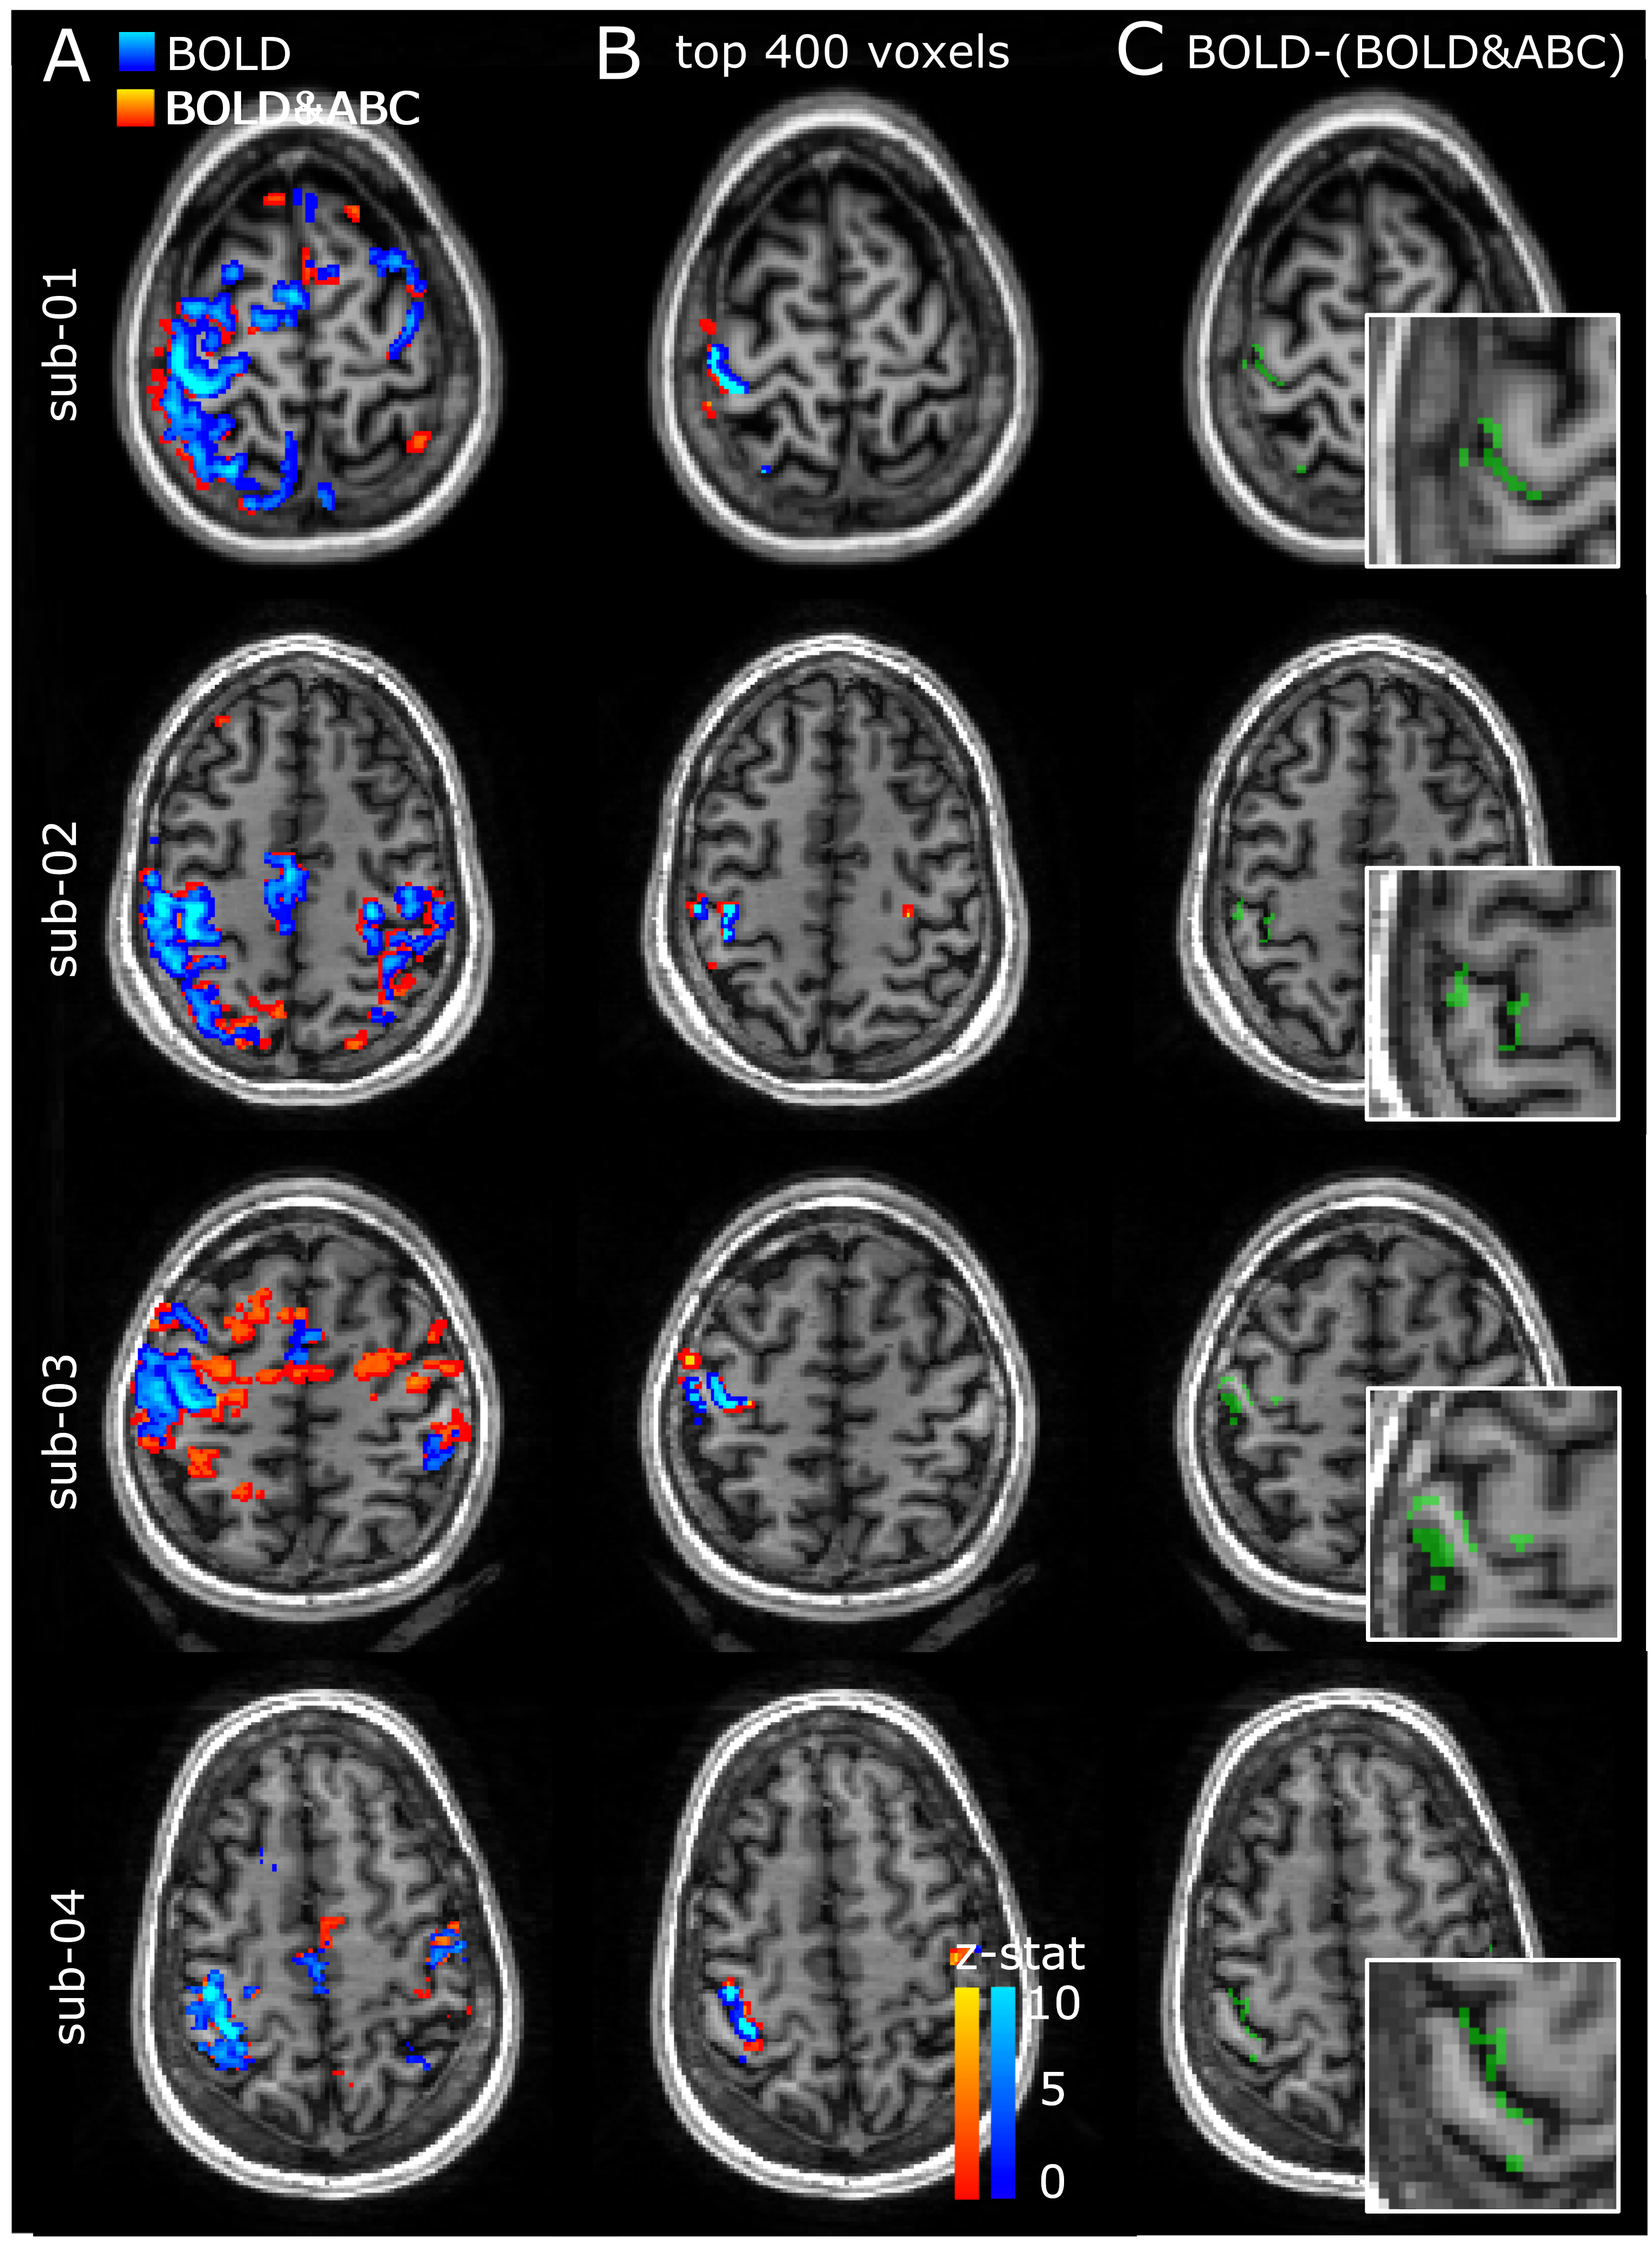
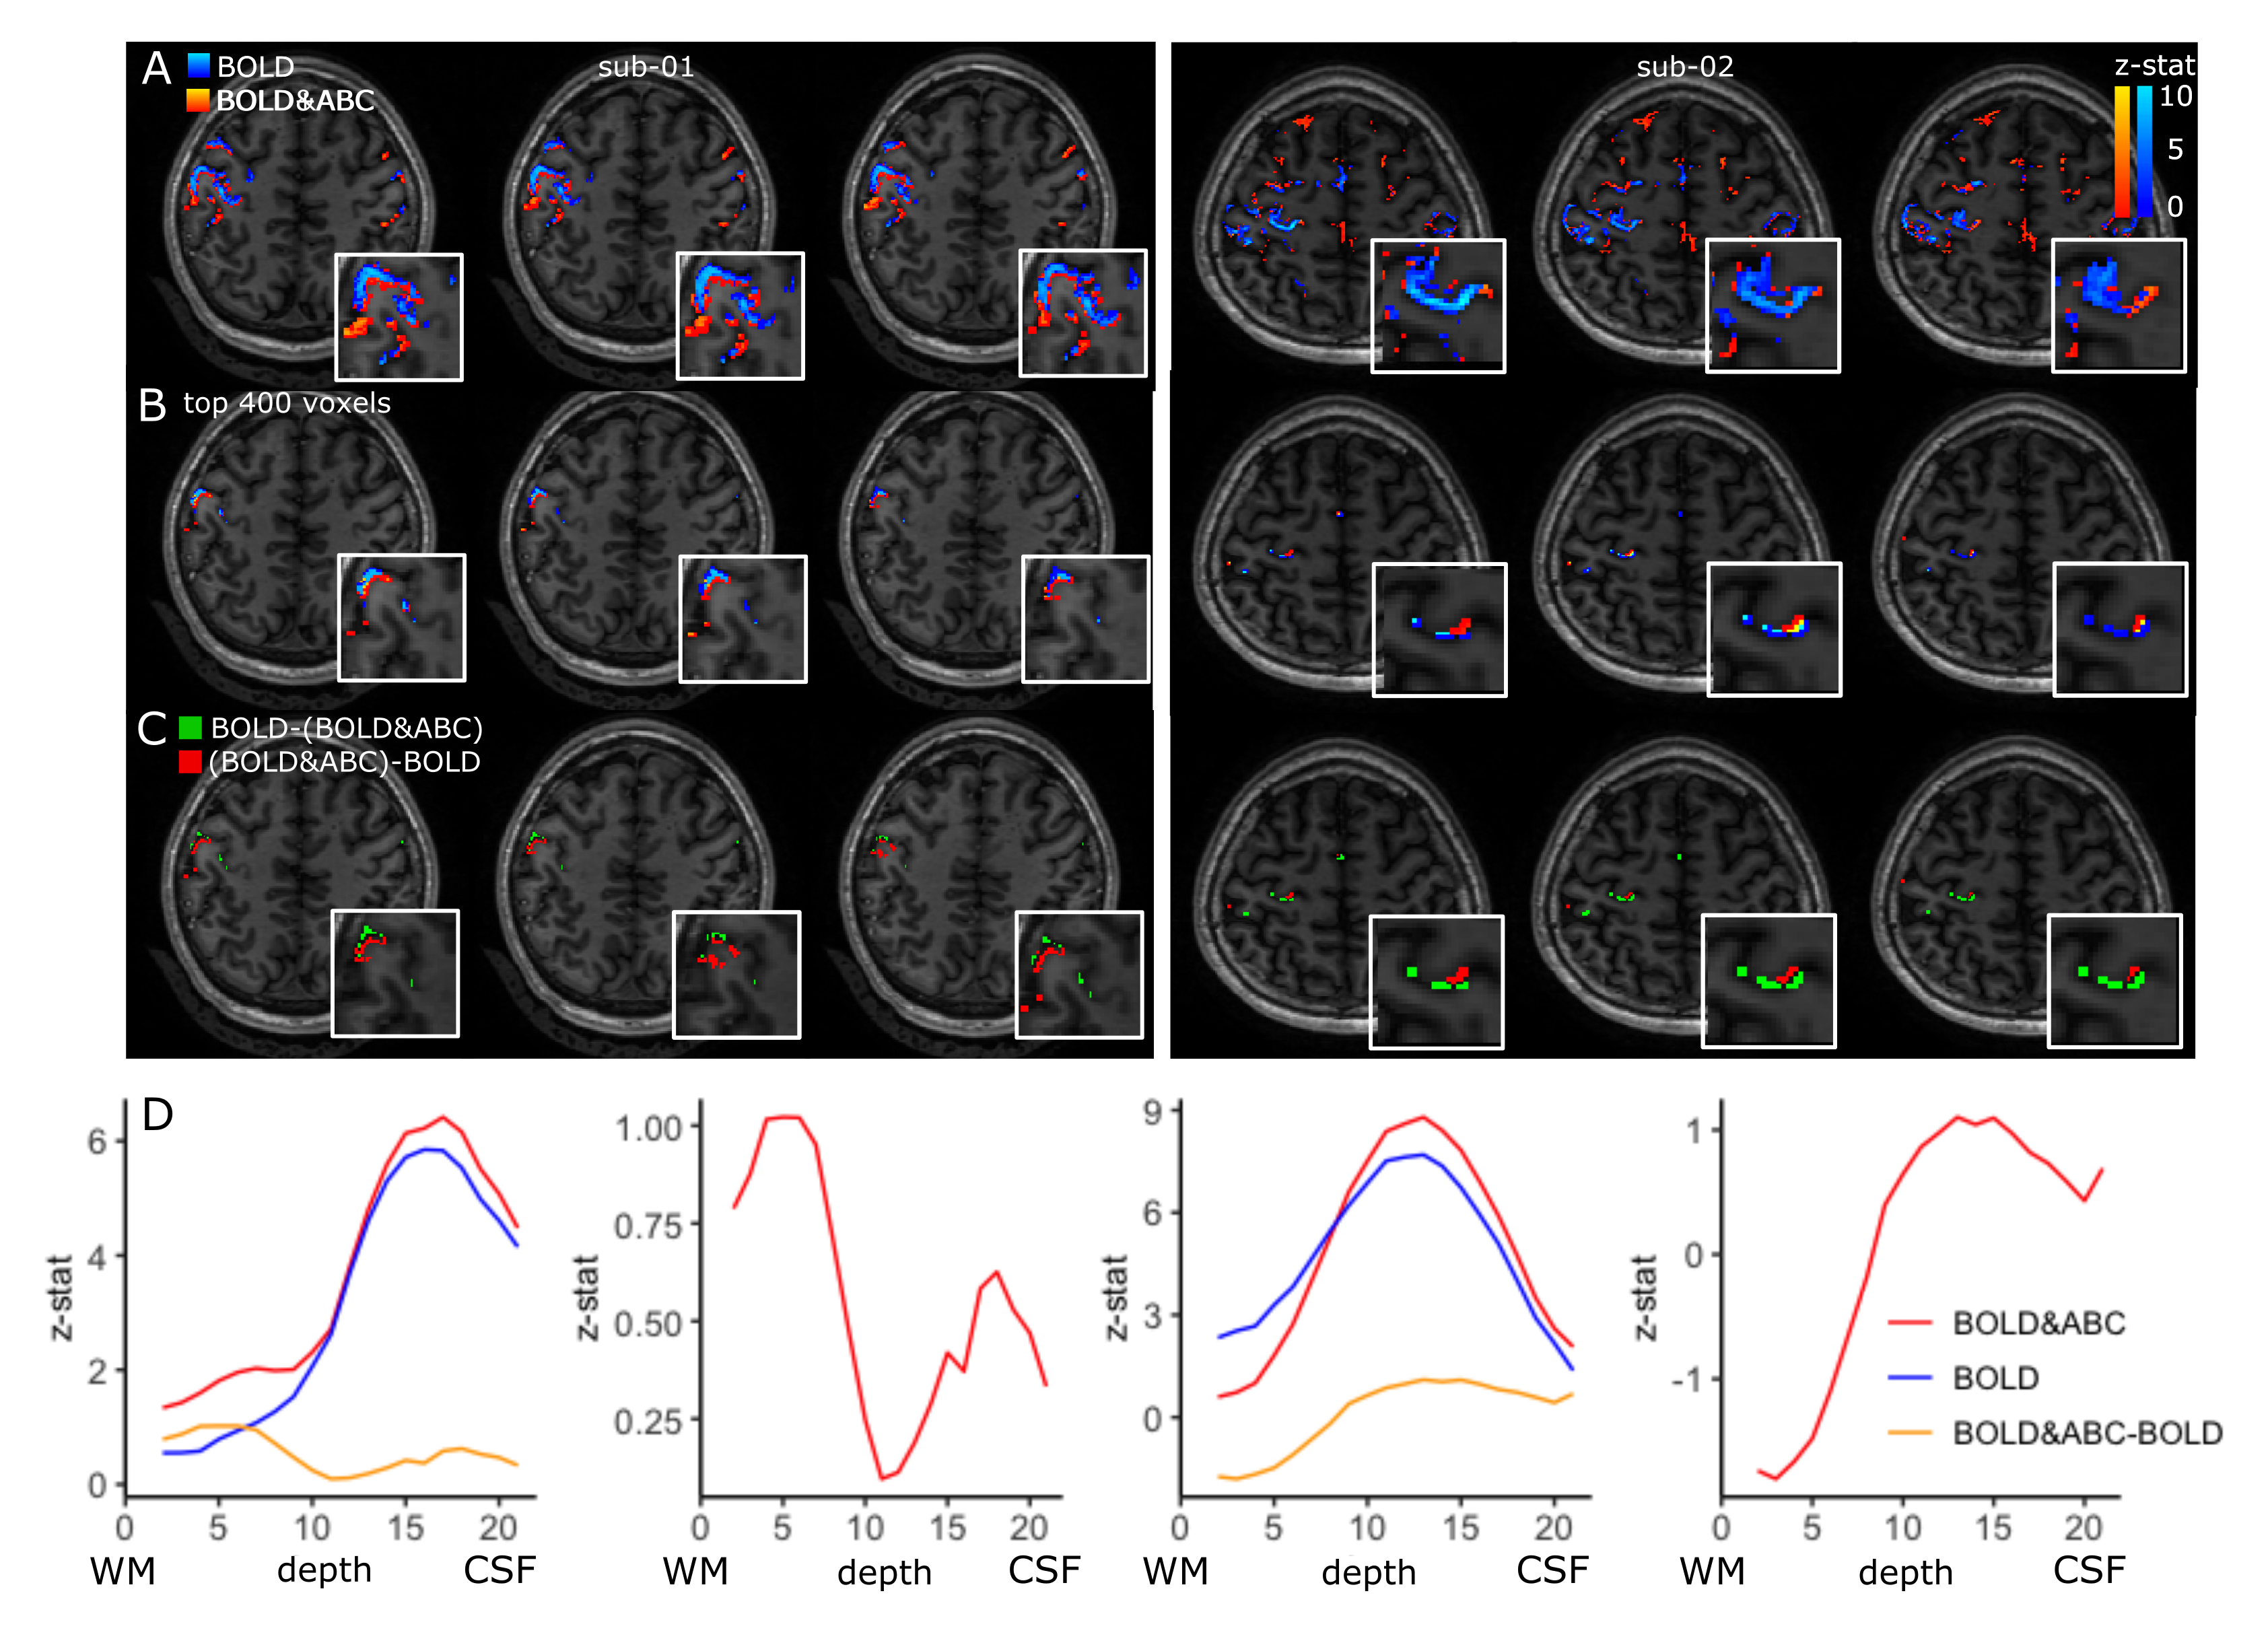
The finger-tapping task produced activations in the somatosensory-motor cortex in both the BOLD and BOLD-and-ABC-weighted data. While no consistent differences were observed in the activation peak z-stat or volume (Table 1), a displacement between BOLD and BOLD-and-ABC that followed the precentral and postcentral gyri was observed even at low-resolution (Fig.3). The submillimeter results suggested that ABC may shift the activation deeper in the cortex compared to BOLD (Fig.4). The layer-profile of the difference between BOLD&ABC and BOLD showed reduced weighting towards the surface in the first participant.
Discussion
BOLD-fMRI has transformed human neuroscience, but is limited in its spatial specificity. Here, we examined ABC-fMRI as a novel CBV-weighted method at 7T.High power is necessary to sufficiently saturate the bound-pool7,10. At higher fields this is possible with sparser saturations, though the lack of an Mz steady-state11 may necessitate shifting the readout of the k-space center.
Using a sparse-saturation approach we examined the localization of BOLD-and-ABC. In all participants, robust BOLD-and-ABC activations were observed, including the high-resolution protocol, though no consistent increase in activation over BOLD was found at this TE. The BOLD-and-ABC clusters were spatially shifted compared to BOLD clusters. The submillimeter protocol suggests this to be towards higher intracortical activation, potentially in agreement with a better localized signal compared to the surface-weighted BOLD3.
The BOLD-and-ABC sensitivity compared to other CBV-weighted approaches4 is unclear. In the current implementation, high sensitivity was achieved, but the precise combination of arterial- and venous-weighting is hard to disentangle. TE=0 is optimal for ABC, but longer TEs may still show little venous-weighting7.
Conclusion
In this study we examine for the first time the application of ABC-fMRI at 7T and demonstrate its submillimeter usage. Our results show good localization compared to BOLD and high sensitivity which is promising for high-resolution fMRI.Acknowledgements
No acknowledgement found.References
1. Glover GH. Overview of functional magnetic resonance imaging. Neurosurgery clinics of North America. 2011;22(2):133-139, vii.
2. Uludağ K, Müller-Bierl B, Uğurbil K. An integrative model for neuronal activity-induced signal changes for gradient and spin echo functional imaging. Neuroimage. 2009;48(1):150-165.
3. Zhao F, Wang P, Kim SG. Cortical depth-dependent gradient-echo and spin-echo BOLD fMRI at 9.4T. Magn Reson Med. 2004;51(3):518-524.
4. Huber L, Ivanov D, Handwerker DA, et al. Techniques for blood volume fMRI with VASO: From low-resolution mapping towards sub-millimeter layer-dependent applications. Neuroimage. 2018;164:131-143.
5. Zhang R, Cox RW, Hyde JS. The effect of magnetization transfer on functional MRI signals. Magn Reson Med. 1997;38(2):187-192.
6. Kim T, Hendrich K, Kim SG. Functional MRI with magnetization transfer effects: determination of BOLD and arterial blood volume changes. Magn Reson Med. 2008;60(6):1518-1523.
7. Schulz J, Fazal Z, Metere R, Marques J, Norris D. Arterial blood contrast (ABC) enabled by magnetization transfer (MT): a novel MRI technique for enhancing the measurement of brain activation changes. Biorxiv2020.
8. Hu BS, Conolly SM, Wright GA, Nishimura DG, Macovski A. Pulsed saturation transfer contrast. Magnetic Resonance in Medicine. 1992;26(2):231-240.
9. van Gelderen P, Jiang X, Duyn JH. Effects of magnetization transfer on T1 contrast in human brain white matter. Neuroimage. 2016;128:85-95.
10. van Gelderen P, Jiang X, Duyn JH. Rapid measurement of brain macromolecular proton fraction with transient saturation transfer MRI. Magn Reson Med. 2017;77(6):2174-2185.11. Henkelman RM, Huang X, Xiang QS, Stanisz GJ, Swanson SD, Bronskill MJ. Quantitative interpretation of magnetization transfer. Magn Reson Med. 1993;29(6):759-766.
Figures