0636
Layer- and column-resolved 7T fMRI reveals neural correlates of consciousness in human visual cortex and thalamus1State Key Laboratory of Brain and Cognitive Science, Institute of Biophysics, Chinese Academy of Sciences, Beijing, China, 2University of Chinese Academy of Sciences, Beijing, China, 3Department of Neurosurgery, Xiangya Hospital, Central South University, Changsha, China, 4Max-Planck-Institute for Biological Cybernetics, Tübingen, Germany, 5Department of Psychology, University of Minnesota, Minneapolis, MN, United States
Synopsis
Binocular rivalry is a unique window to study the neural correlates of consciousness. Where and how does binocular rivalry arise in the human brain remains an open question. Using laminar fMRI at 7T, we found that eye-specific modulation of BOLD signal peaked in the middle layer of primary visual cortex (V1) during simulated replay, but stronger in the superficial layer during rivalry. Furthermore, eye-specific modulation of lateral geniculate nucleus (LGN) activity was robust in the replay but minimal in the rivalry condition. These findings support that binocular rivalry mainly arises from interocular interaction in the superficial layer of V1.
Introduction
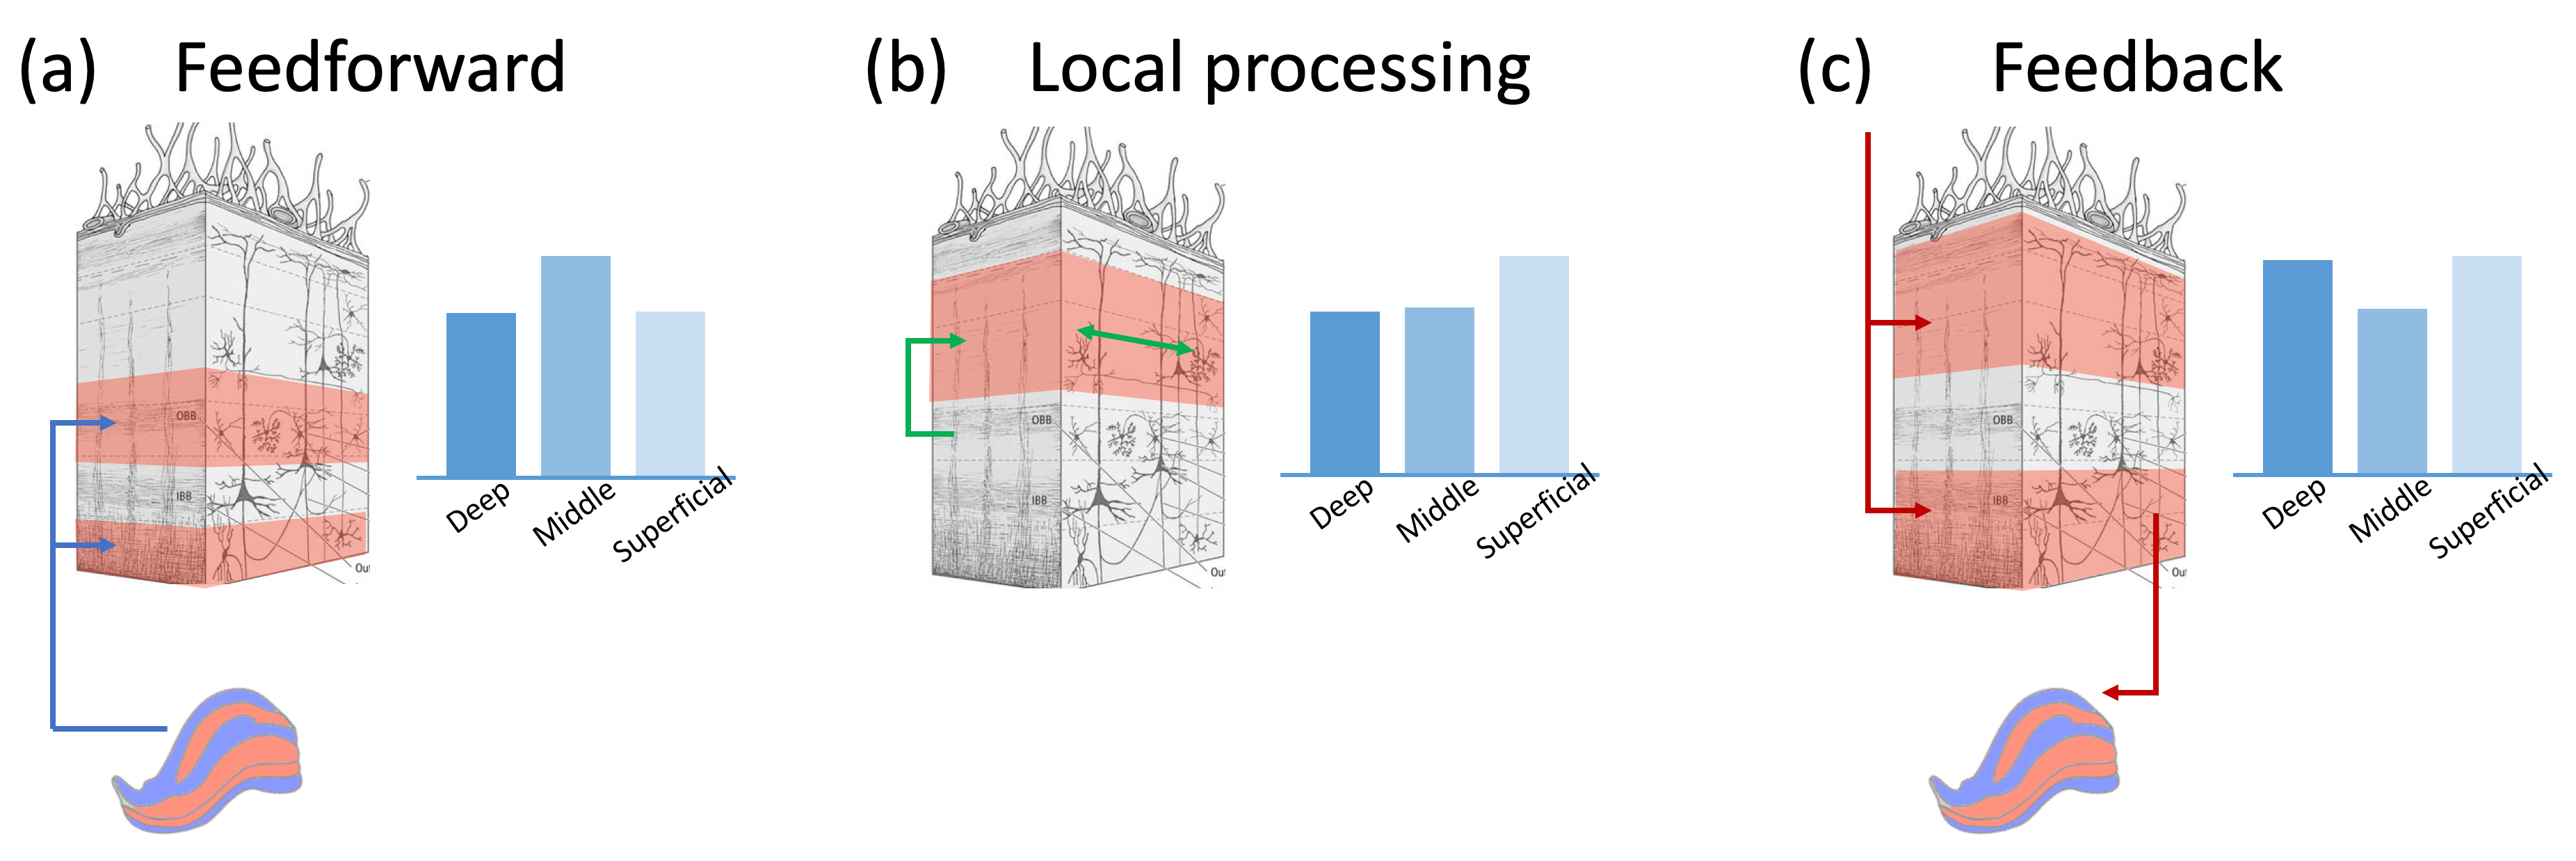
Binocular rivalry, in which conflicting visual inputs into two eyes compete for conscious representation, has been a productive paradigm to study consciousness since physical stimuli stay unchanged but perception alternates spontaneously. However, where and how sensory conflicts are resolved, and in particular, what is the relative contribution of feedforward, feedback, and lateral processes in the rivalry related modulation observed in early visual areas are still under debate (Figure 1). Previous monkey electrophysiology studies found that most V1 neurons fired regardless of percept 1 and there was no rivalry in LGN 2. However, human fMRI data showed strong perception correlated activity modulation in V1 3,4 and even LGN 5,6, which could be as strong as modulation induced by physical alteration. Here we address this question by resolving brain activity in different ocular dominance (OD) columns and cortical layers, as well as OD clusters in the LGN, using high resolution fMRI at 7T.Methods
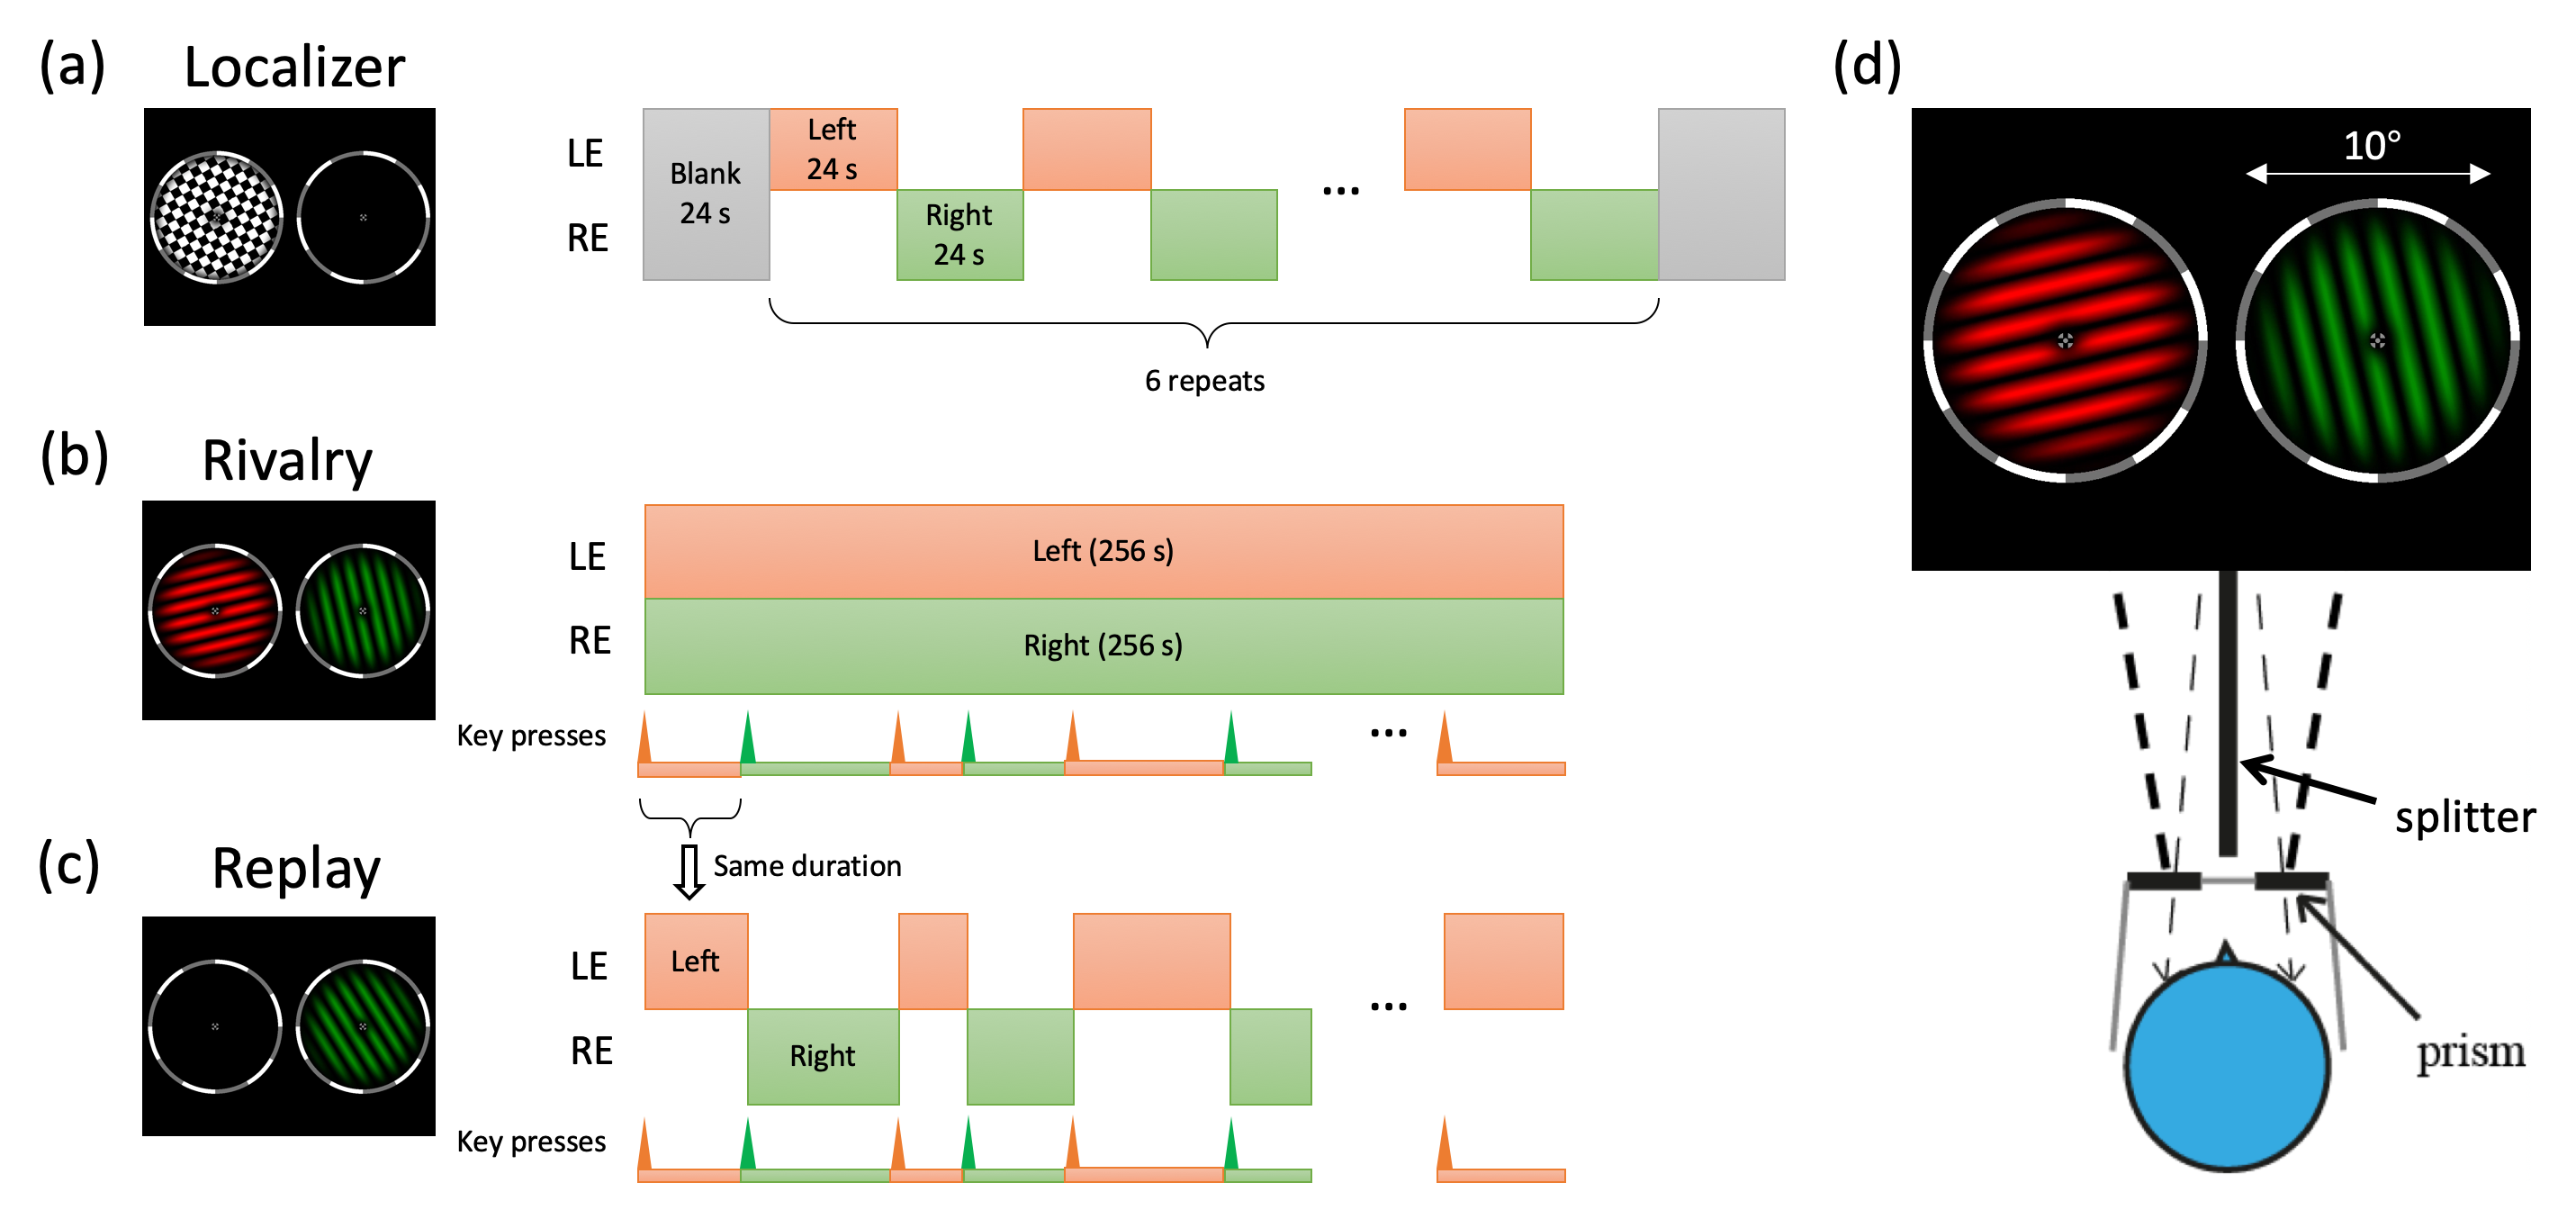
Figure 2 shows the stimuli and procedures for the experiments. To selectively activate ocular dominance columns in V1 and clusters in LGN, a high contrast checkerboard flickering at 8 Hz was monocularly delivered to the left or right eye in alternating 24 s blocks in localizer runs. Subjects viewed the dichoptic stimuli in the scanner using prism glasses and a splitter, and reported occasional size changes of the fixation point. In rivalry runs, one eye was shown a red grating, while the other was shown a green one. The color was counterbalanced across runs. The gratings were 0.8 cycle/deg, rotated at 0.67 Hz and stayed orthogonal in orientation. Subjects constantly reported their perception as seeing red, green, or mixed by pressing one of three buttons. In replay runs, the perception and timing of the previous rivalry run were simulated with physically alternating monocular stimulus.MRI acquisition was done in a 7T scanner (Siemens Magnetom) with a 32-channel receive single channel transmit head coil (NOVA medical). Bite bar was used to restrict head motion.Functional data of V1 were collected using a T2*-weighted multiband 2D GE-EPI sequence (0.8 mm isotropic voxels with 31 slices, FOV=128×128 mm, TE=23 ms, TR=2000 ms, flip angle=80°, bandwidth=1157 Hz/pixel, partial Fourier=6/8, MB=1, GRAPPA=3). Each subject participated 4-6 localier runs, 4 rivalry runs, 4 replay runs in a single session. Sequence parameters for LGN were otherwise identical (1.2 mm isotropic voxels, FOV=180×180 mm, TE=22 ms, 78° flip angle, bandwidth=1587 Hz/pix, GRAPPA=2). T1 weighted anatomical volumes were acquired using MP2RAGE sequence (0.7 mm isotropic voxels, FOV=224×224 mm, 256 sagittal slices, TE = 3.05 ms, TR = 4000 ms, TI1 = 750 ms, 4° flip angle, TI2 = 2500 ms, 5° flip angle, bandwidth=240 Hz/pix, 7/8 phase partial Fourier, 7/8 slice partial Fourier, GRAPPA=3).
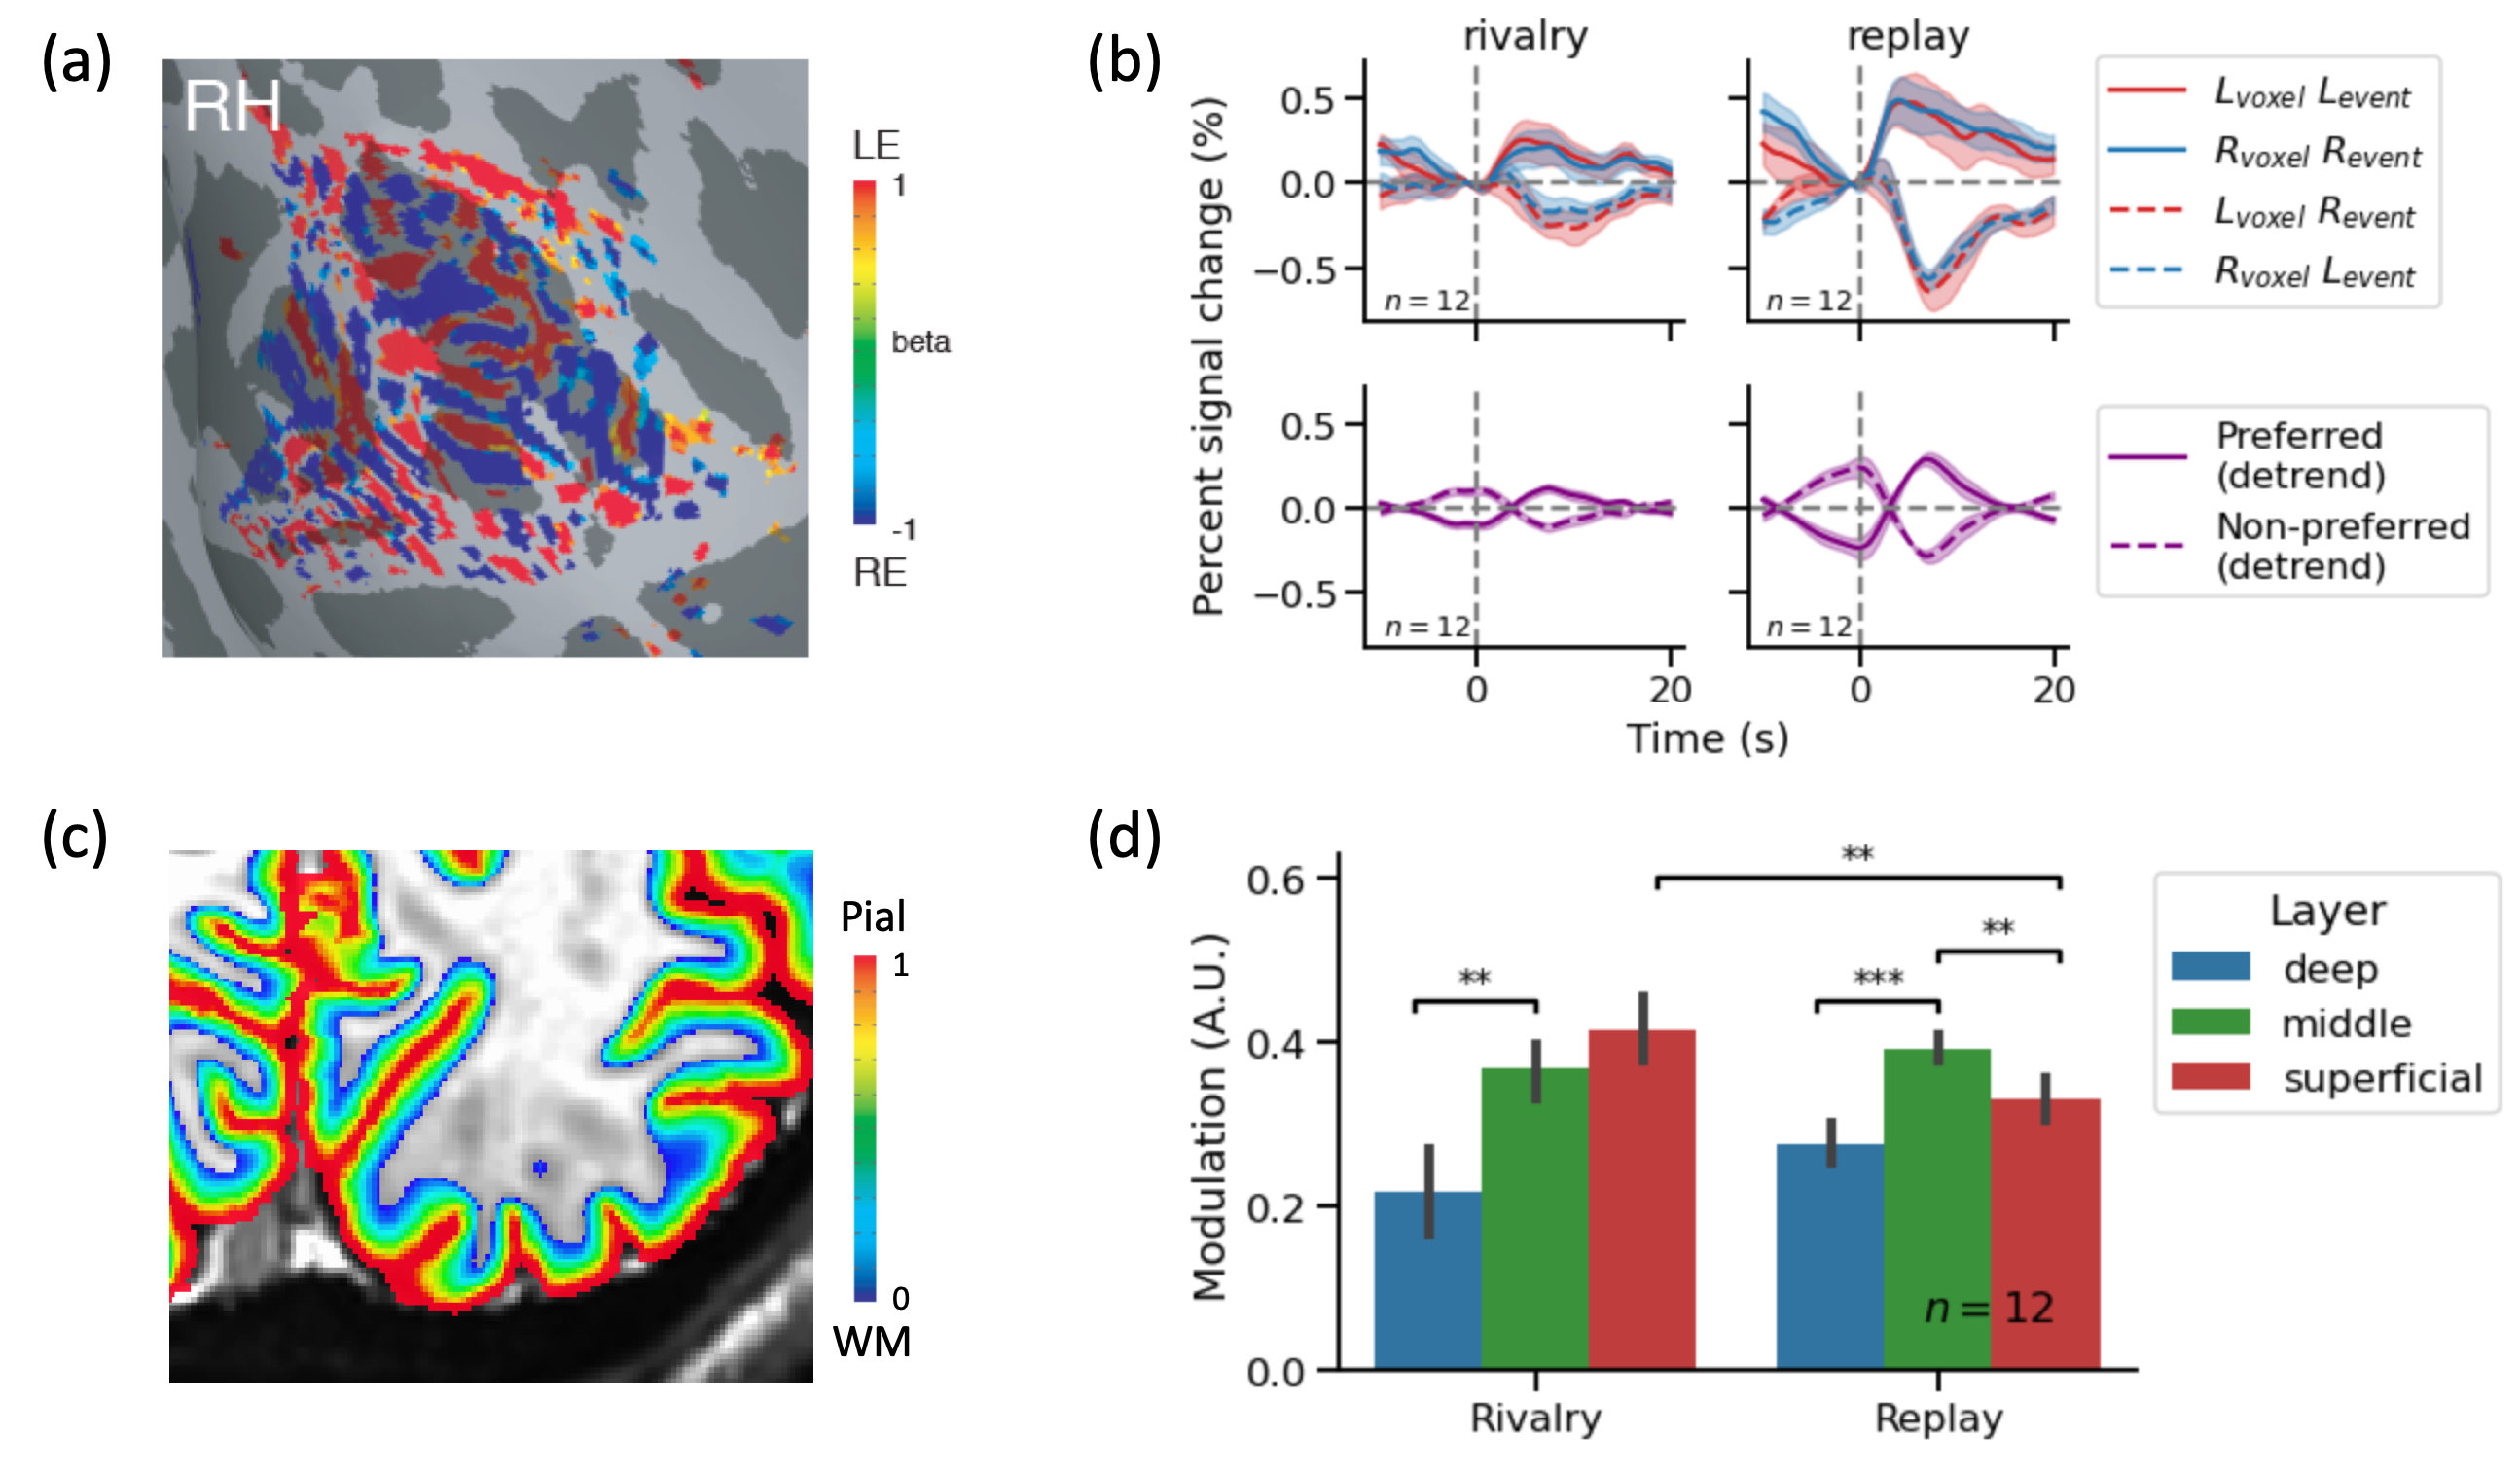
MRI Data were analyzed using AFNI, FreeSurfer, and mripy package (https://github.com/herrlich10/mripy). The reconstructed cortical surfaces were manually edited, and the relative cortical depth of functional voxels were estimated using the equivolume method (Figure 3c). Functional data were corrected for slice timing, geometric distortion in phase encoding direction and head motion before GLM analysis and event related average time locked to key presses. The area under the first peak of the differential response was used as a measure of perception-related modulation. Voxels with excessively high BOLD signal change or low EPI intensity were classified as veins and excluded from further analysis. ROI selection and voxels exclusion were performed in a column-wise manner.
Results
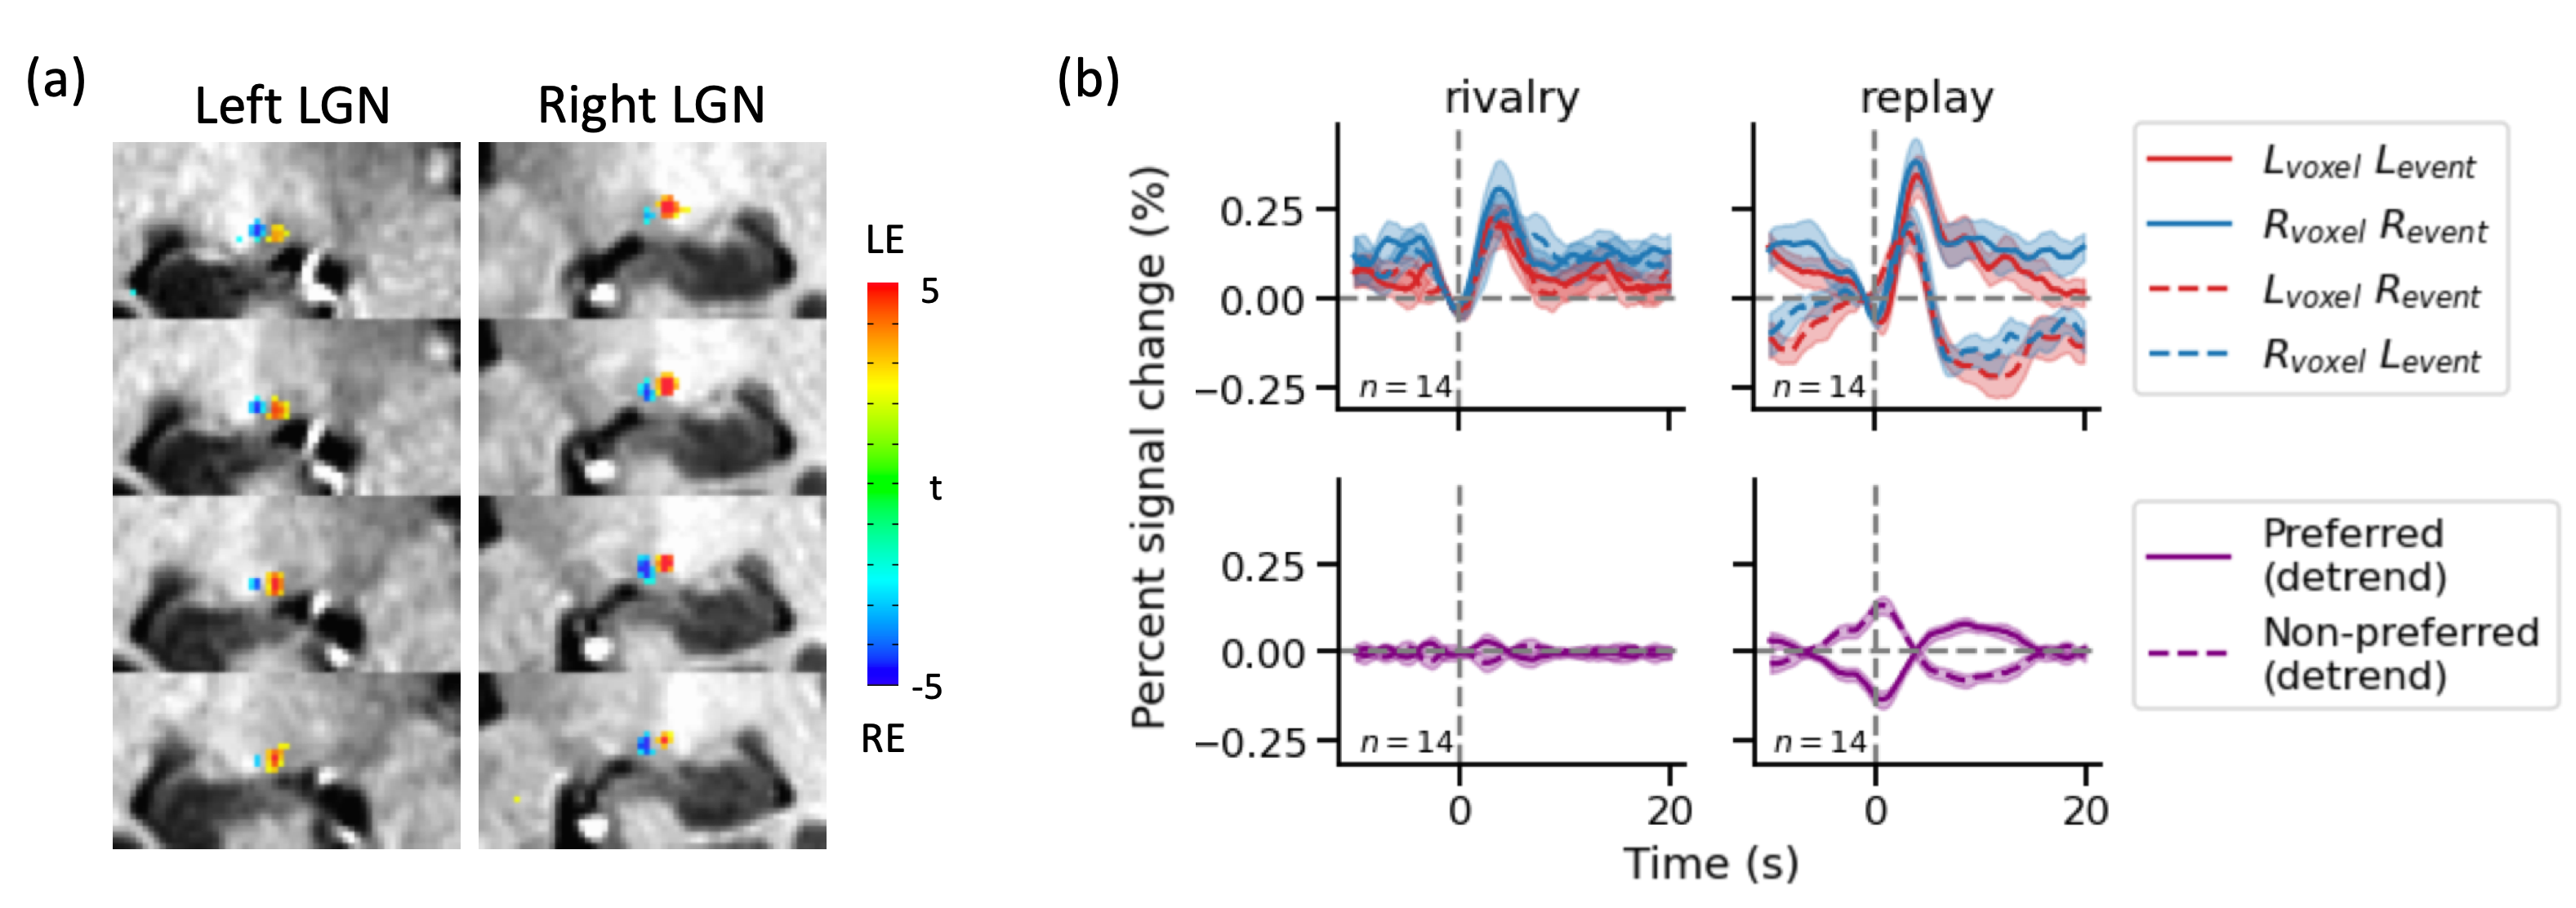
We obtained reliable ocular dominance patterns both in V1 (Figure 3a) and in LGN (Figure 4a) for the majority of subjects. Only subjects with reasonable OD patterns were included for further analysis. Eye-specific BOLD response modulated with perception in V1 (Figure 3b). During simulated replay, the modulation of BOLD signal peaked in the middle layer of V1 (Figure 3d), consistent with the large difference in the feedforward input from the LGN. During binocular rivalry, eye-specific modulation was stronger in the superficial layer of V1, more consistent with interocular interaction via horizontal connections. The rivalry modulation amplitude in V1 was smaller compared with physical alternation, and the eye of origin decoding accuracy in V2 was also smaller for rivalry condition, suggesting that stimulus conflict is not fully resolved by V1. Finally, eye-specific modulation of LGN activity was robust in the replay but absent in the rivalry condition (Figure 4b).Conclusion
Our findings support that binocular rivalry mainly arises from interocular interaction in the superficial layer of V1, with little evidence for eye-specific feedback to the LGN. The results also demonstrate the potential of combining laminar fMRI and functional imaging of subcortical structures.Acknowledgements
No acknowledgement found.References
Leopold, D. a., & Logothetis, N. K. (1996). Activity changes in early visual cortex reflect monkeys’ percepts during binocular rivalry. Nature, 379(6565), 549–53.
Lehky, S. R., & Maunsell, J. H. (1996). No binocular rivalry in the LGN of alert macaque monkeys. Vision Research, 36(9), 1225–34.
Polonsky, A., Blake, R., Braun, J., & Heeger, D. J. (2000). Neuronal activity in human primary visual cortex correlates with perception during binocular rivalry. Nature Neuroscience, 3(11), 1153–1159.
Tong, F., & Engel, S. A. (2001). Interocular rivalry revealed in the human cortical blind-spot representation. Nature, 411(6834), 195–199.
Haynes, J.-D., Deichmann, R., & Rees, G. (2005). Eye-specific effects of binocular rivalry in the human lateral geniculate nucleus. Nature, 438(7067), 496–499.
Wunderlich, K., Schneider, K. A., & Kastner, S. (2005). Neural correlates of binocular rivalry in the human lateral geniculate nucleus. Nat Neurosci, 8(11), 1595–1602.
Figures