0634
Double spin-echo EPI improves sensitivity and specificity for cortical depth-dependent BOLD fMRI in the human somatosensory cortex at 7 T1Center for Neuroscience Imaging Research, Suwon, Korea, Republic of, 2Department of Biomedical Engineering, Sungkyunkwan University, Suwon, Korea, Republic of, 3Department of Biomedical Engineering, Ulsan National Institute of Science and Technology, Ulsan, Korea, Republic of
Synopsis
Spatial-specificity is important for high spatial-resolution-fMRI to determine neuronal activity laminar-profiles. GE-BOLD-signals have low specificity because the highest signals originate from draining-veins at the surface of the cortex, not from capillaries nearby active neurons. However, SE-BOLD-signal has been proposed to be a better indicator of the location of neural activity. In this study, double SE-EPI-sequence was developed to achieve increased sensitivity in SE-BOLD-fMRI and demonstrated its feasibility for fMRI with 0.8-mm in-plane resolution. The results confirm that dSE-BOLD has higher specificity than GE-BOLD and better sensitivity than conventional-SE-BOLD and its potential to probe the function of cortical-circuits with high specificity.
Introduction
High spatiotemporal resolution fMRI permits investigations of mesoscopic cortical functional units such as columns & laminae. Since the size of these small structures is at a range of submillimeter, spatial specificity of fMRI-signals becomes critical. Generally, gradient-echo (GE)-BOLD-signal is the most popular method due to its high SNR and ease of implementation. However, the GE-BOLD-signal peaks at the surface of the cortex due to the high density of draining veins1-2, which is distal to the neural activation-sites. For this reason, GE-BOLD may not be optimal for mapping submillimeter functional structures. On the other hand, spin-echo (SE)-BOLD-signal is expected to have higher spatial accuracy3-4. However, the SE-BOLD-signal suffers from lower sensitivity compared to GE-BOLD-signal, especially at high spatial resolution5. In this work, we introduce a new method called double spin-echo (dSE)-EPI to improve sensitivity of SE-BOLD-contrast by averaging two spin-echoes from three RF-pulses6-7. We demonstrate the feasibility of dSE-EPI for fMRI by comparing image-quality and tSNR with respect to corresponding conventional SE-EPI. To investigate laminar-specificity of SE-BOLD-fMRI, we additionally compared SE-BOLD and GE-BOLD-fMRI in the primary sensory&motor cortices during fist clenching with touching and found that SE-BOLD-fMRI improved laminar specificity. Conclusively, by acquiring multi-shot dSE-EPI, in-plane resolution of 0.8 mm was achieved, and its feasibility and spatial superiority were demonstrated. The proposed method can be advantageous for high spatial resolution UHF-fMRI studies in the pursuit of resolving mesoscopic functional units.Methods
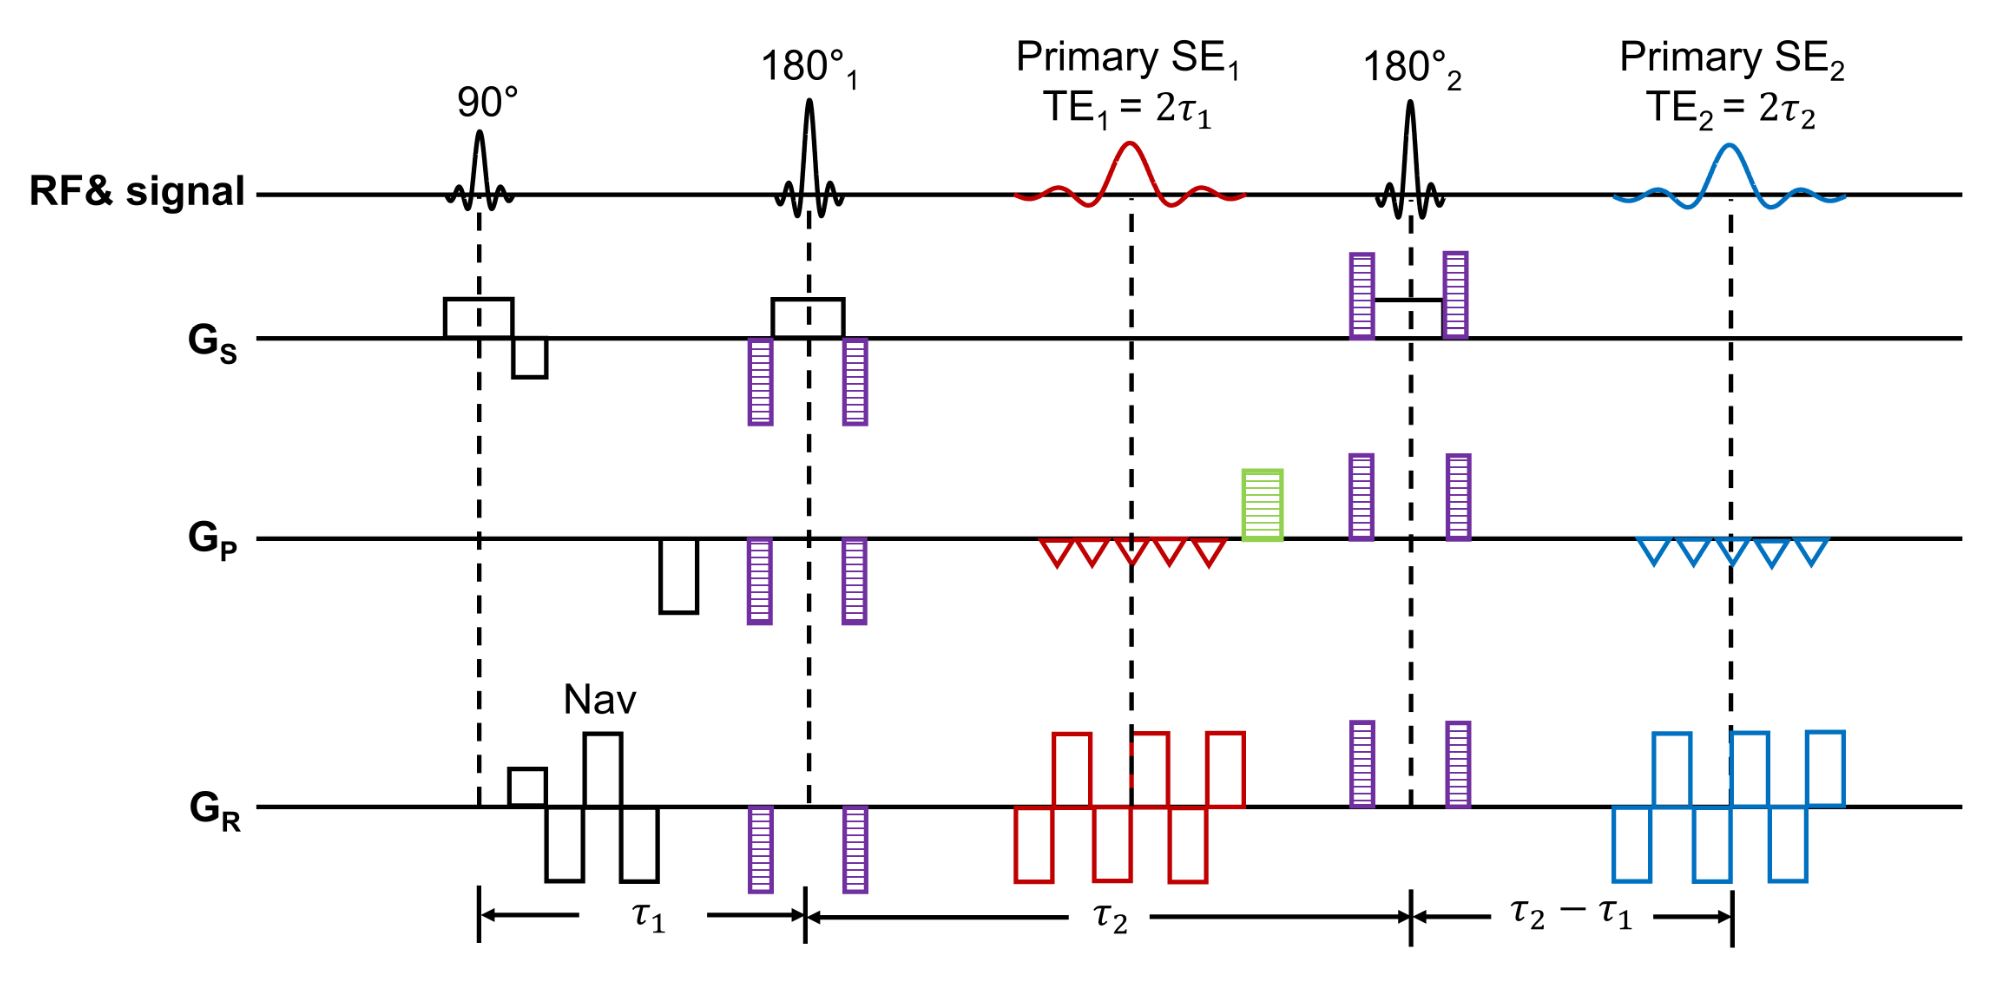
Seven subjects were participated in this study. All procedures followed the guidelines of the IRB of Sungkyunkwan University. All measurements were performed on a 7T-scanner (MAGNETOM-Terra, Siemens-Healthineers), equipped with a 32-channel head-coil (NOVA-Medical). A schematic diagram of double spin-echo (dSE)-EPI is shown in Fig1. The terms 2 and 2 are echo-times of the first and second primary SEs, respectively. A 3.8-min unilateral fist-clenching with touching stimulation paradigm (initial 20-s resting and 8-blocks of alternating 6-s clenching and 20-s resting) was used for all fMRI experiments. First, BOLD-fMRI was obtained with dSE and conventional-SE acquisitions with 1.5-mm isotropic resolution, Rin-plane=3, FOV=150×150-mm2, 12-slices. TE1/TE2=40/65-ms for dSE, while 52-ms for conventional-SE. Second, to demonstrate superior specificity of SE-BOLD compared to GE-BOLD, six subjects were investigated with 1×1 mm2 in-plane resolution, Rin-plane=3, FOV=140×140-mm2, 24-slices(slice-thickness=1.5-mm), TE=25/50-ms for GE/SE, and the number of runs=1/5 for GE/SE. Third, 0.8-mm in-plane resolution with dSE-EPI was acquired with Rin-plane=9(for each-shot; effective Rin-plane=3 by 3-shots), FOV=112×112-mm2, 10-slices(slice-thickness=1.5-mm), TE = 25 ms for GE, TE1/TE2=37/64-ms. For all experiments, TR=2000-ms, partial-Fourier=6/8 were used.Results
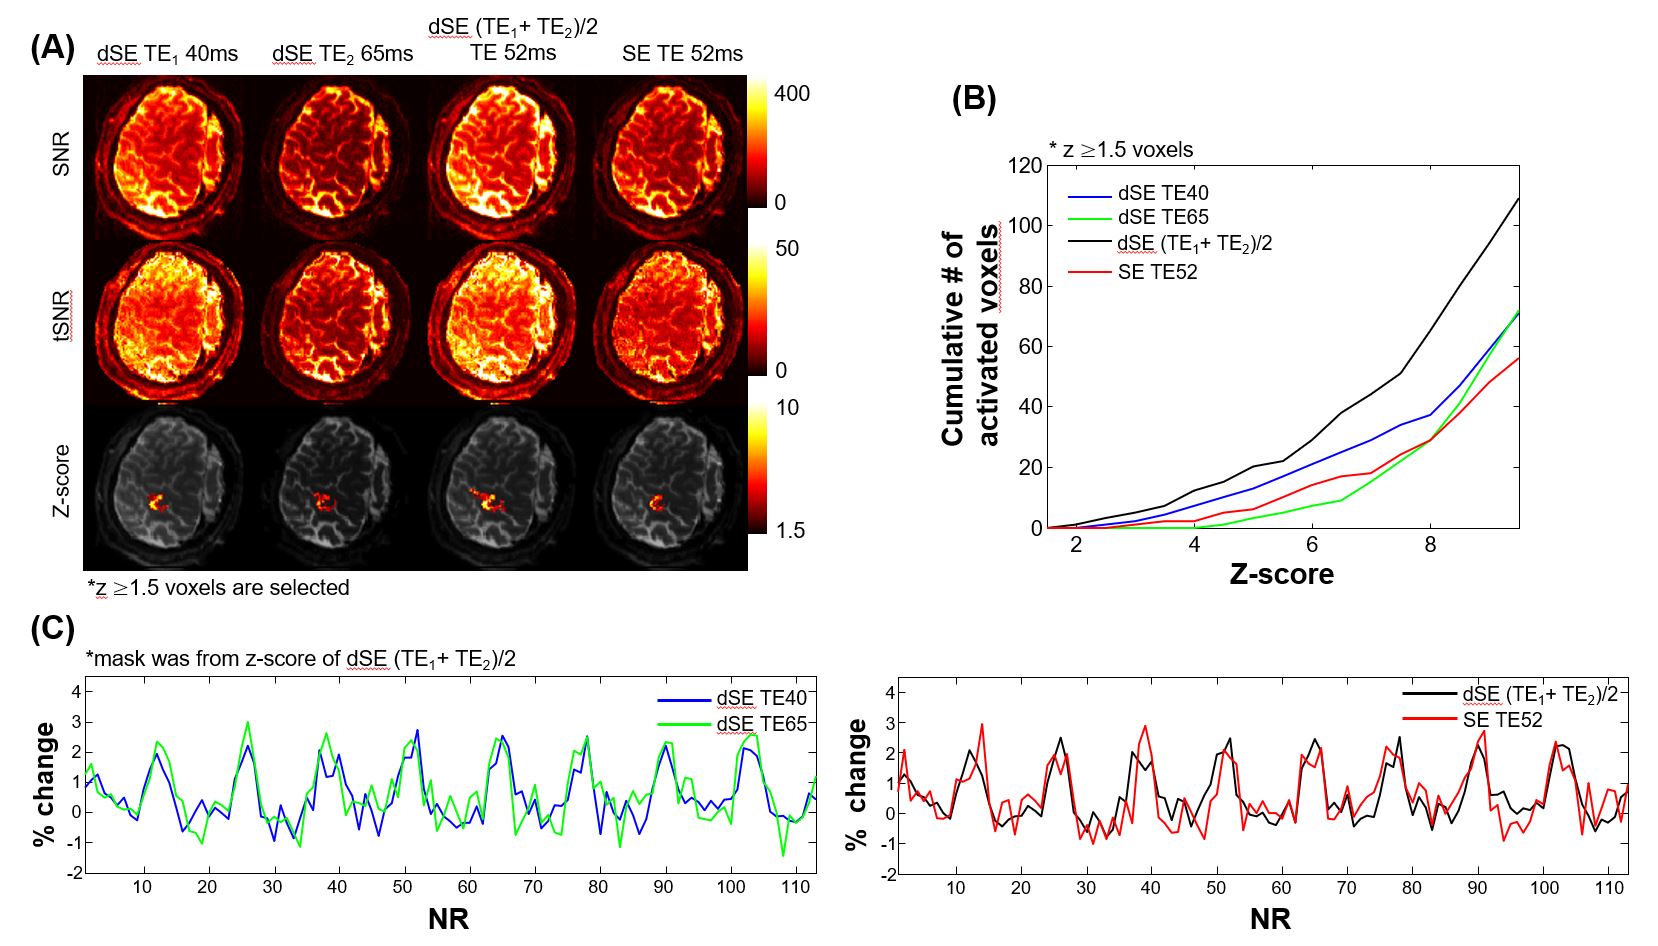
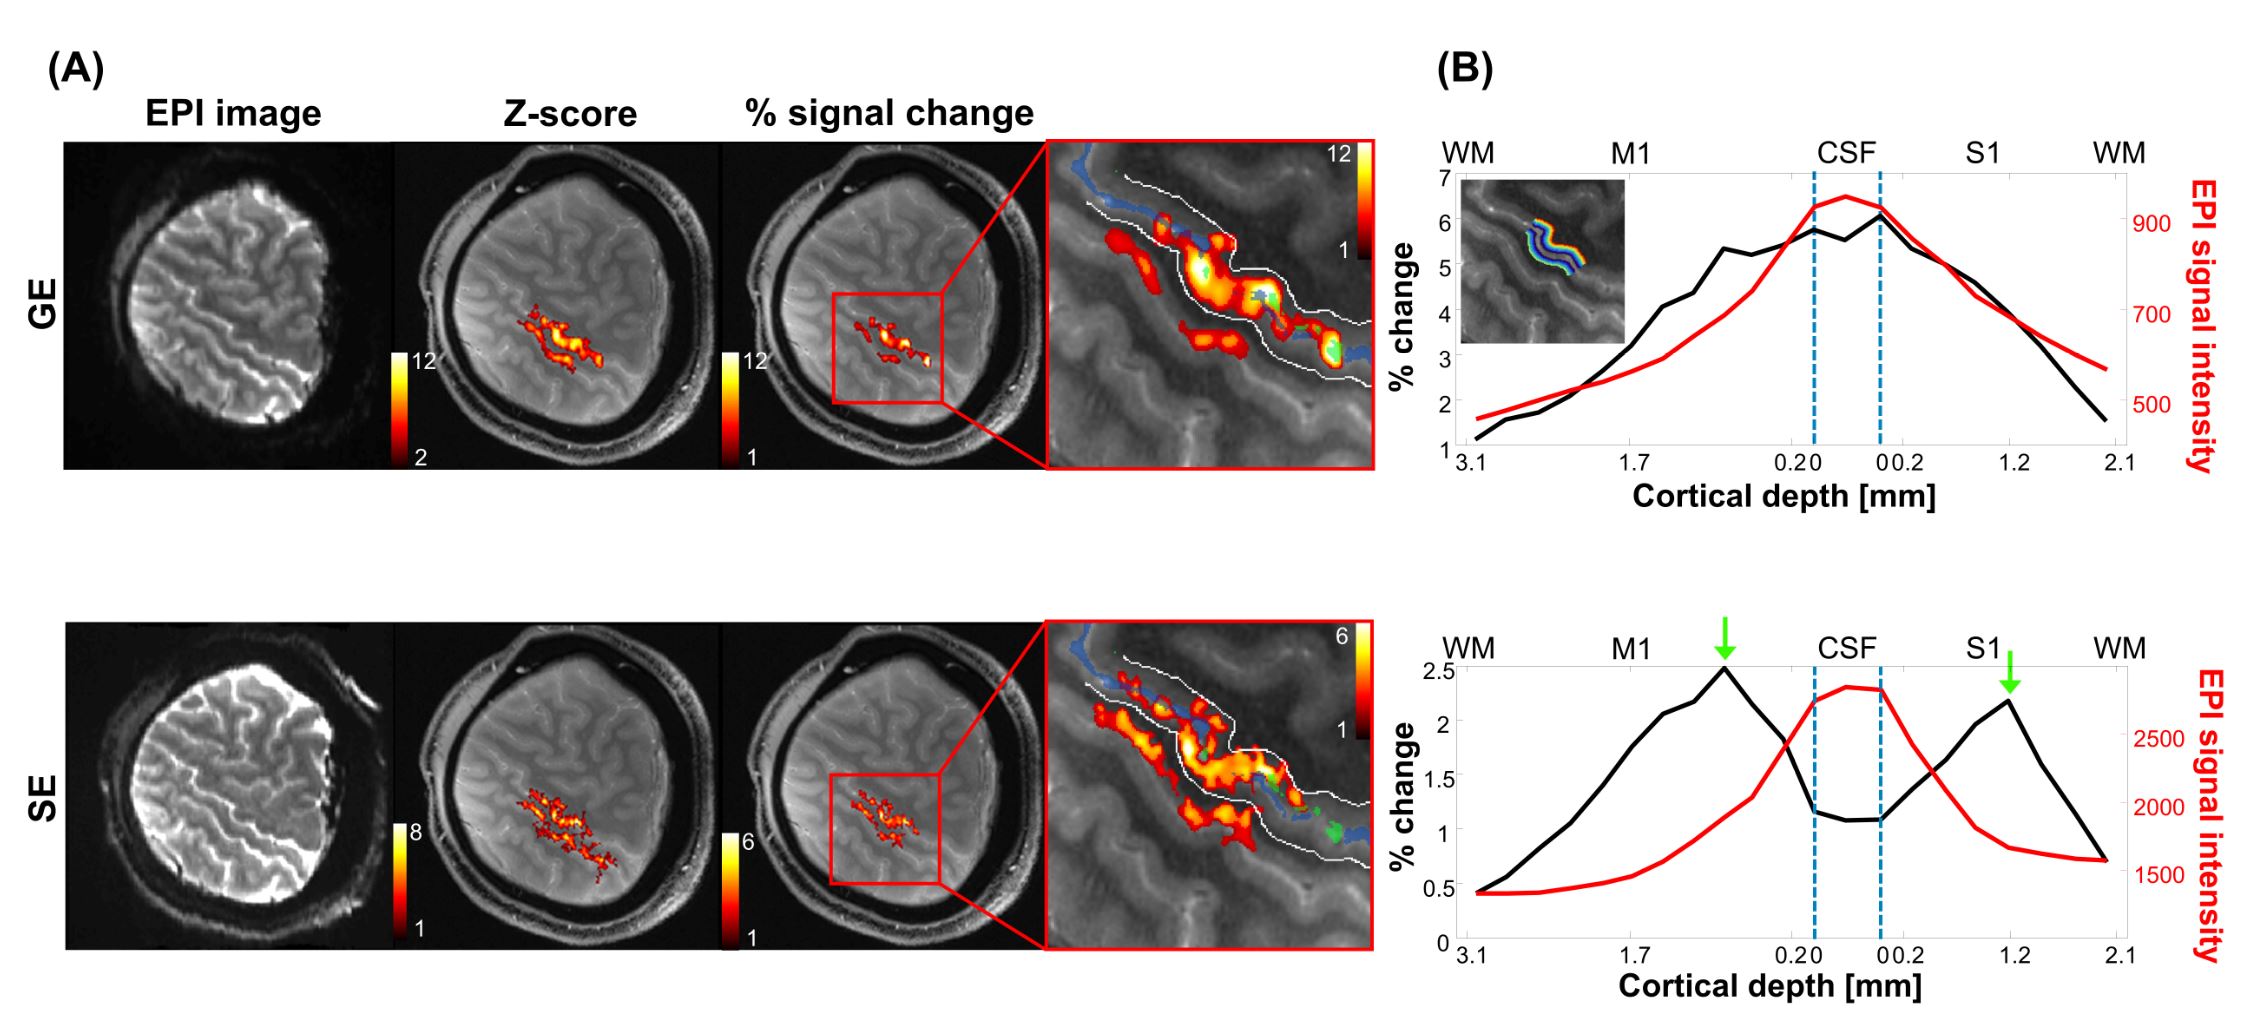
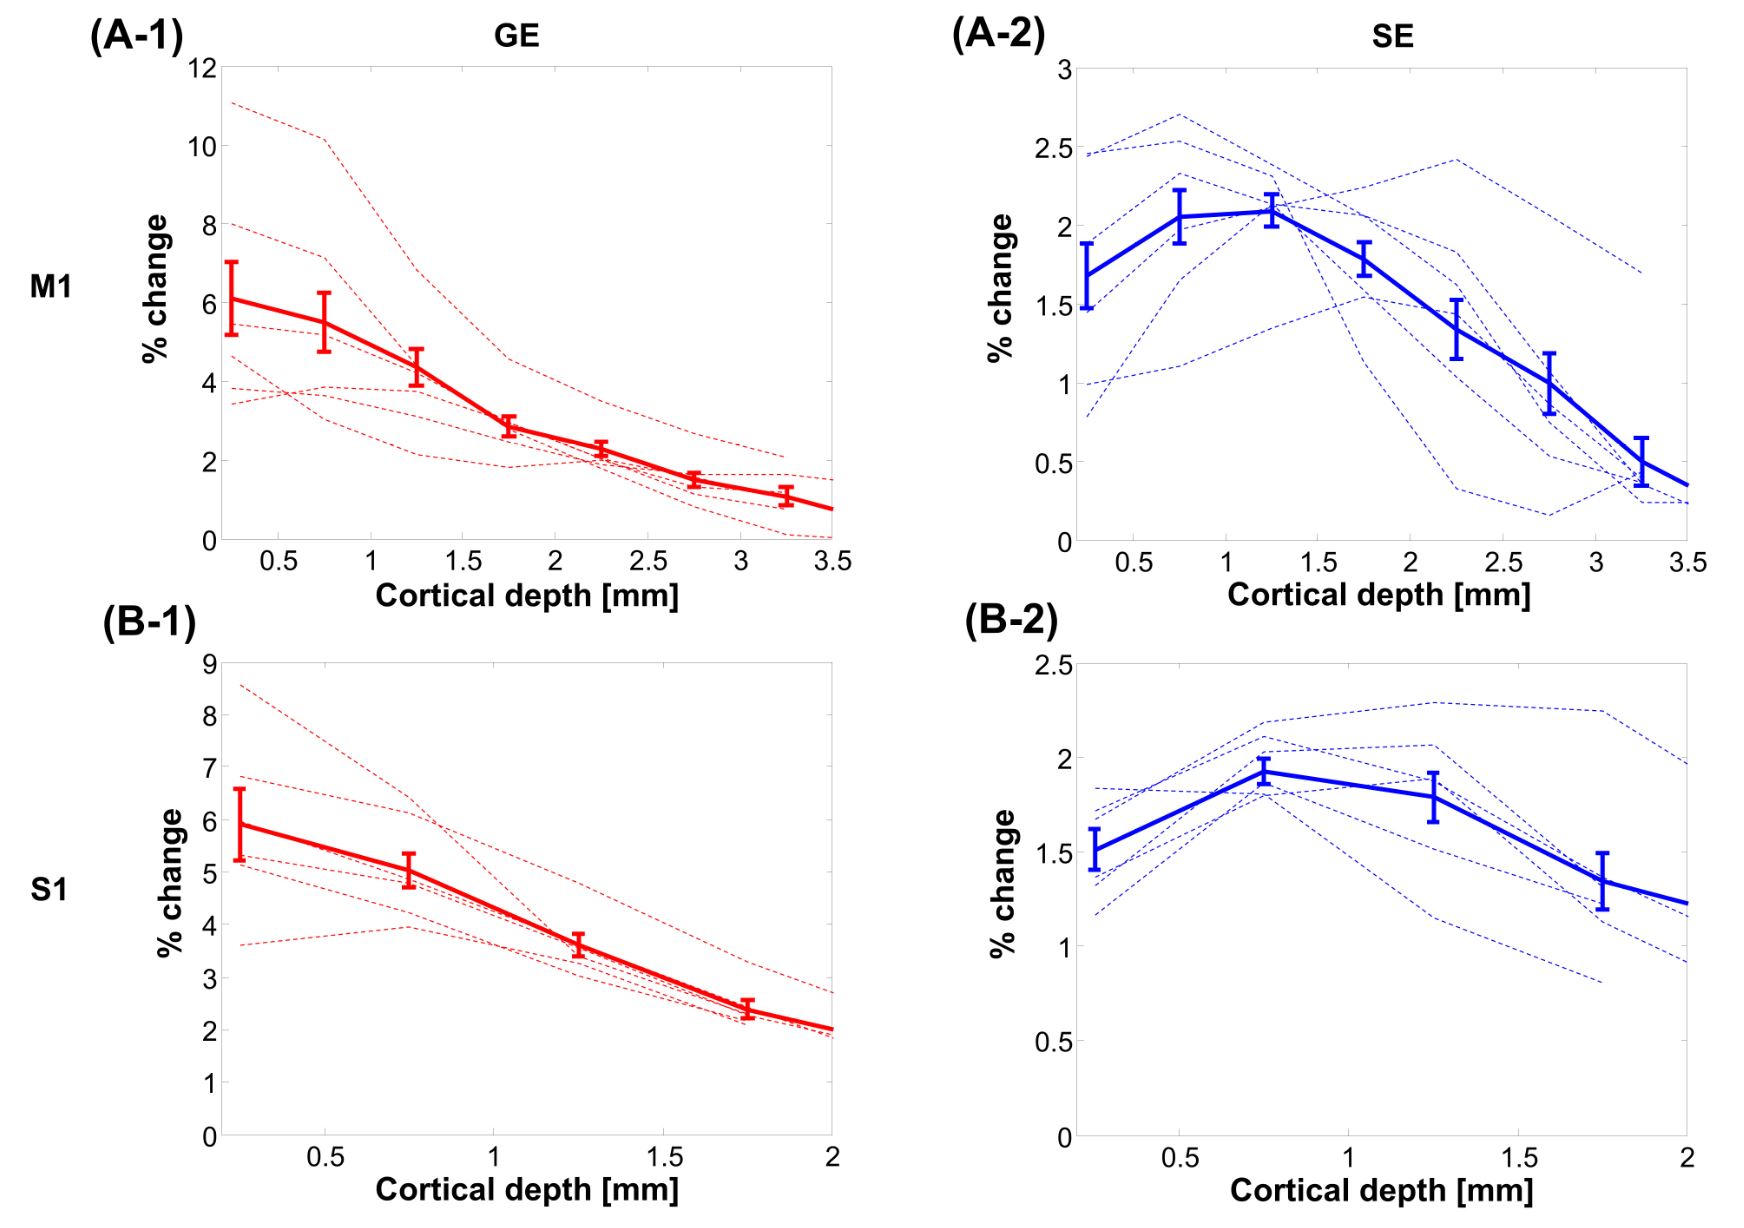
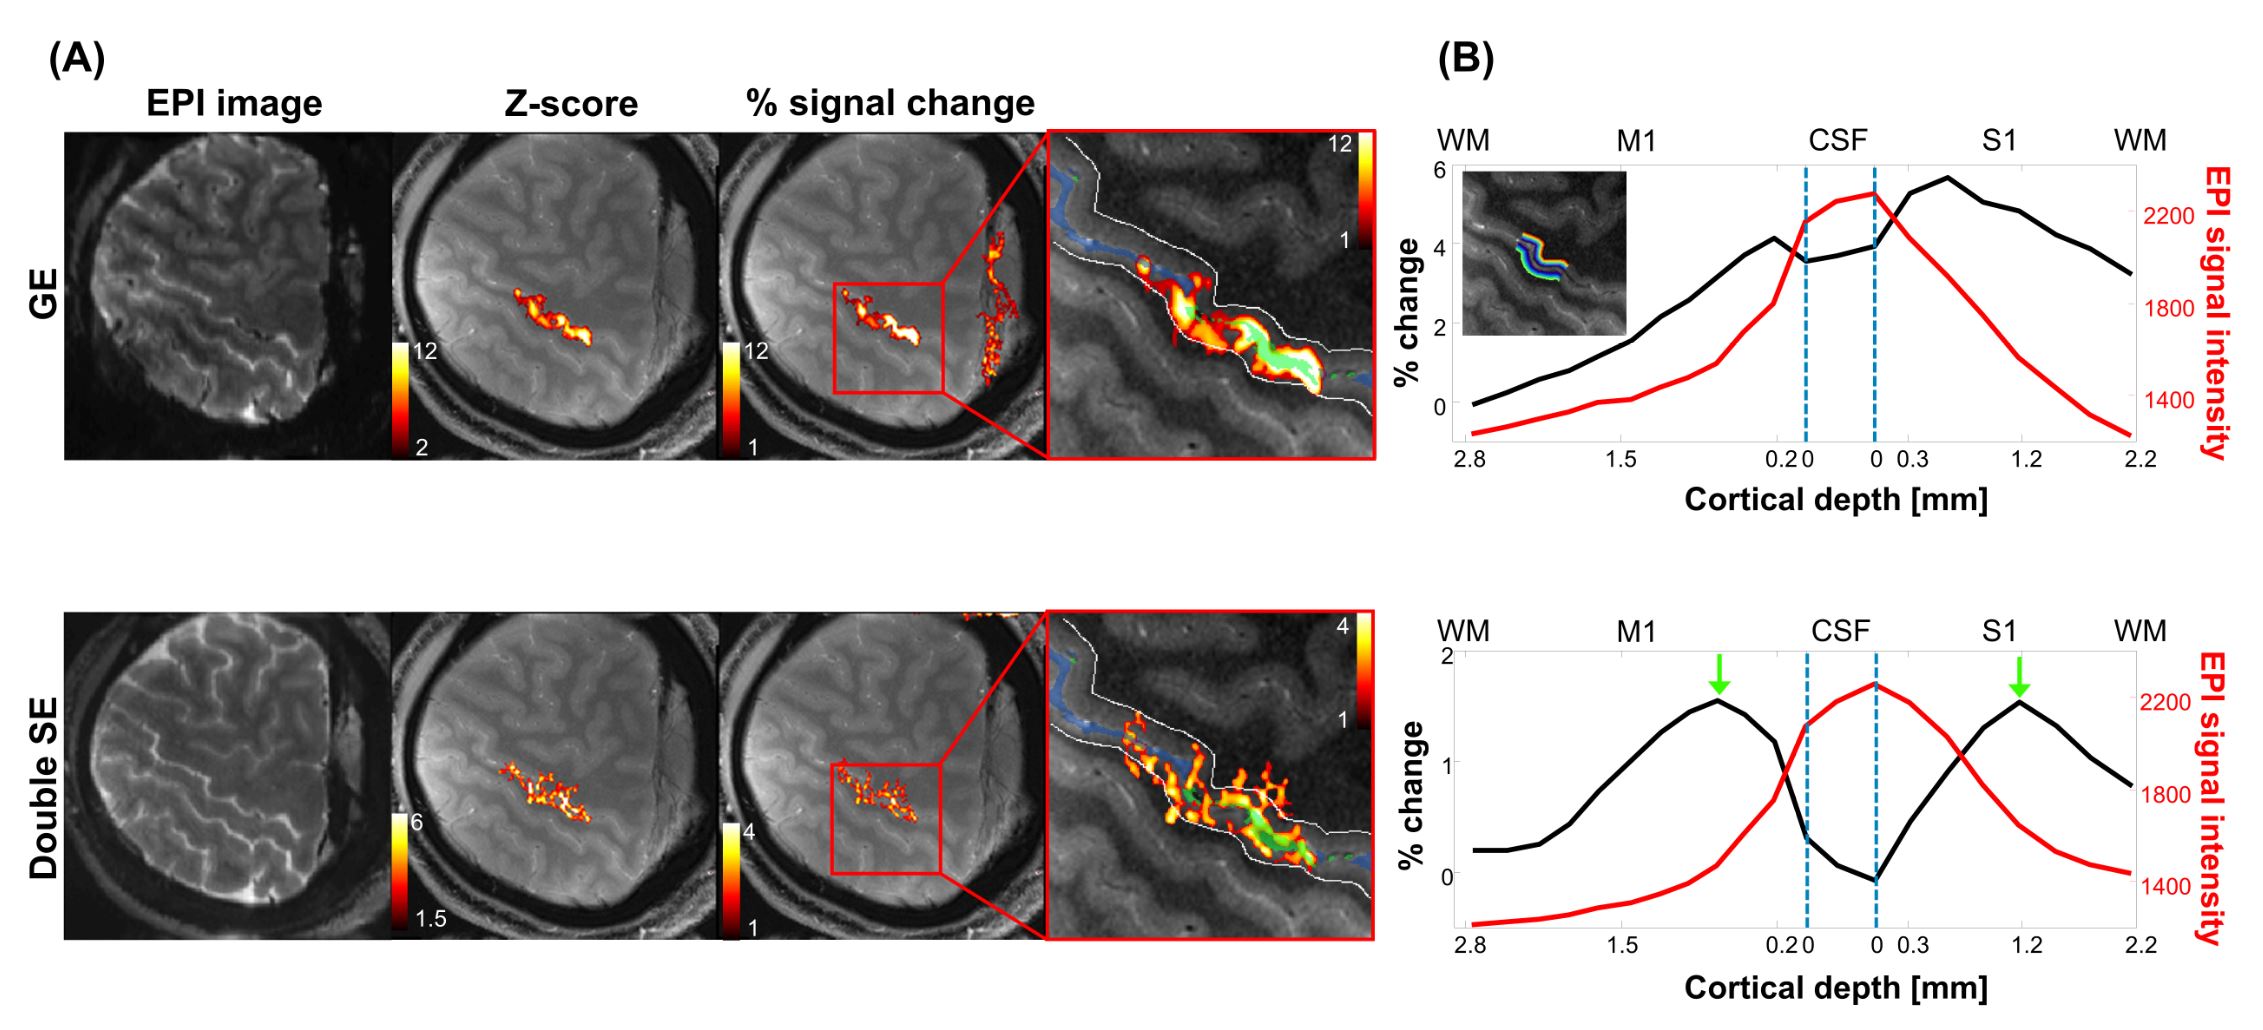
To investigate fMRI sensitivity gain by the dSE-sequence, SE-BOLD-fMRI acquired by the dSE-sequence with TE1/TE2 of 40/65-ms was compared with that obtained by the single SE-sequence with TE of 52-ms. SNR, tSNR and z-score maps were compared in Fig2A. The averaged signal of two echoes from dSE clearly had higher SNR and tSNR than that of conventional-SE. Fig2B shows the cumulative plot of the number of activated voxels as a function of z-score value. The number of activated voxels was higher for the averaged two-echoes BOLD of dSE than single SE-BOLD with TE of 40, 52, and 65-ms. Fig2C showed that time courses of the averaged signal of two-echoes from dSE was less fluctuated, compared with those of conventional-SE. To evaluate spatial specificity of BOLD signals to the parenchyma, GE-EPI and SE-EPI fMRI were compared. Functional maps overlaid on T1-weighted images are shown in Fig 3A. In the case of GE-EPI, the percent signal changes peaked near the CSF area and it was very difficult to separate M1 and S1 activation areas. However, in the case of SE-EPI, there was no significant activation at CSF, allowing to clearly distinguish M1 and S1 activation. The cortical profiles of the percent signal change are shown as a function of cortical depth in Fig3B. The functional activation of GE-BOLD-fMRI was highest at the cortical surface and decreased monotonically with increasing cortical depth. On the other hand, in the case of SE-EPI, the percent signal change at the cortical surface was reduced and two distinct peaks(in S1 and M1) were observed in middle layers as indicated by green arrows. The cortical depth profiles of M1 and S1 across all participants are shown in Fig4; individual cortical profiles for each subject were plotted with dotted-lines and averaged cortical profiles were with solid-lines. The peak of SE-BOLD changes(blue-colored) has ~ 1.25 mm and ~ 0.75 mm deep from the surface of the cortex er within gray matter for M1 and S1, respectively, but the peak was shown in the vicinity of cortical surface in case of GE-BOLD (red-colored). Fig5 shows the results from multi-shot dSE-sequence using 0.8-mm in-plane spatial resolution. The trend of activation pattern and cortical profile from GE-EPI and multi-shot dSE-EPI are almost identical as shown in Fig3.Discussion and Conclusion
We proposed and demonstrated the feasibility of dSE-EPI sequence at UHF to achieve better sensitivity in SE-preparation and achieved 0.8-mm in-plane resolution. The results confirm that dSE-BOLD has higher spatial specificity compared to GE-BOLD and better sensitivity than conventional-SE-BOLD. dSE-BOLD may play an important role in investigating functioning of mesoscopic cortical-circuits with high specificity.Acknowledgements
This work was supported by the Institute of Basic Science under grant IBS-R015-D1.References
[1] Kim SG, Ugurbil K. High-resolution functional magnetic resonance imaging of the animal brain. Methods 2003;30:28–41 doi: 10.1016/S1046-2023(03)00005-7. [2] Zhao F, Wang P, Kim SG. Cortical Depth-Dependent Gradient-Echo and Spin-Echo BOLD fMRI at 9.4T. Magn. Reson. Med. 2004;51:518–524 doi: 10.1002/mrm.10720. [3] Harel N, Lin J, Moeller S, Ugurbil K, Yacoub E. Combined imaging-histological study of cortical laminar specificity of fMRI signals. Neuroimage 2006;29:879–887 doi: 10.1016/j.neuroimage.2005.08.016. [4] Yacoub E, Duong TQ, Van De Moortele PF, et al. Spin-echo fMRI in humans using high spatial resolutions and high magnetic fields. Magn. Reson. Med. 2003;49:655–664 doi: 10.1002/mrm.10433. [5] Yacoub E, Van De Moortele PF, Shmuel A, Uǧurbil K. Signal and noise characteristics of Hahn SE and GE BOLD fMRI at 7 T in humans. Neuroimage 2005;24:738–750 doi: 10.1016/j.neuroimage.2004.09.002. [6] Heid O, Deimling M, Huk W. QUEST ‐ a quick echo split nmr imaging technique. Magn. Reson. Med. 1993;29:280–283 doi: 10.1002/mrm.1910290222. [7] Nelson RJ, Maguire Y, Caputo DF, et al. Counting echoes: Application of a complete reciprocal-space description of NMR spin dynamics. Concepts Magn. Reson. 1998;10:331–341 doi: 10.1002/(SICI)1099-0534(1998)10:6<331::AID-CMR1>3.0.CO;2-Y.Figures