0633
Topographical and Laminar Distribution of Audiovisual Processing within Human Planum Temporale1NIMH, Bethesda, MD, United States, 2University Medical Centre Hamburg-Eppendorf, Hamburg, Germany, 3University of Glasgow, Glasgow, United Kingdom
Synopsis
Multisensory interplay can occur in areas that are commonly considered unisensory, such as planum temporale (PT). The roles of different afferents to PT in multisensory processing are not well understood. Using sub-millimeter fMRI at 7T, we compared laminar activity patterns across topographical subfields of PT under unimodal and multisensory stimuli. We found (1) anterior PT was activated more by auditory inputs and received feedback in superficial layers, likely coming from higher-order multimodal areas; (2) posterior PT was preferentially activated by visual inputs and received visual feedback in both superficial and deep layers, likely projected directly from the early visual cortex.
Introduction
Recent studies suggest that multisensory processing not only occurs in classical multisensory areas1,2, but can also take place in unisensory areas, such as planum temporale (PT), an early auditory brain area3-6. It is not clear how feedforward (auditory) and feedback (auditory/visual) projections to PT are functionally involved in multimodal processing. In this study, we examined topographical distribution of auditory vs. visual processing in PT and the laminar specificity of different projections to subareas of PT.Methods
The experiments were performed on a Siemens MAGNETOM 7T scanner with a Nova single-channel transmit/32-channel receive head coil. For functional measurement, we introduced an integrated blood volume and perfusion (VAPER) contrast7 acquired by combining the blood-suppression module of DANTE pulse trains8 with 3D-EPI9. The sequence was implemented to acquire fMRI images alternating between blood-signal-suppressed (DANTE-prepared 3D-EPI) and blood-signal-augmented (original 3D-EPI as control, can be treated as BOLD signal) conditions. Images were acquired with 0.8x0.8x0.9mm3 resolution, PF 7/8 and GRAPPA 3. Through dynamically subtracting the signal in the blood-suppressed condition from control condition, VAPER contrast is generated to be sensitive to both cerebral-blood-volume (CBV) and cerebral-blood-flow (CBF) while BOLD weighting can be largely attenuated. To remove any remaining BOLD contamination, VAPER time series is further corrected through dynamical division by that of control to factor out the term. For the anatomical reference, we acquired magnetization transfer weighted EPI images using the identical VAPER-3D-EPI sequence with DANTE gradients off10.Ten healthy volunteers were scanned for two to three sessions on different days. Slice position was adjusted to cover auditory cortex in the right hemisphere. A block design was utilized for stimulation (33s-ON/26.4s-fixation). During the ON period, one of three tasks was applied with a random order: audiovisual motion, audio motion or visual motion. For audiovisual motion3, subjects watched a moving ball with a checkerboard texture. At the same time, they heard a series of 20 bass drum with 100ms beat then 50ms gap cycle. Within these 20 periods of sound stimulation, the ball pulsated, resulting in a strong perceptual binding between visual and audio stimuli. Both visual and auditory stimuli moved sinusoidally along the horizontal midline of the screen between 13° of eccentricity in both directions, back and forth, while participants fixed at a white cross below the center. For the unimodal tasks, either audio or visual motionstimulus alone was presented with the same timing.
Motion correction and statistical analysis were performed separately for BOLD and VAPER data. CSF-GM borders and GM-WM borders in PT were manually drawn on the anatomical EPI images. Cortical columns/layers were then generated using the LAYNII software11.
Results and Discussion
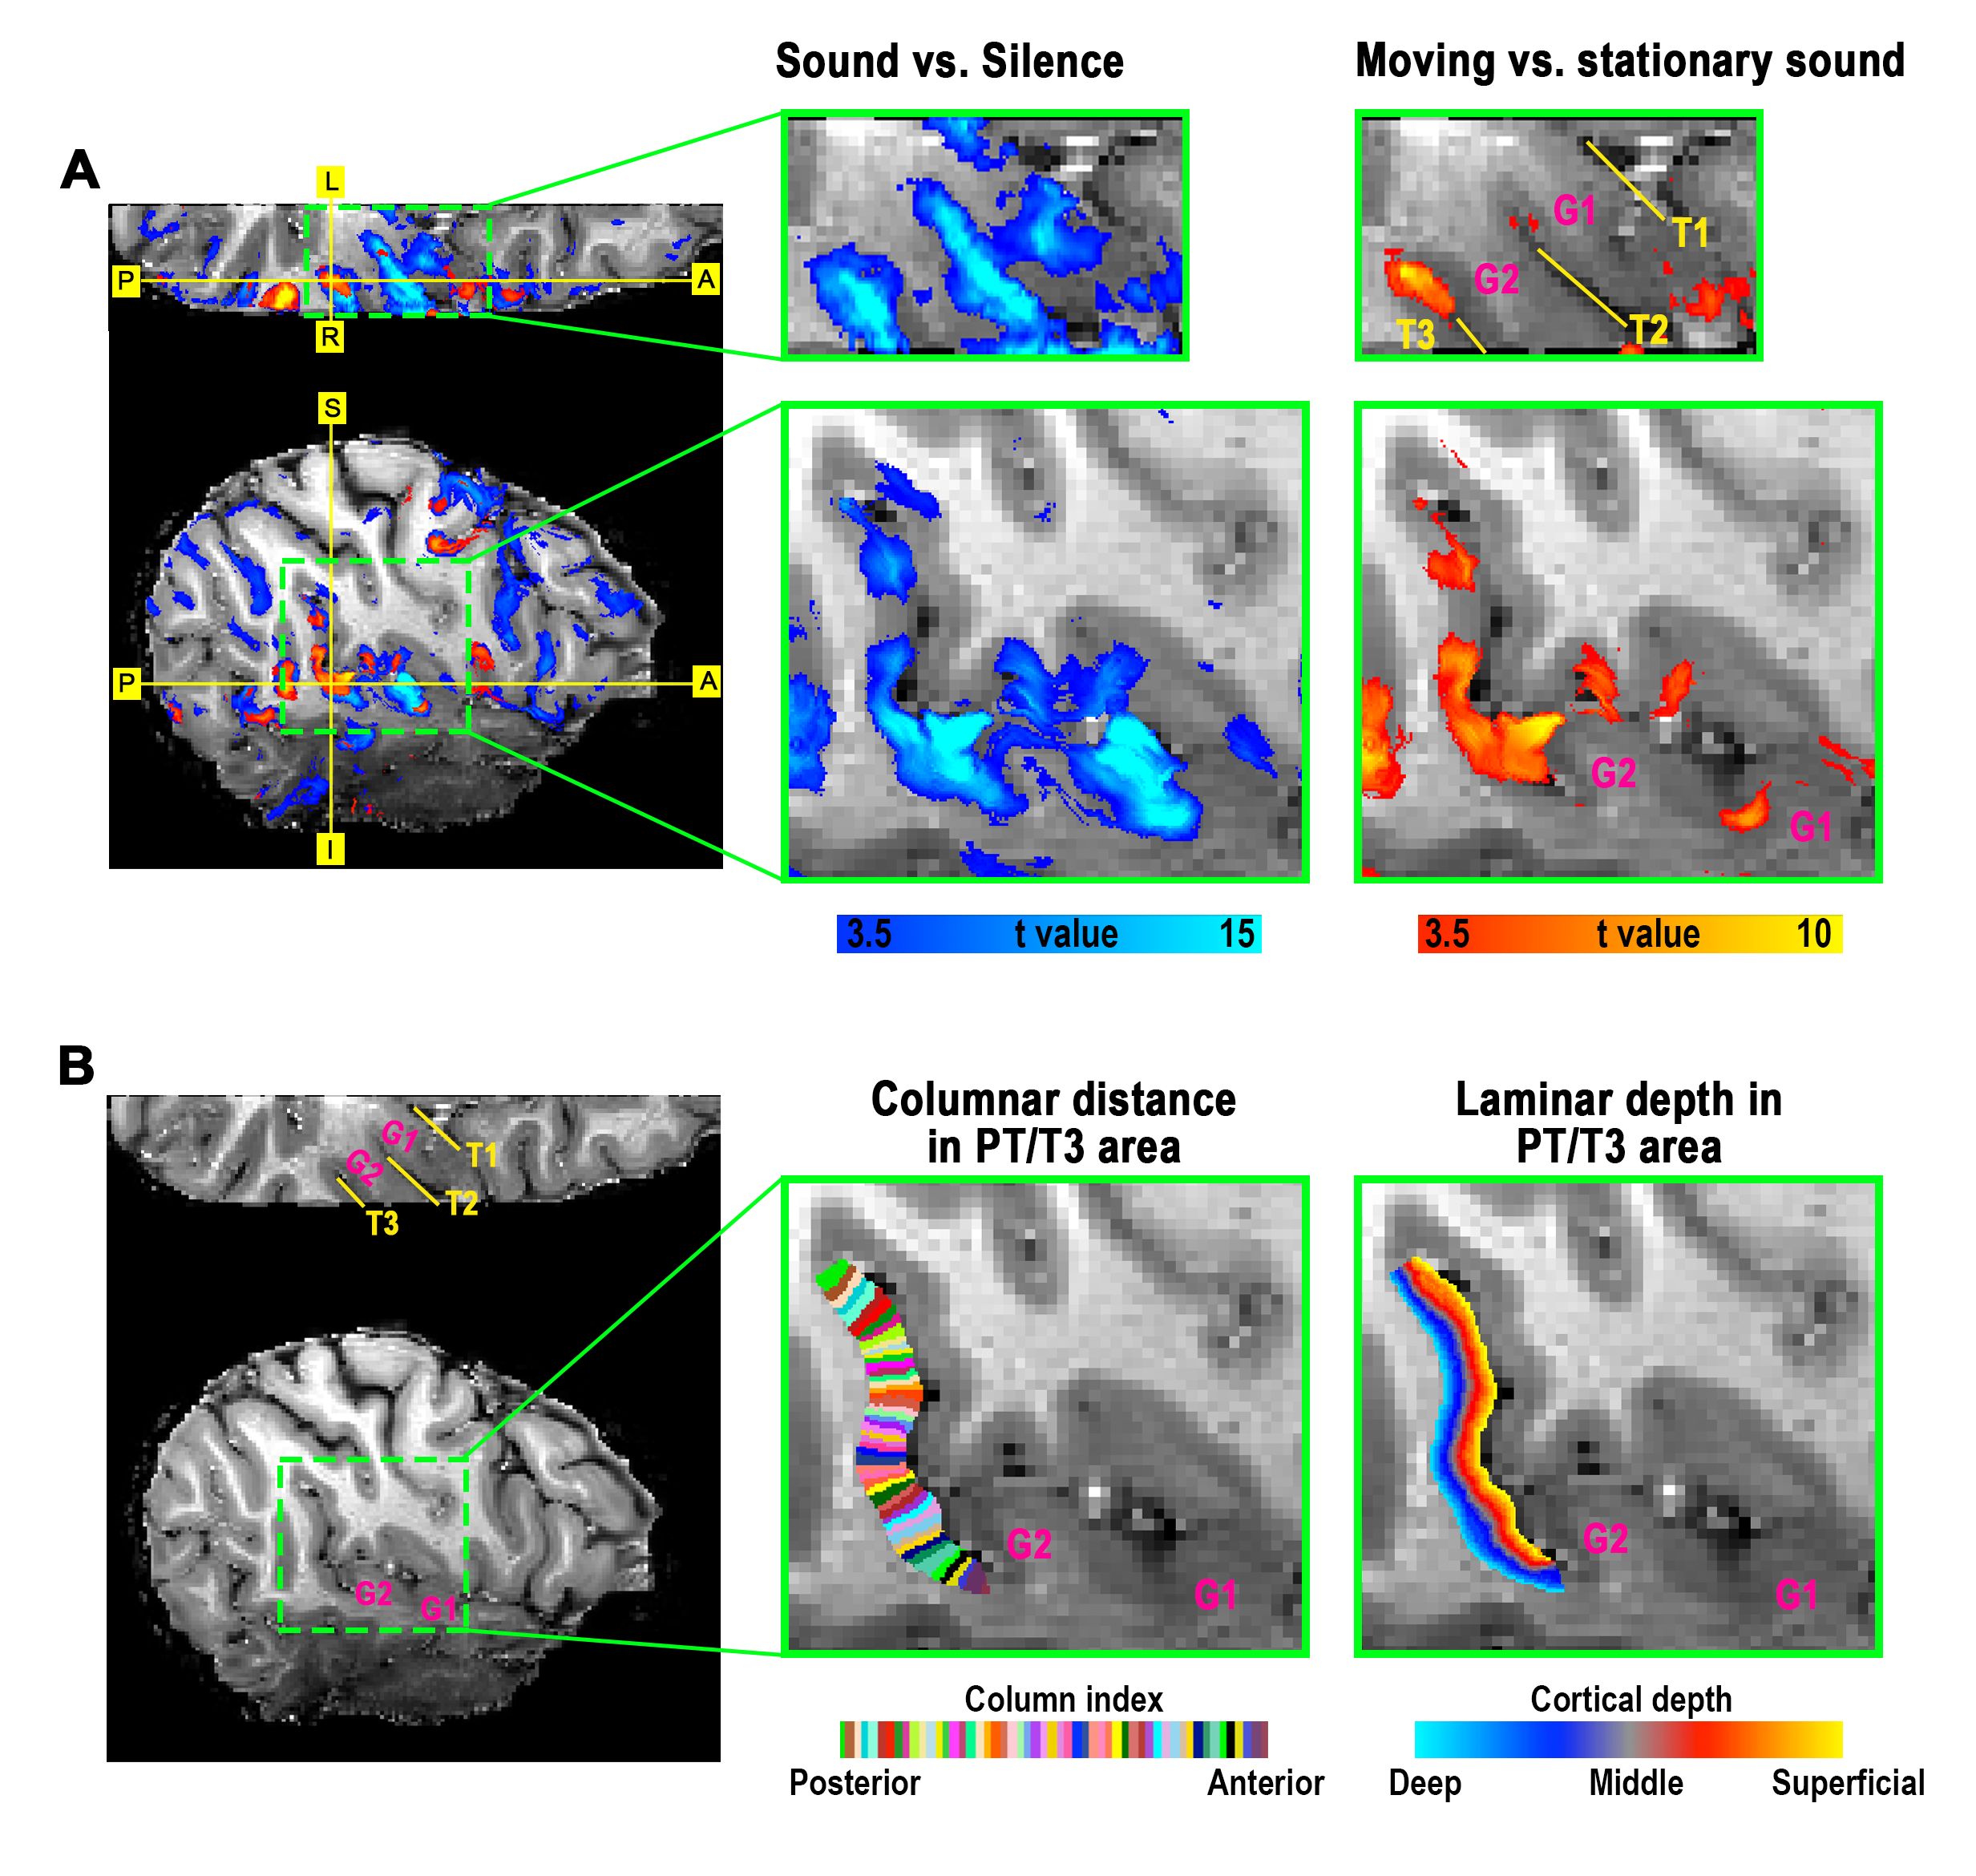
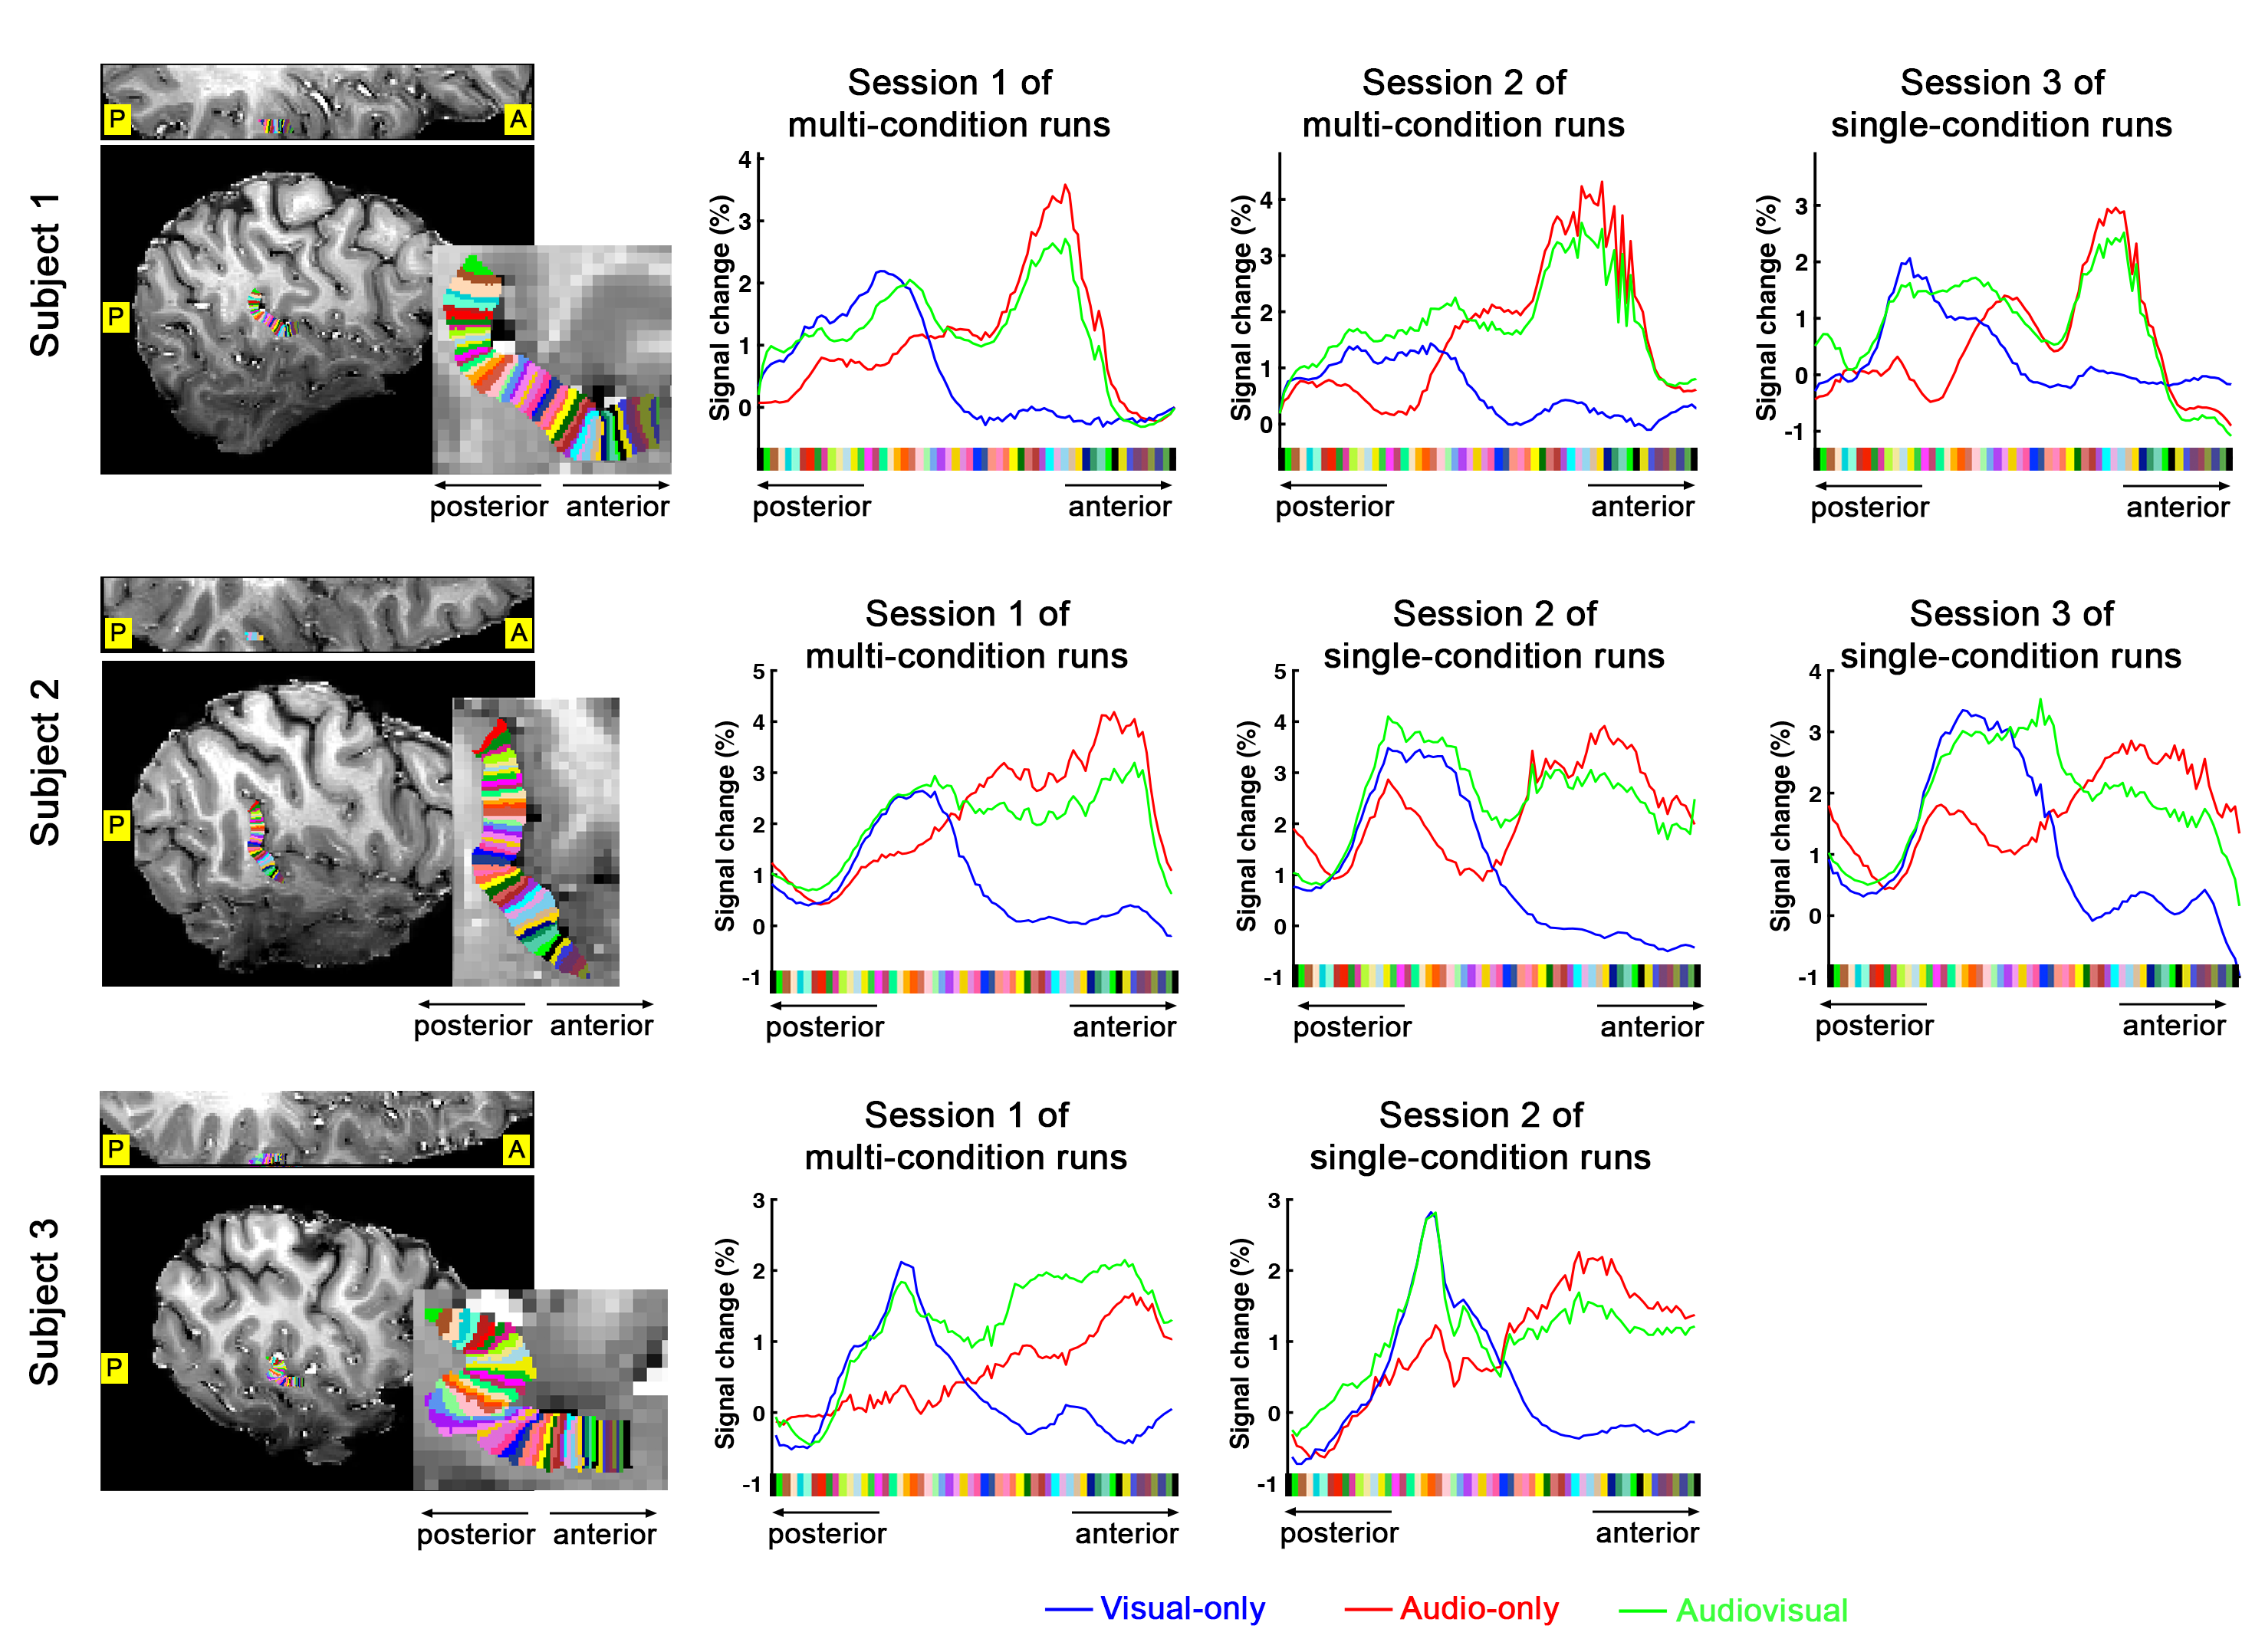
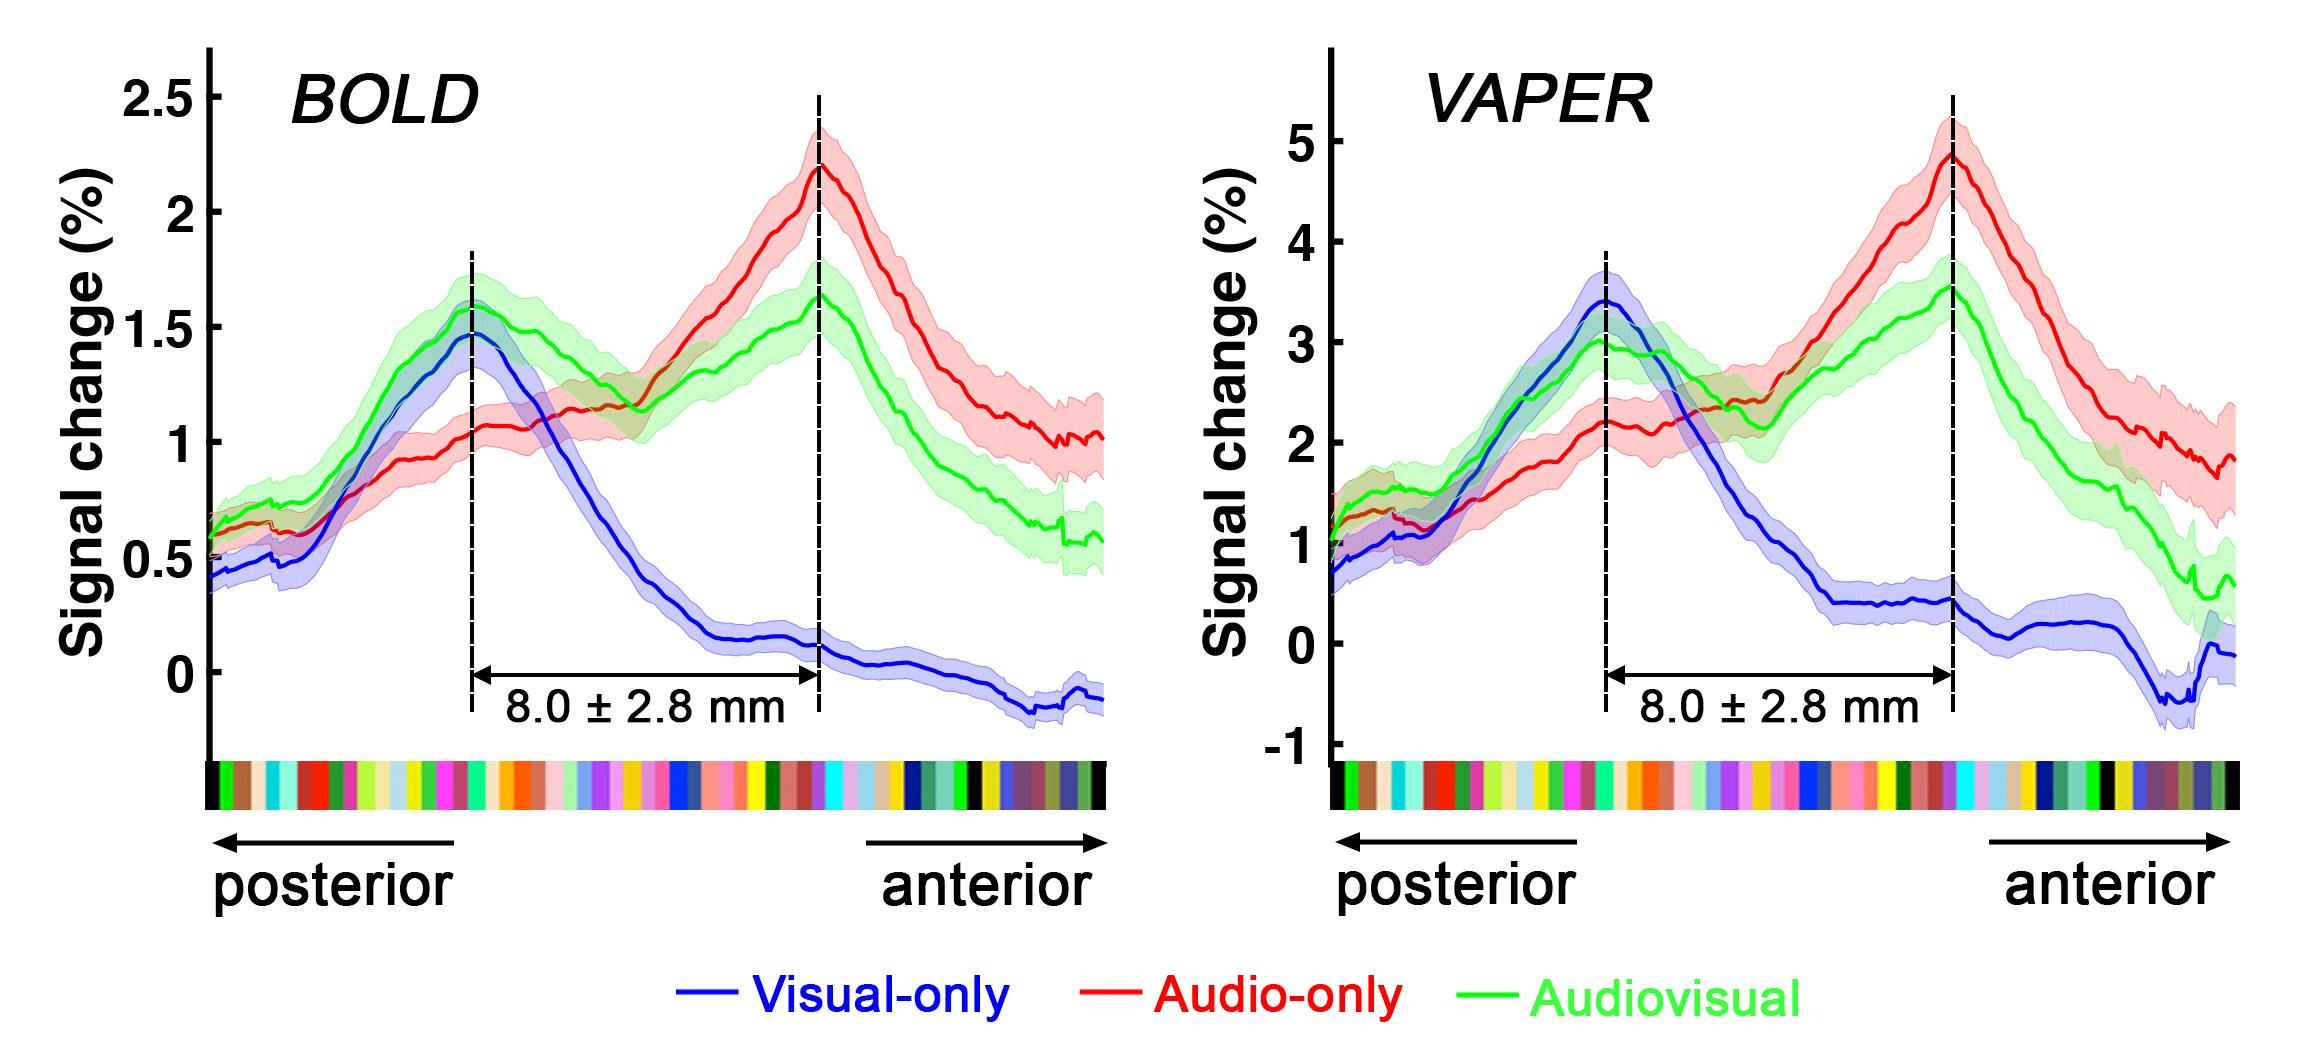
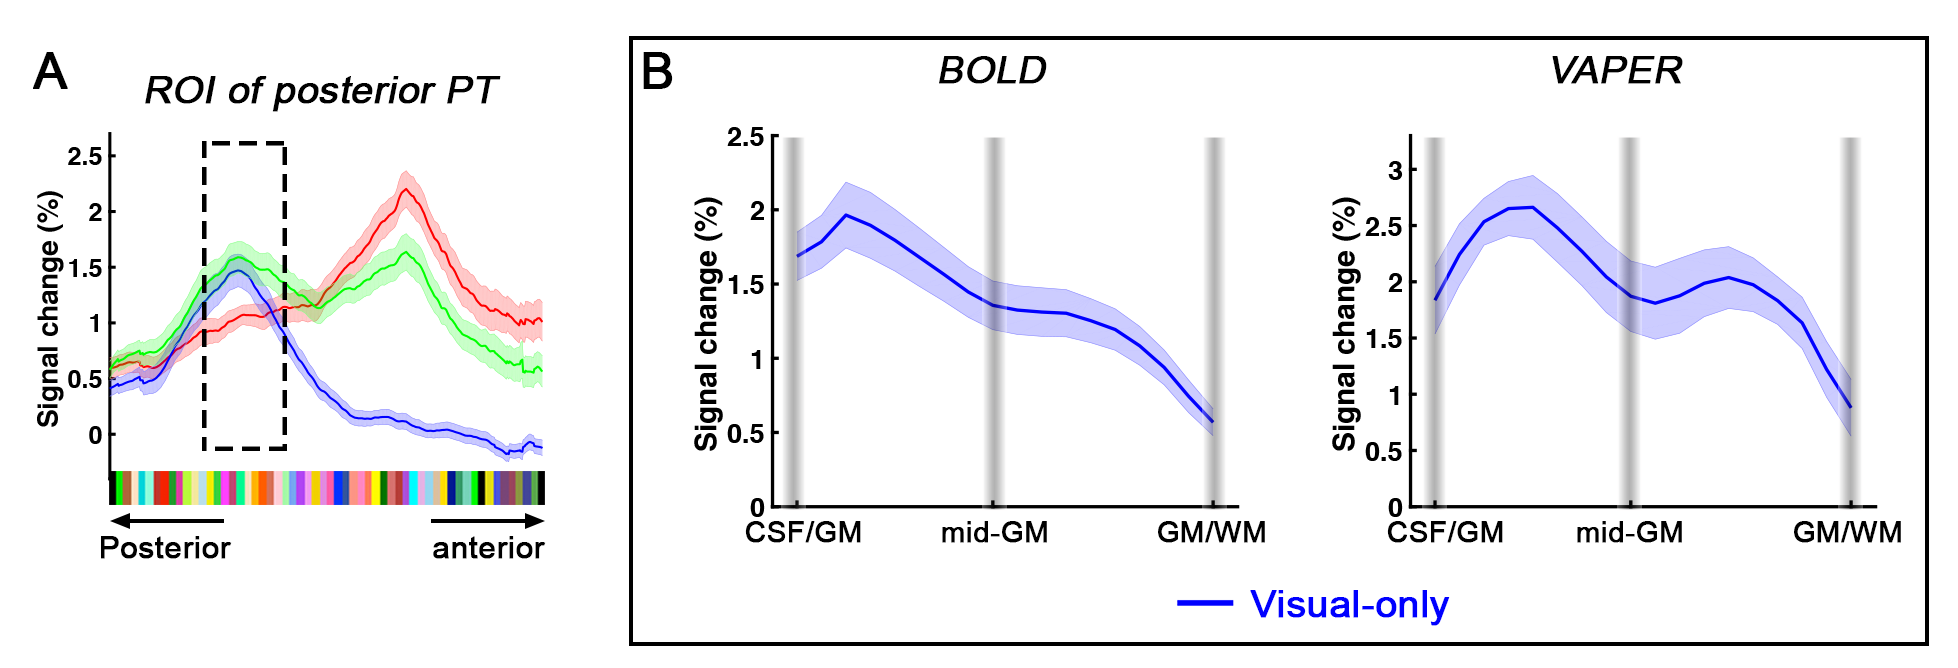
Definition of PT area. (1) Based on the anatomical EPI image (underlays in Fig. 1), auditory cortex can be divided into three sub-fields, as T1, T2, and T3. PT can be identified as the auditory T3 field. (2) PT can also be identified by motion-selective activations in the auditory cortex. Sound with respect to silence led to activity throughout auditory T1, T2 and T3 (blue overlay in Fig. 1A), while moving sound in contrast to stationary sound activated mainly auditory T3 (red overlay in Fig. 1A).Division of function in anterior vs. posterior PT. We found that the topography of visually evoked response was largely segregated from that of auditory induced response within PT. At either individual (Fig. 2) or group level (Fig. 3), we consistently observed that visually-evoked activations (blue curves) were primarily located in posterior PT, whereas auditory-induced activations (red curves) were more pronounced in anterior PT. The group-mean columnar distance between the peaks of auditory and visual representations was 8 ± 2.8 mm along the cortical curvature (Fig. 3).
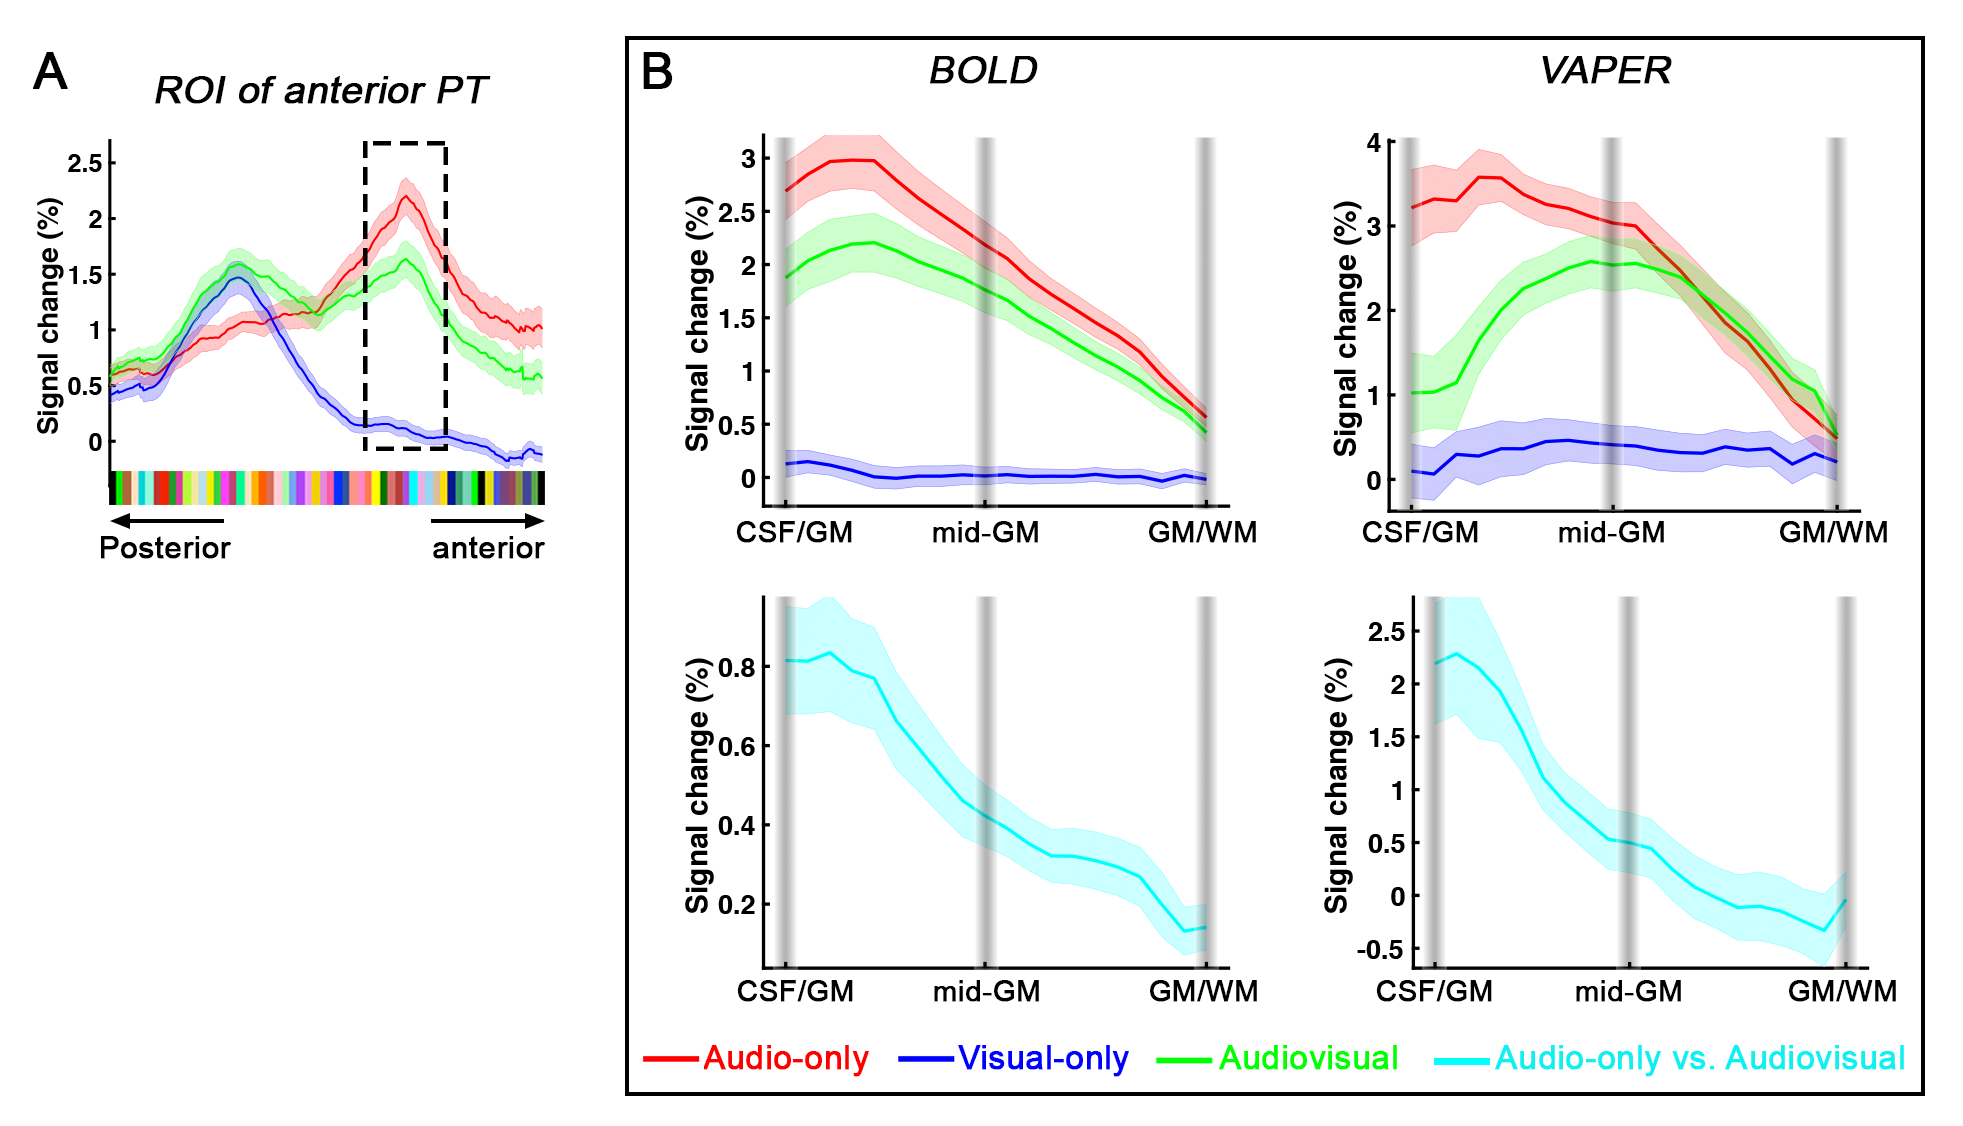
Distinct laminar profiles across subareas of PT. (1) In anterior PT, the laminar profile under VAPER contrast, which has superior laminar specificity, revealed a mixture of feedforward inputs (green curve peaks in middle layers, Fig. 4B top right) cascading from auditory belt area and MGN6,12-15, and enhanced feedback inputs in the audio-only condition. This feedback is likely from high-order multimodal areas, rather than from visual cortex or sub-cortical multisensory nuclei for two reasons. First, there was no significant response to visual inputs in anterior PT (Fig 4B upper, flat blue curves). Second, feedback signals seemed absent when visual input was present concurrently with auditory input (dropped signal change in green curve compared to red curve at superficial layers under VAPER contrast in Figure 4B). (2) In posterior PT, there was a significant bilaminar response to visual input peaking at superficial and deep layers (Fig. 5). In monkey tracing study, Falchier et al.16 found direct connections from early visual areas to auditory cortex, most abundant in temporoparietal area and caudal parabelt (corresponding to PT in humans). These projections originated mainly from infragranular layers, suggestive of a feedback connection which agrees well with the bilaminar activity we observed in posterior PT.
Conclusion
Anterior and posterior PT are specialized in auditory and visual processing respectively. Whereas anterior PT receives feedback modulation in superficial layers, likely from higher-order multimodal areas, posterior PT receives visual feedback in both superficial and deep layers, likely from the early visual cortex directly.Acknowledgements
This work was supported by the Intramural Research Program of the National Institute of Mental Health (annual report ZIAMH002783). We acknowledge Laurentius Huber for helpful discussion, and Benedikt A. Poser for contributions to the 3D-EPI sequence used here.References
1 Schroeder, C. E. & Foxe, J. J. The timing and laminar profile of converging inputs to multisensory areas of the macaque neocortex. Brain Res Cogn Brain Res 14, 187-198 (2002).
2 Guipponi, O. et al. Multimodal Convergence within the Intraparietal Sulcus of the Macaque Monkey. Journal of Neuroscience 33, 4128, doi:10.1523/Jneurosci.1421-12.2013 (2013).
3 Alink, A., Singer, W. & Muckli, L. Capture of auditory motion by vision is represented by an activation shift from auditory to visual motion cortex. The Journal of neuroscience : the official journal of the Society for Neuroscience 28, 2690-2697, doi:10.1523/JNEUROSCI.2980-07.2008 (2008).
4 Foxe, J. J. et al. Auditory-somatosensory multisensory processing in auditory association cortex: an fMRI study. Journal of neurophysiology 88, 540-543, doi:10.1152/jn.2002.88.1.540 (2002).
5 Kayser, C., Petkov, C. I., Augath, M. & Logothetis, N. K. Functional imaging reveals visual modulation of specific fields in auditory cortex. The Journal of neuroscience : the official journal of the Society for Neuroscience 27, 1824-1835, doi:10.1523/JNEUROSCI.4737-06.2007 (2007).
6 Schroeder, C. E. et al. Somatosensory input to auditory association cortex in the macaque monkey. Journal of neurophysiology 85, 1322-1327, doi:10.1152/jn.2001.85.3.1322 (2001).
7 Chai, Y., Li, L., Huber, L., Poser, B. A. & Bandettini, P. A. Integrated VASO and perfusion contrast: A new tool for laminar functional MRI. Neuroimage 207, 116358, doi:10.1016/j.neuroimage.2019.116358 (2020).
8 Li, L. Q., Miller, K. L. & Jezzard, P. DANTE-prepared pulse trains: A novel approach to motion-sensitized and motion-suppressed quantitative magnetic resonance imaging. Magnetic Resonance in Medicine 68, 1423-1438, doi:10.1002/mrm.24142 (2012).
9 Poser, B. A., Koopmans, P. J., Witzel, T., Wald, L. L. & Barth, M. Three dimensional echo-planar imaging at 7 Tesla. Neuroimage 51, 261-266, doi:10.1016/j.neuroimage.2010.01.108 (2010).
10 Chai, Y. et al. A magnetization transfer weighted anatomical reference allows laminar fMRI analysis in native functional image space. (2019).
11 Huber, L. et al. LAYNII: A software suite for layer-fMRI. bioRxiv, 2020.2006.2012.148080, doi:10.1101/2020.06.12.148080 (2020).
12 Hackett, T. A. et al. Feedforward and feedback projections of caudal belt and parabelt areas of auditory cortex: refining the hierarchical model. Front Neurosci 8, 72, doi:10.3389/fnins.2014.00072 (2014).
13 Hackett, T. A. Information flow in the auditory cortical network. Hear Res 271, 133-146, doi:10.1016/j.heares.2010.01.011 (2011).
14 Hackett, T. A. et al. Multisensory convergence in auditory cortex, II. Thalamocortical connections of the caudal superior temporal plane. J Comp Neurol 502, 924-952, doi:10.1002/cne.21326 (2007).
15 Hackett, T. A., Stepniewska, I. & Kaas, J. H. Subdivisions of auditory cortex and ipsilateral cortical connections of the parabelt auditory cortex in macaque monkeys. J Comp Neurol 394, 475-495, doi:10.1002/(sici)1096-9861(19980518)394:4<475::aid-cne6>3.0.co;2-z (1998).16 Falchier, A. et al. Projection from visual areas V2 and prostriata to caudal auditory cortex in the monkey. Cereb Cortex 20, 1529-1538, doi:10.1093/cercor/bhp213 (2010).
Figures