0621
Fully Integrated Scanner Implementation of Direct Signal Control for 2D T2-Weighted TSE at Ultra-High Field1MR Research Collaborations, Siemens Healthcare Limited, Frimley, United Kingdom, 2Biomedical Engineering Department, School of Biomedical Engineering and Imaging Sciences, King's College London, London, United Kingdom, 3Centre for the Developing Brain, School of Biomedical Engineering and Imaging Sciences, King's College London, London, United Kingdom, 4Institute of Radiology, University Hospital Erlangen, Erlangen, Germany, 5Institute of Neuroradiology, University Hospital Erlangen, Erlangen, Germany, 6Siemens Healthcare GmbH, Erlangen, Germany, 7School of Biomedical Engineering and Imaging Sciences, King's College London, London, United Kingdom
Synopsis
Direct Signal Control (DSC) uses parallel transmission (pTx) with more flexibility than conventional static RF shimming to tackle RF inhomogeneity at ultra-high field in fast spin echo (FSE) sequences by varying complex weights of successive RF pulses independently along the refocusing train. Also, unlike other dynamic pTx methods, it preserves RF pulse properties and sequence timing. This work demonstrates the applicability of DSC in routine conditions for neuroimaging, with minimal workflow disruption. In-vivo T2-weighted FSE results exhibit higher signal and better homogeneity when using DSC over RF shimming, while explicitly ensuring safe operation.
Introduction
Transmit radiofrequency (RF) field ($$$B_1^+$$$) inhomogeneity is a challenge at 7T, especially for specific absorption rate (SAR) demanding sequences such as 2D fast spin echo1 (FSE). Previously, this has been tackled using parallel transmission and adjusting complex weights on each channel2 (static RF shimming, [RFShim]), or by using combinations of RF and gradients to target a specific flip angle (FA) (SPINS3, kT‑points4,5, spokes6). Alternatively, direct signal control7,8 (DSC), which has previously been experimentally applied to 2D9 and 3D7 FSE, leverages the degrees of freedom offered by the multiple refocusing pulses in FSE to dynamically adjust RF shimming and target homogeneous signal – with no impact on pulse shapes or sequence timing. In this work we show first results of an optimised and fully integrated implementation of DSC to 2D FSE brain imaging, under SAR control.Methods
EnvironmentAll experiments were performed on a MAGNETOM Terra (Siemens Healthcare, Erlangen, Germany) 7T scanner in research configuration, with an 8-Tx-channel head coil (Nova Medical, Wilmington MA, USA). Human subject scanning was approved by the Institutional Research Ethics Committee (HR-18/19-8700).
The scanner allowed for fully integrated field mapping and pulse design, happening in the background as part of the pre-acquisition adjustment steps. A FA map for each transmit channel was automatically acquired at a 4.0x4.0x10.0 mm3 resolution using saturation-prepared turbo FLASH10 (satprepTFL). Then, the scanner’s built-in pulse design environment was launched in the background during sequence adjustments.
Imaging was performed under first level SAR supervision on five healthy volunteers with the following T2w 2D FSE protocol: TE/TR = 79/5500 ms; echo spacing: 9.88 ms; echo train length: 11; 576x365 matrix, 0.36x0.48 mm2 in-plane resolution; 34 transversal slices, 3 mm thickness; GRAPPA 3.
DSC Description and Comparison
DSC was assessed against RFShim in a 2D FSE imaging experiment. For RFShim, excitation used a 90° pulse and refocusing was performed under CPMG conditions11,12 at 135° (157.5° for the first refocusing). A set of RF complex weights was determined and applied to all pulses using the vendor’s $$$B_1^+$$$ shimming technique, which solves a magnitude least-squares problem to minimise the spread of FA values in the field of view, within 130% of circular polarisation (CP) mode SAR.
DSC used an RFShim as starting point for the optimisation, then further tuned complex RF weights of each pulse independently to minimise signal differences from a target signal evolution9, solving:
$$
\DeclareMathOperator*{\argmin}{arg\,min}\qquad\qquad\argmin_{W}\sum_t\sum_v\sum_e{c_e\left\Vert\frac{s_{t,v,e}(W)-\hat{s}_{t,v,e}}{\Vert\hat{s}_{t,v,e}\Vert_1}\right\Vert}_2^2\qquad\qquad(1)\\[2em]\qquad\qquad\textrm{s.t. hardware and physiological constraints}
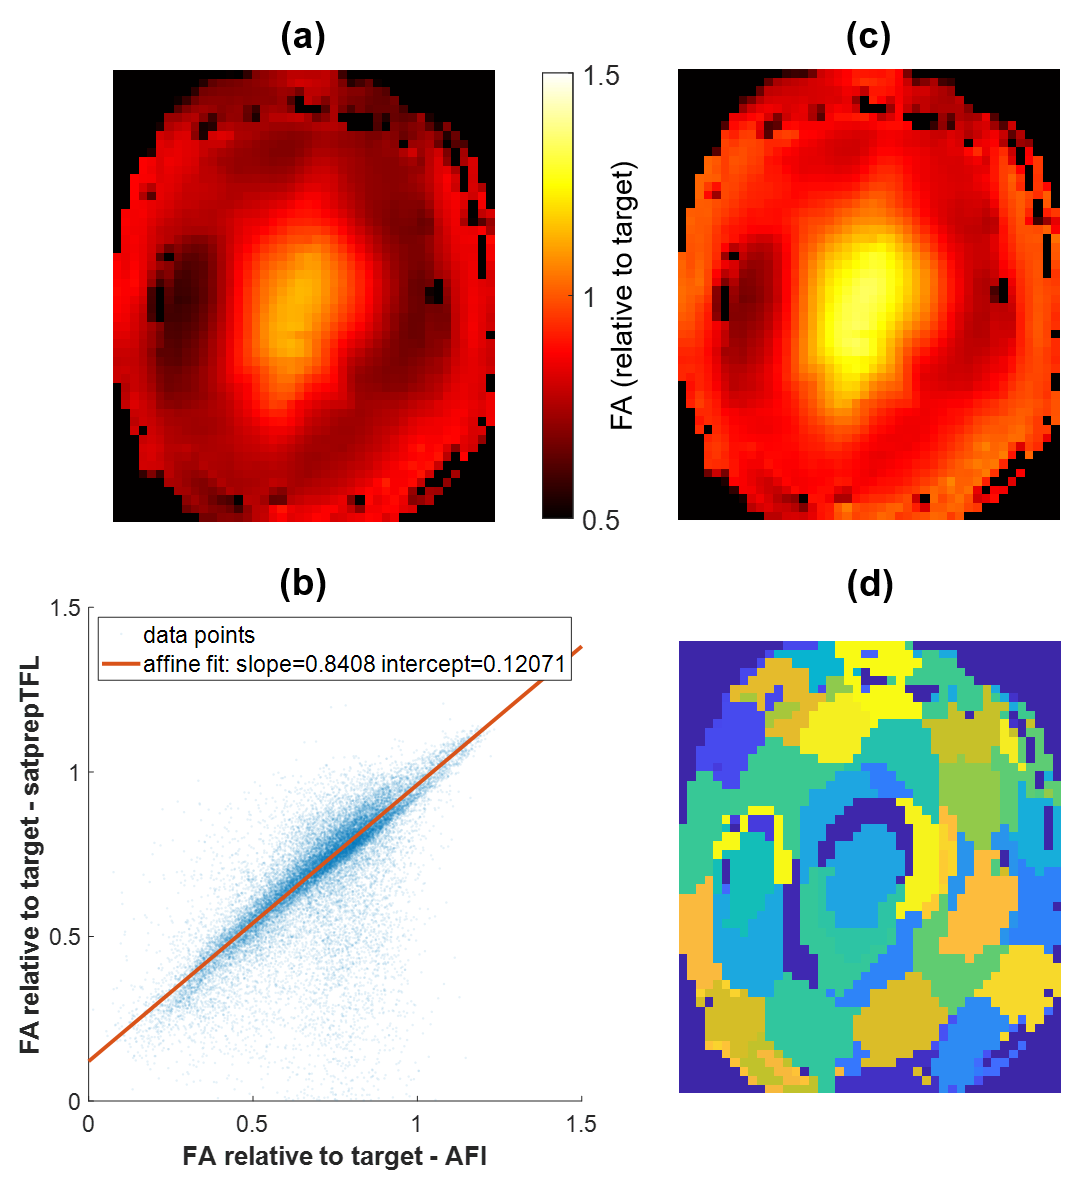
$$with $$$t$$$, $$$v$$$ and $$$e$$$ indexing respectively tissues considered, spatial locations and echo numbers in the refocusing train; $$$\hat{s}_{t,v,e}$$$ the target signal, $$$s_{t,v,e}$$$ the simulated signal depending on $$$W$$$ the matrix of complex weights applied to different pulses and channels; $$$c_e$$$ a weighting coefficient adjusting the contribution of each echo to the optimisation problem – here $$$c_e=0$$$ for early echoes, and $$$c_e$$$ linearly increases towards $$$e=8$$$ (k-space centre). $$$s_{t,v,e}$$$ and $$$\hat{s}_{t,v,e}$$$ were computed using the extended phase graph representation8. To preserve contrast two tissues were considered: grey matter (T1/T2 = 2000/100 ms) and cerebrospinal fluid (T1/T2 = 4400/2000 ms). To accelerate the calculation time 150 voxels were picked for signal optimisation via k‑means clustering as shown in Figure 1(d). Analytical derivatives of the cost-function and constraints were used. With a 50-iterations cap, optimisation times were about 1 min.
$$$B_1^+$$$ Map Correction
Since DSC relies on signal calculations, with errors propagating along the echo train, a prior investigation studied systematic errors in satprepTFL related to its transient readout. The actual FA imaging (AFI) sequence13,14 was found more accurate but lengthier; it helped determine an experimental correction applied to satprepTFL. Figure 1 shows a scatter plot exhibiting affine relationship between the AFI and satprepTFL in a healthy volunteer. The following empirical correction was applied to relative CP mode $$$B_1^+$$$ maps ($$$\dot{\alpha}_{\mathrm{measured}}$$$):
$$
\qquad\qquad\qquad\dot{\alpha}_{\mathrm{corrected}}=1.18\,\dot{\alpha}_{\mathrm{measured}}-0.14\qquad\qquad\qquad(2)
$$
The corrected CP maps ($$$\dot{\alpha}_{\mathrm{corrected}}$$$) were then back-projected into per-channel maps. The quality and usefulness of the correction was assessed in simulation and in a DSC measurement.
Quality Assessment
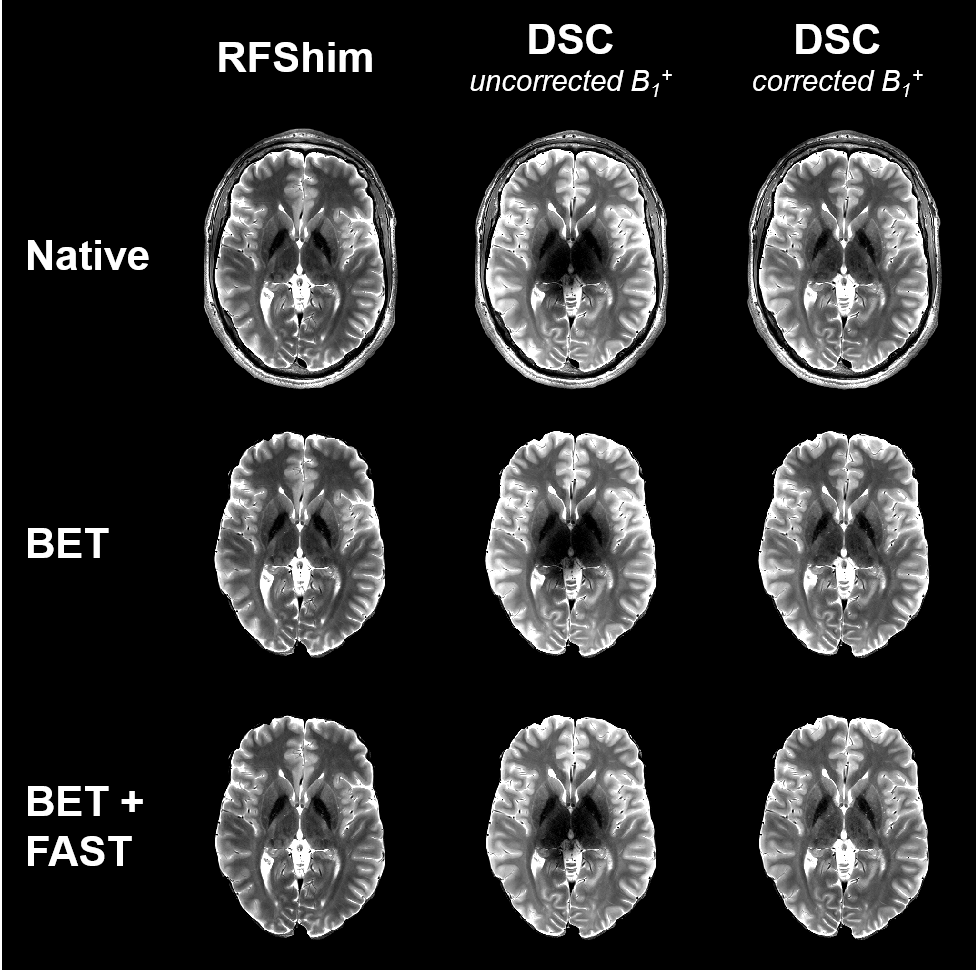
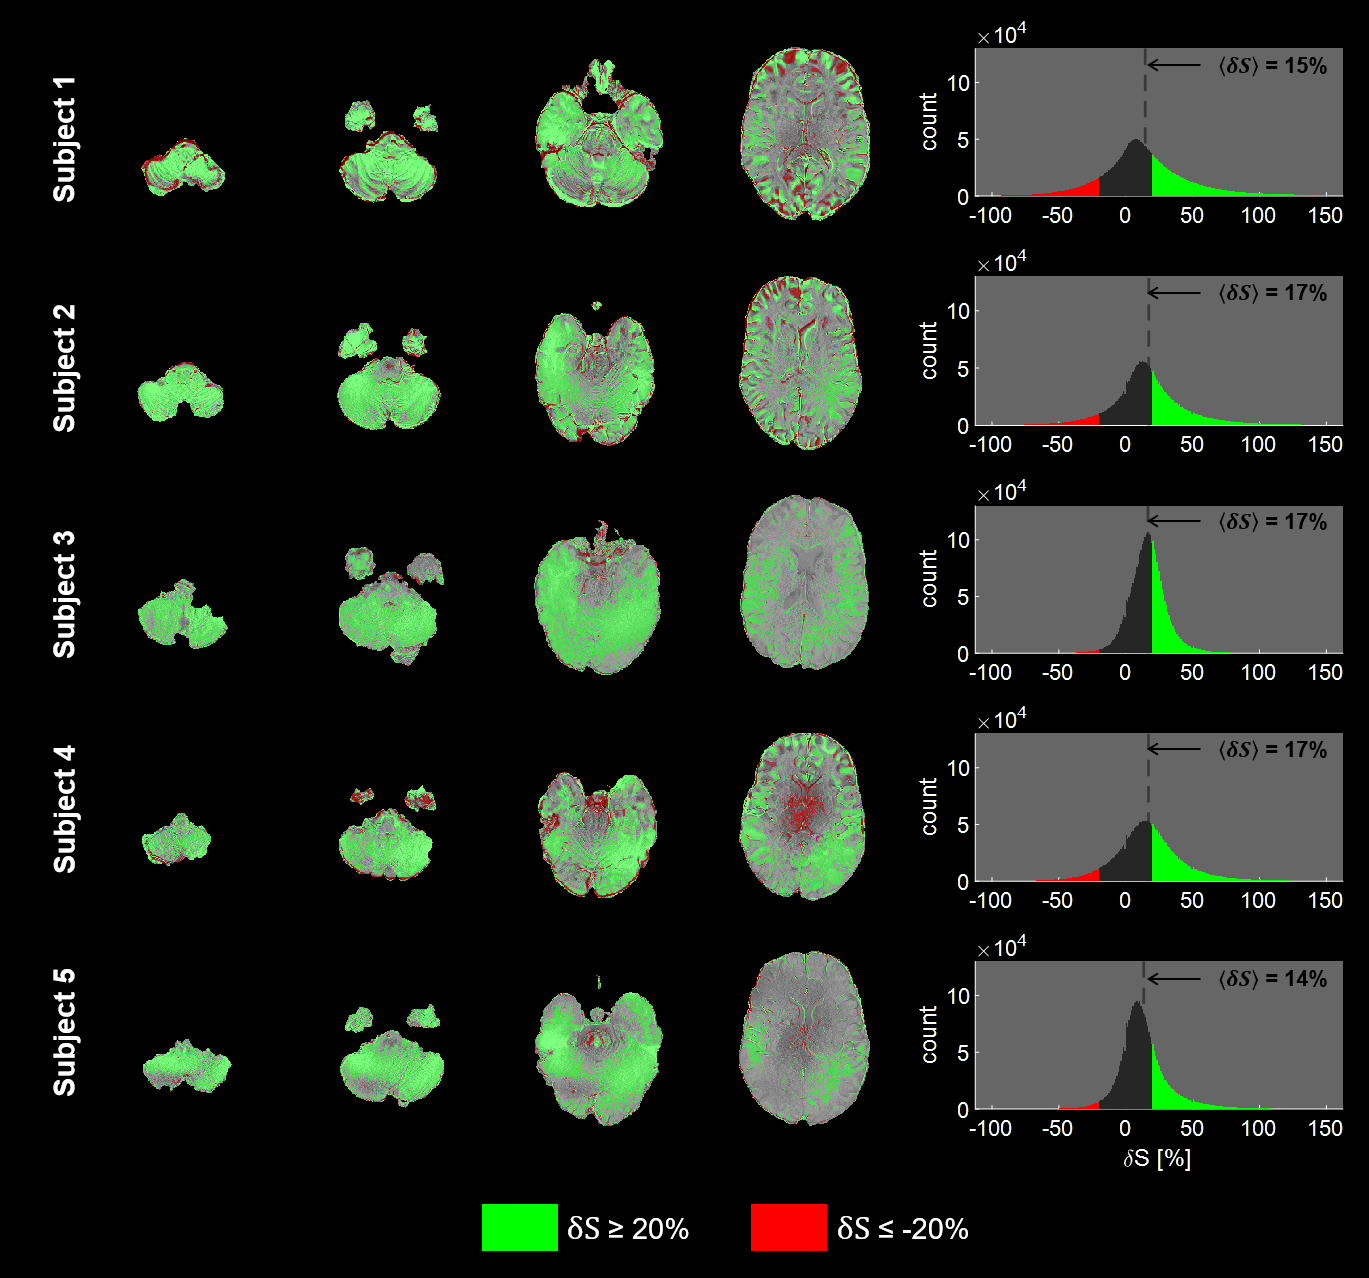
For result comparison, native images were brain-extracted with FSL15–17 BET, then bias field correction was applied with FSL FAST to reduce the effect of reception profile (Figure 2). For a quantitative comparison between RFShim and DSC signals (respectively $$$S_\mathrm{RFShim}$$$ and $$$S_\mathrm{DSC}$$$), relative signal difference was calculated from brain-extracted images as:
$$
\qquad\qquad\qquad\qquad\delta{S}=\frac{S_\mathrm{DSC}-S_\mathrm{RFShim}}{S_\mathrm{RFShim}}\qquad\qquad\qquad\qquad(3)
$$Average values were reported for each subject.
Results
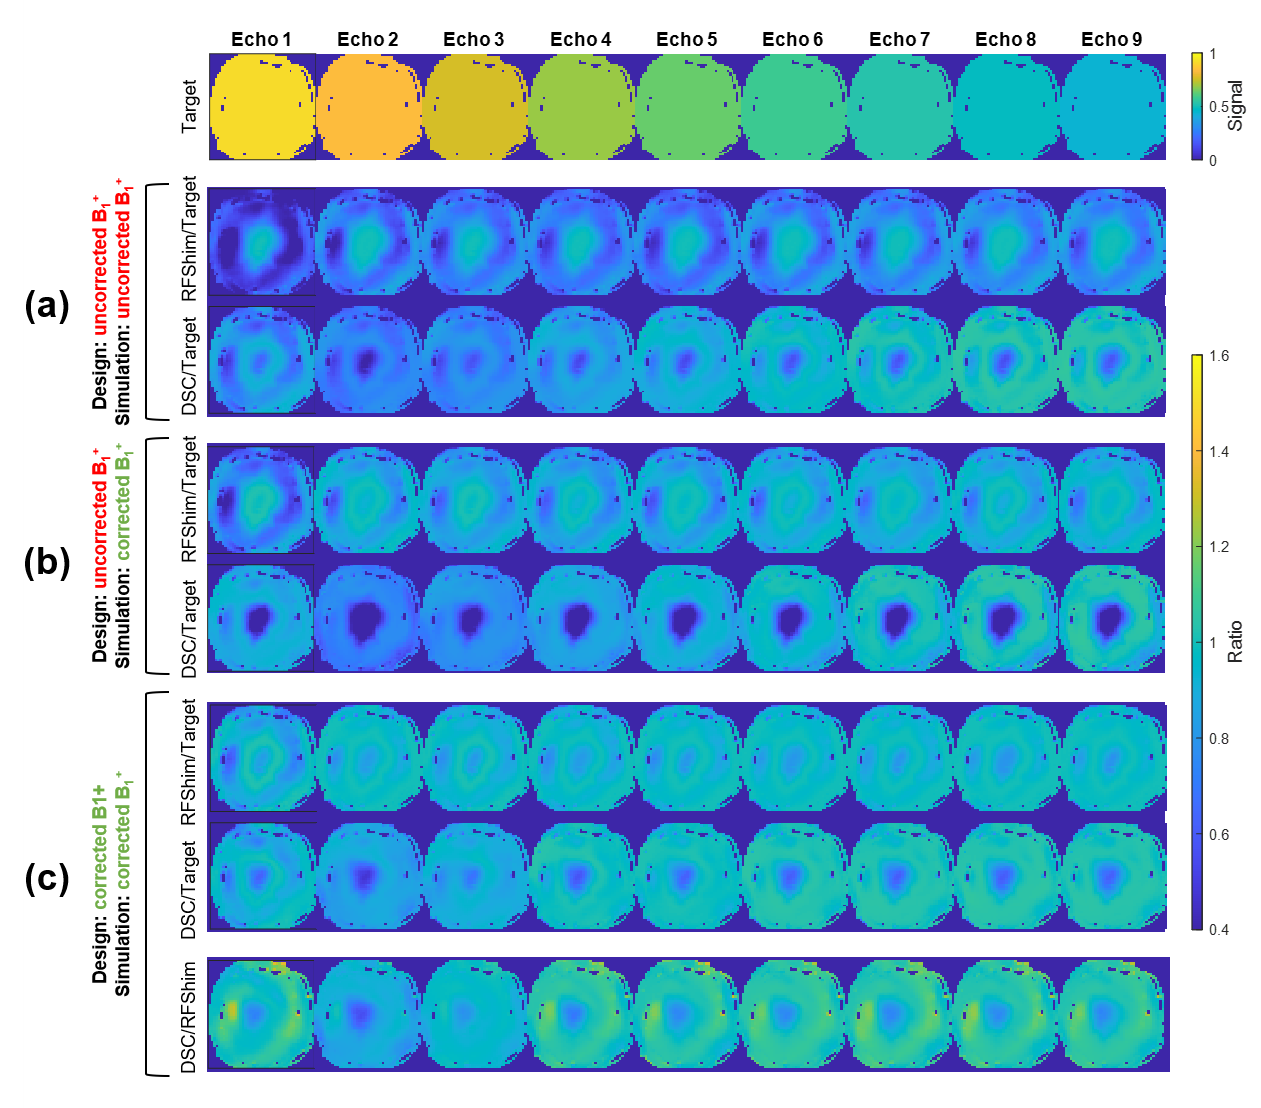
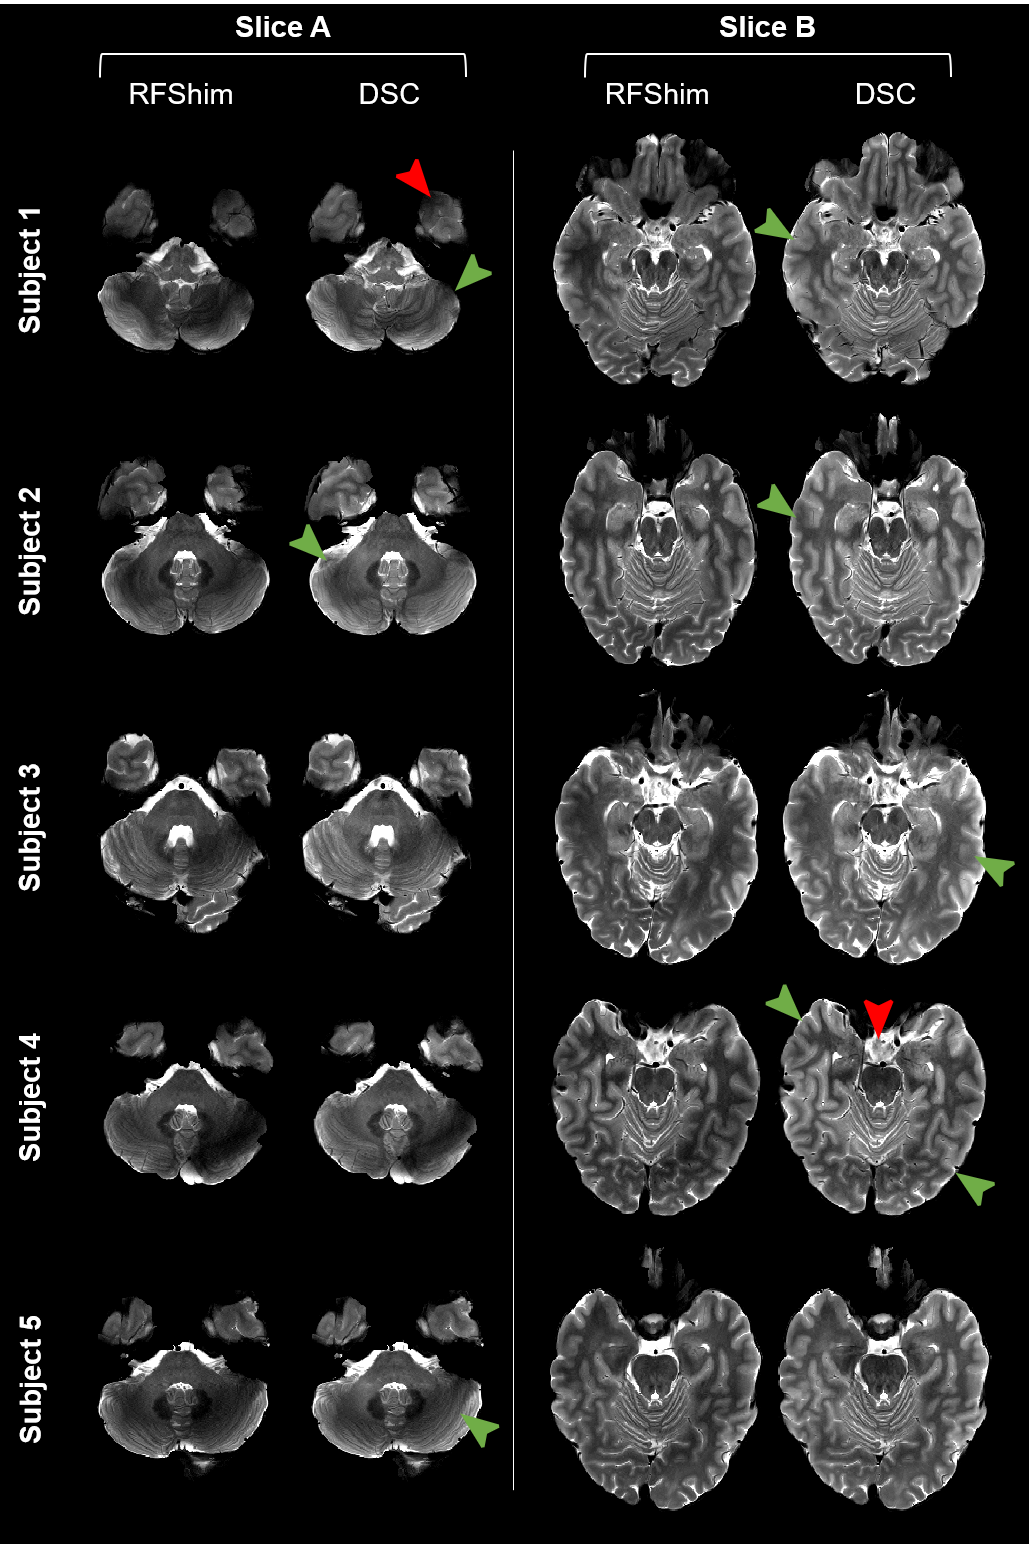
Figure 3 highlights the importance of $$$B_1^+$$$ correction, especially for DSC; this is visible in Figure 2 too. Figure 4 provides visual comparison of signal homogeneity and contrast in images acquired with RFShim and DSC. DSC shows superior homogeneity in lower brain areas, while preserving image quality in upper regions, under controlled SAR. This is also confirmed quantitatively in Figure 5, where DSC exhibits net signal gain over RFShim in all subjects, with average across subjects. Subject-averaged peak local SAR was 94% (SD: 6%) of limit for RFShim and 98% (SD: 3%) for DSC.Conclusion
We have shown the effectiveness of DSC in providing better imaging quality than RFShim for 2D T2w TSE in routine conditions. Future developments will include better $$$B_1^+$$$ correction and measurement, tackle more weightings and investigate slice-by-slice optimisation.Acknowledgements
The authors wish to thank Alexis Amadon and Franck Mauconduit (NeuroSpin, CEA Paris-Saclay, Gif-sur-Yvette, France) for providing the AFI sequence and reconstruction.
This work was supported by a Wellcome Trust collaboration in science award [WT201526/Z/16/Z], by core funding from the Wellcome/EPSRC Centre for Medical Engineering [WT203148/Z/16/Z] and by the National Institute for Health Research (NIHR) Biomedical Research Centre based at Guy’s and St Thomas’ NHS Foundation Trust and King’s College London and/or the NIHR Clinical Research Facility. The views expressed are those of the author(s) and not necessarily those of the NHS, the NIHR or the Department of Health and Social Care.
References
1. Hennig J, Nauerth A, Friedburg H. RARE imaging: A fast imaging method for clinical MR. Magn Reson Med. 1986;3(6):823–33.
2. Padormo F, Beqiri A, Hajnal JV, Malik SJ. Parallel transmission for ultrahigh-field imaging. NMR Biomed. 2016 Sep 1;29(9):1145–61.
3. Malik SJ, Keihaninejad S, Hammers A, Hajnal JV. Tailored excitation in 3D with spiral nonselective (SPINS) RF pulses. Magn Reson Med. 2012 May 1;67(5):1303–15.
4. Cloos MA, Boulant N, Luong M, Ferrand G, Giacomini E, Le Bihan D, et al. kT-points: Short three-dimensional tailored RF pulses for flip-angle homogenization over an extended volume. Magn Reson Med. 2012 Jan;67(1):72–80.
5. Amadon A, Cloos MA. Method and apparatus for compensating for B1 inhomogeneity in magnetic resonance imaging by nonselective tailored RF pulses. WO2011/128847A1, 2011.
6. Saekho S, Yip C, Noll DC, Boada FE, Stenger VA. Fast-kz three-dimensional tailored radiofrequency pulse for reduced B1 inhomogeneity. Magn Reson Med. 2006 Apr;55(4):719–24.
7. Malik SJ, Beqiri A, Padormo F, Hajnal JV. Direct signal control of the steady-state response of 3D-FSE sequences. Magn Reson Med. 2015 Mar 1;73(3):951–63.
8. Malik SJ, Padormo F, Price AN, Hajnal JV. Spatially resolved extended phase graphs: Modeling and design of multipulse sequences with parallel transmission. Magn Reson Med. 2012 Nov 1;68(5):1481–94.
9. Sbrizzi A, Hoogduin H, Hajnal JV, van den Berg CAT, Luijten PR, Malik SJ. Optimal control design of turbo spin-echo sequences with applications to parallel-transmit systems: Optimal Control of TSE Sequences. Magn Reson Med. 2017 Jan;77(1):361–73.
10. Fautz HP, Vogel M, Gross P, Kerr A, Zhu Y. B1 mapping of coil arrays for parallel transmission. In: Proceedings of the 16th Annual Meeting of ISMRM, Toronto, Canada [Internet]. 2008. p. 1247. Available from: http://cds.ismrm.org/ismrm-2008/files/01247.pdf
11. Carr HY, Purcell EM. Effects of diffusion on free precession in nuclear magnetic resonance experiments. Phys Rev. 1954;94(3):630.
12. Meiboom S, Gill D. Modified spin-echo method for measuring nuclear relaxation times. Rev Sci Instrum. 1958;29(8):688–691.
13. Yarnykh VL. Actual flip-angle imaging in the pulsed steady state: A method for rapid three-dimensional mapping of the transmitted radiofrequency field. Magn Reson Med. 2007 Jan;57(1):192–200.
14. Nehrke K. On the steady-state properties of actual flip angle imaging (AFI). Magn Reson Med. 2009 Jan;61(1):84–92.
15. Woolrich MW, Jbabdi S, Patenaude B, Chappell M, Makni S, Behrens T, et al. Bayesian analysis of neuroimaging data in FSL. NeuroImage. 2009 Mar;45(1):S173–86.
16. Smith SM, Jenkinson M, Woolrich MW, Beckmann CF, Behrens TEJ, Johansen-Berg H, et al. Advances in functional and structural MR image analysis and implementation as FSL. NeuroImage. 2004 Jan;23:S208–19.
17. Jenkinson M, Beckmann CF, Behrens TEJ, Woolrich MW, Smith SM. FSL. NeuroImage. 2012 Aug;62(2):782–90.
Figures