0619
Approaching Real-Time Patient-Specific SAR Calculation for Parallel Transmission at 7 Tesla1Athinoula A. Martinos Center for Biomedical Imaging, Charlestown, MA, United States, 2Harvard Medical School, Boston, MA, United States, 3Dept. of Electrical Engineering and Computer Science, Massachusetts Institute of Technology, Cambridge, MA, United States, 4Medical Image Analysis and Biometry Laboratory, Universidad Rey Juan Carlos, Madrid, Spain, 5Harvard-MIT Division of Health Sciences and Technology, Cambridge, MA, United States
Synopsis
Current parallel transmission protocols have conservative safety limits due to offline simulations of generic body models. Instead, a personalized medicine approach should be used, whereby the patient-specific SAR is calculated as the patient lies on the table. In this way, more accurate, and hopefully less conservative safety limits can be employed. In this study, we develop a fast methodology for patient-specific SAR calculations with an 8 channel pTx head coil at 7T. We show a real-time approach in 6 volunteers for scanning the patient, segmenting the body, and performing an electromagnetic simulation in order to generate the local SAR maps.
Introduction
The local specific absorption rate (SAR) is currently verified in parallel transmission (pTx) systems by using virtual observation points, which are calculated from computed SAR matrices of a range of generic body models (1). This approach is the current standard in pTx examinations and provides protocols that are safe, but also conservative. To overcome this limitation without sacrificing safety, a personalized approach is preferred, whereby the local SAR of the specific patient being imaged is computed in real-time and subsequently used throughout the examination (psSAR). One way to achieve this is to use deep learning (2). Another method, which we have proposed previously for a single channel, birdcage coil at 3T, is to use an ultra-fast electromagnetic solver on patient-derived body models (3). Here, we extend our fast modeling methodology to 7T and pTx in six volunteers.Methods
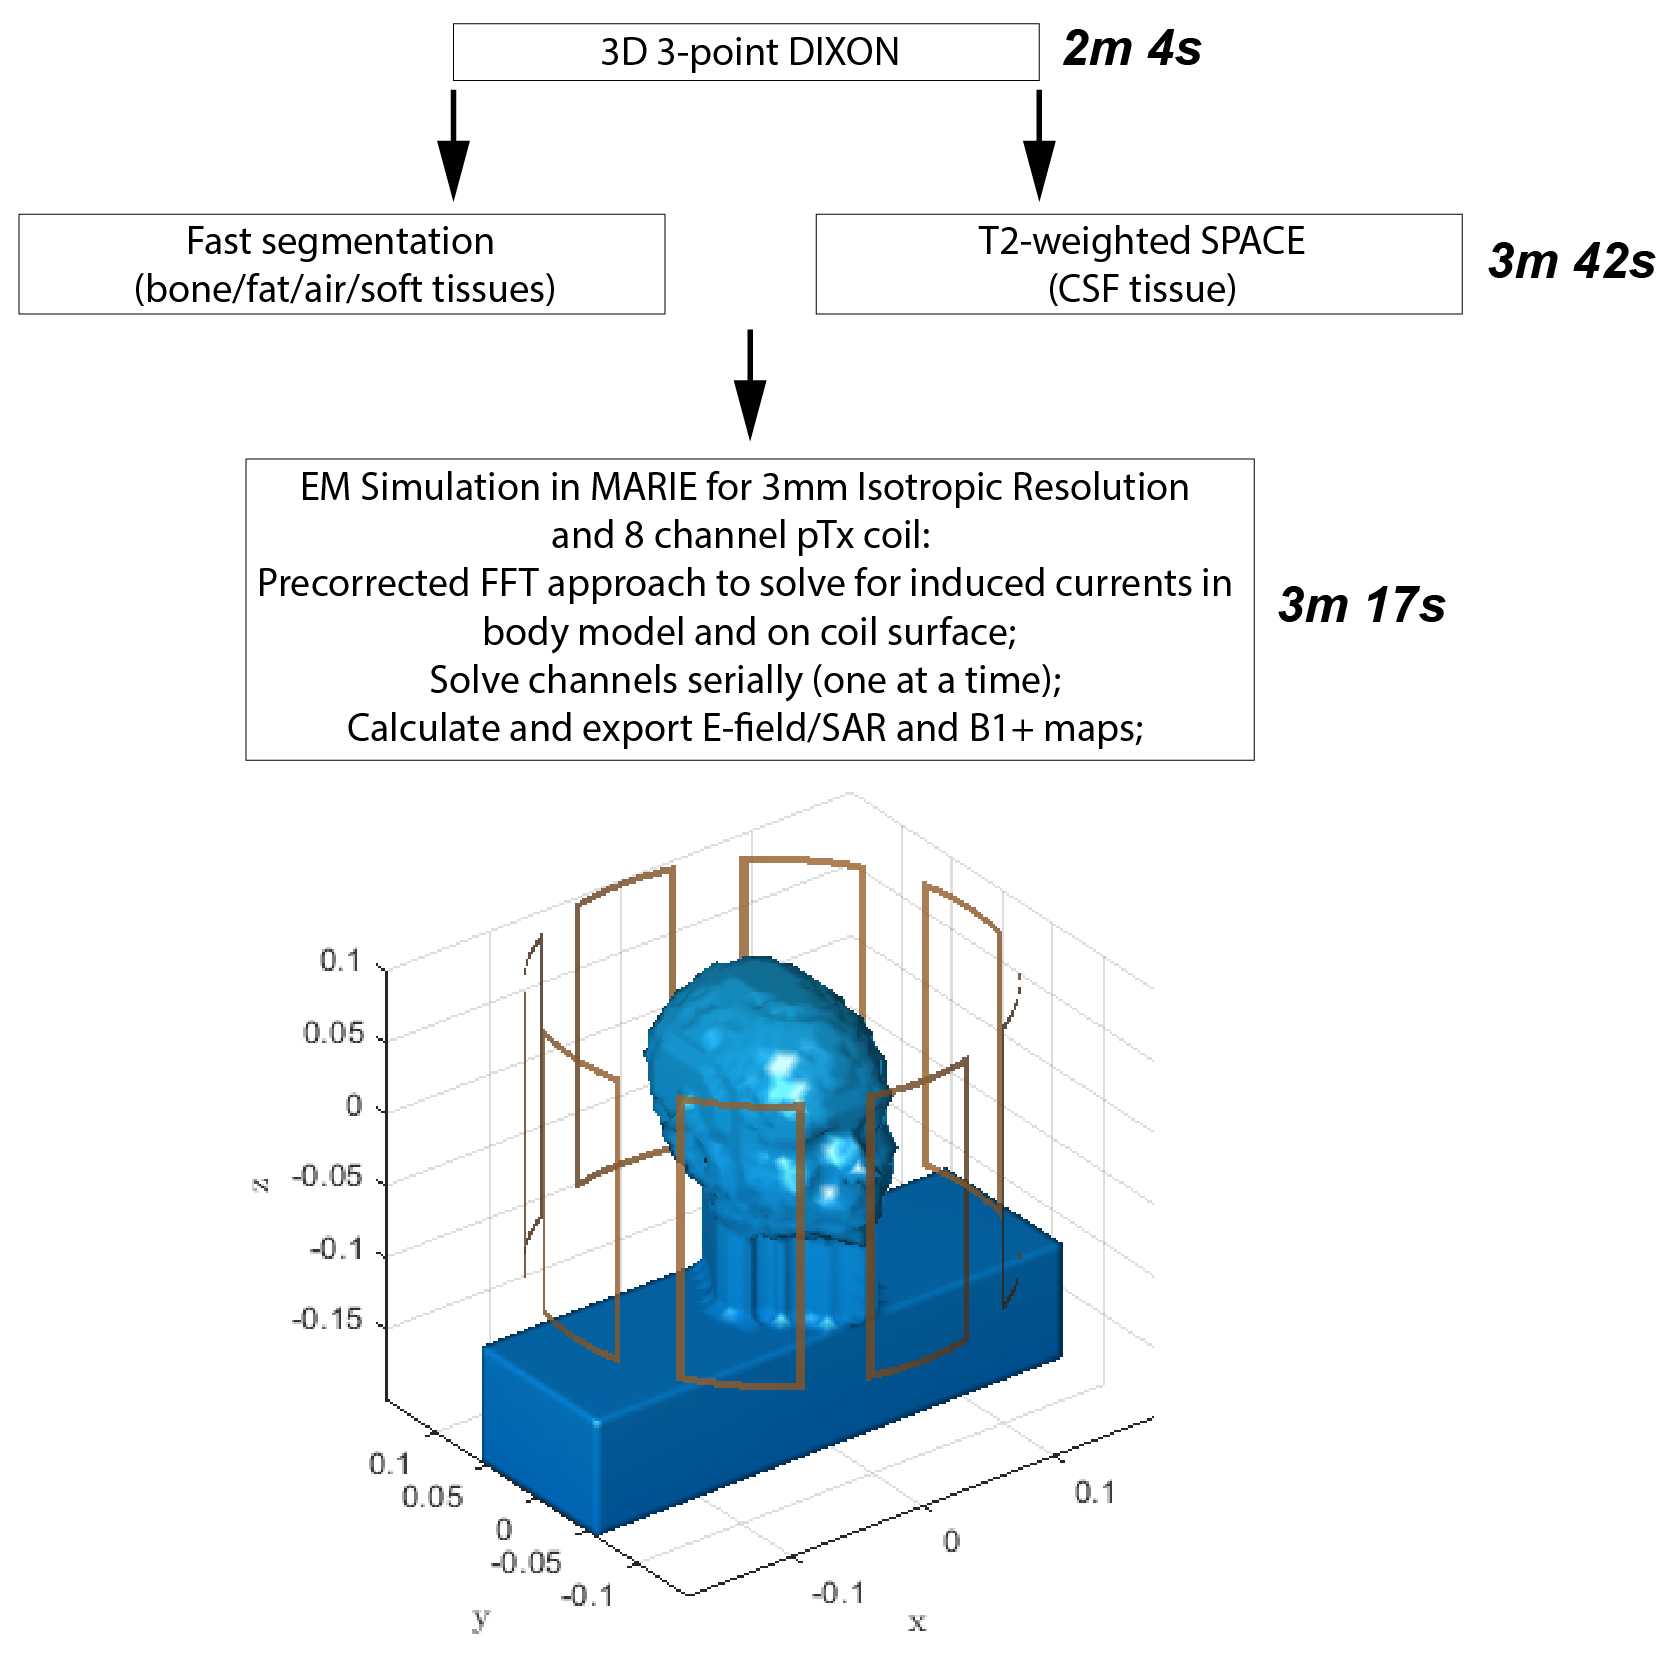
MRI Protocol/Segmentation: First a 2:04 (2 minutes, 4 seconds) 3D 3-point Dixon scan was used to segment the body model into soft tissue, fat, bone, and air. The GRE had the following parameters: 1.3mm isotropic resolution, TR/TE1/TE2/TE3 of 13/1.02/3.57/6.12ms, GRAPPA 3x1. The phase of the echoes was unwrapped using the rapid open source minimum spanning tree algorithm (ROMEO) (4) and the fat and soft tissue (water) was calculated as described in (5). This step took ~20s. The fat, soft tissue, and first in-phase echo (TE1) were then fed into a computer vision-based segmenter with a 2mm atlas to obtain a body model with fat/soft tissue/bone/air (6,7). The segmenter was run with a parallel multi-threaded implementation using OpenMP and took ~3:22 (8). Next, a 3:35 T2-weighted SPACE sequence (9) was run with the following parameters: 1mm isotropic resolution, TR/TE of 1800/990ms, VFA scheme with assumed tissue T1/T2 of 2000/500ms, GRAPPA 2x1. The resulting images were thresholded to yield cerebrospinal fluid (CSF). All the tissue classes were then combined to form a 2mm isotropic body model consisting of fat/soft tissue/air/bone/CSF and assigned conductivity/permittivity/density values using the Gabriel database for 297MHz (10). We then added a body extension consisting of neck/chest (set to muscle dielectric properties), such that the body ends 100mm below the coil, in order to improve coil loading (3,11). Finally, we interpolated the body model to 3mm isotropic resolution for EM simulation.Volunteer Acquisitions: Six healthy volunteers (3 males/3 females, 22-38yo, 158-193cm, 110-230lbs., and 18.8-32.1kg/m2) were scanned on a Siemens 7T Terra system with the Nova 8Tx/32Rx coil. B1+ maps were acquired using the scanner’s product saturated TFL sequence.
Electromagnetic simulation using MARIE: We simulated an 8-channel pTx coil (radius=15cm, length=20cm) (Fig. 1) and all body models using the MARIE fast EM solver (12,13) in Matlab on an Nvidia Quadro GV100 GPU in a high end workstation. Tuning and matching of the coil was performed in Ansys Electronics and the lumped elements were used in all subsequent simulations within MARIE. The coil was driven in CP mode with 1V in each loop. We utilized an implicit solver with precorrected Fast Fourier Transform (pFFT)-based coupling within MARIE with a piece-wise constant basis to compute electric fields/SAR matrices and B1+ maps. This framework allowed us to precompute coil-specific parameters and electromagnetic operators for a given grid size/resolution/frequency, with the resulting time consisting exclusively of a system precorrection step and time spent in iterative solver. The details of this approach can be found in (13).
Results
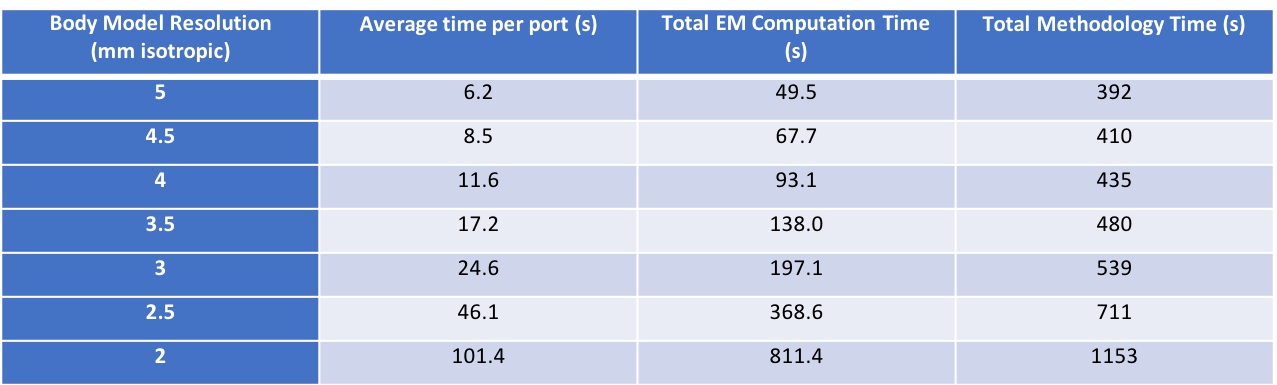
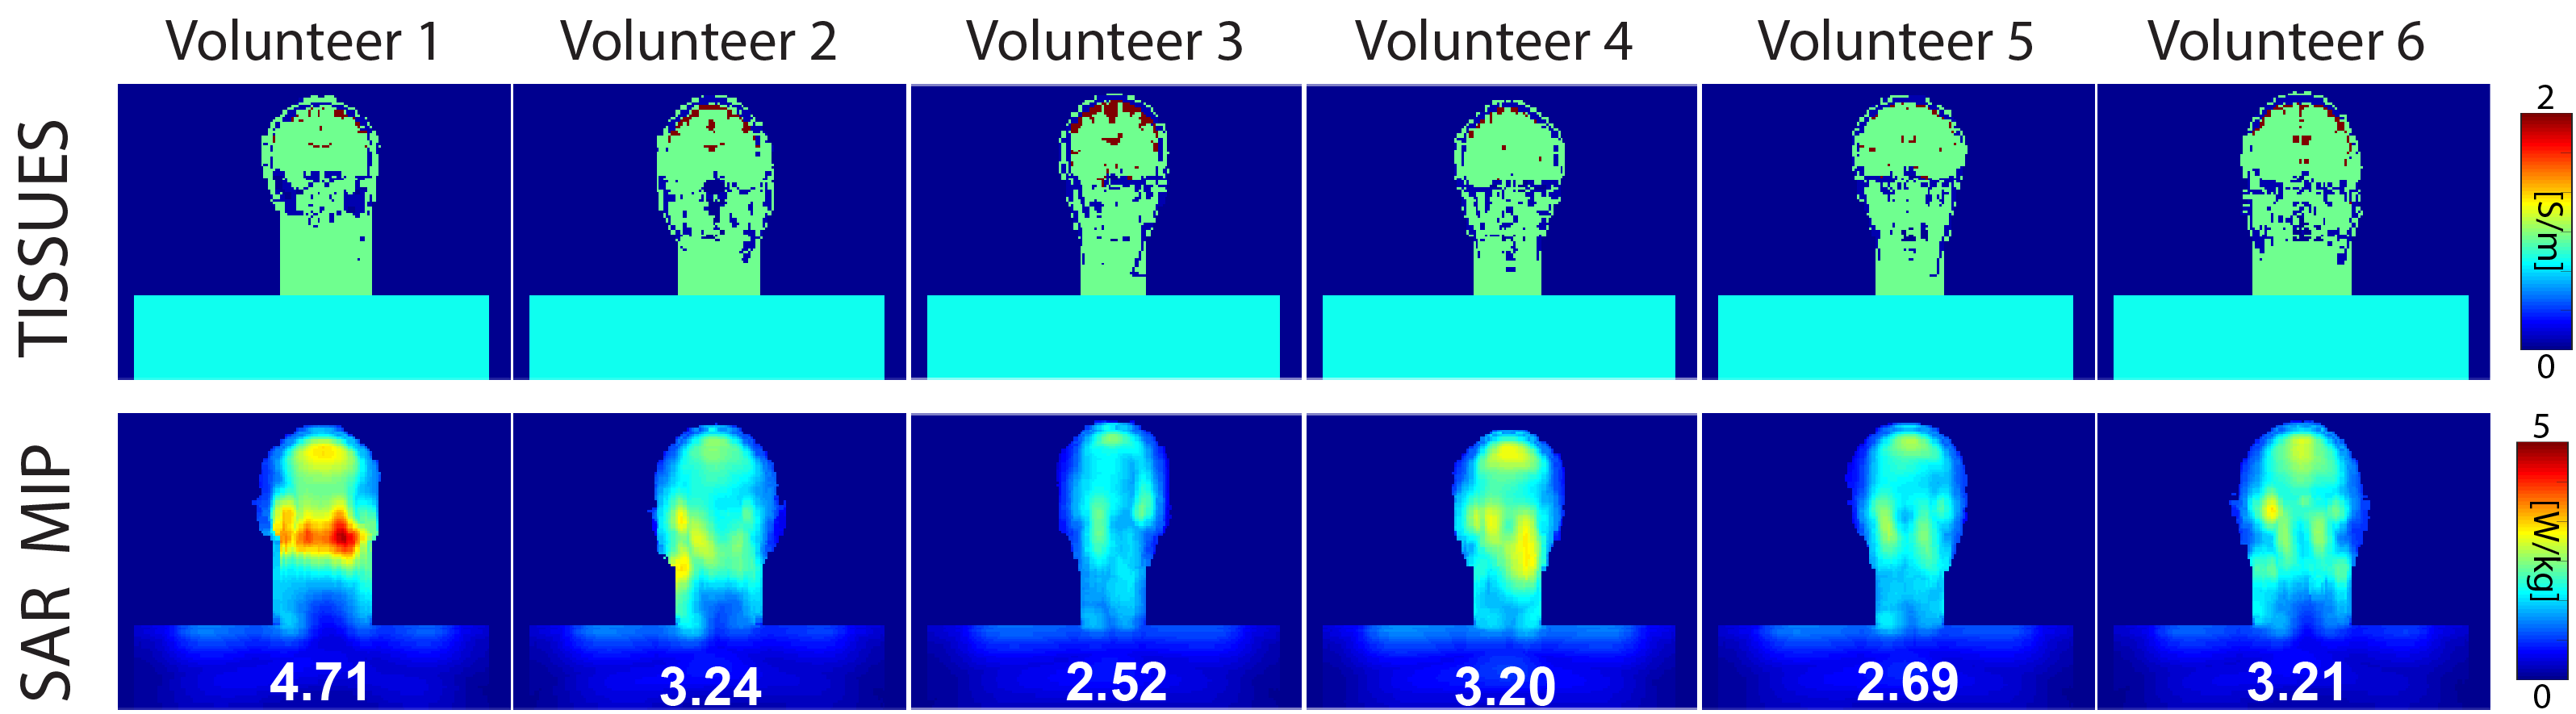
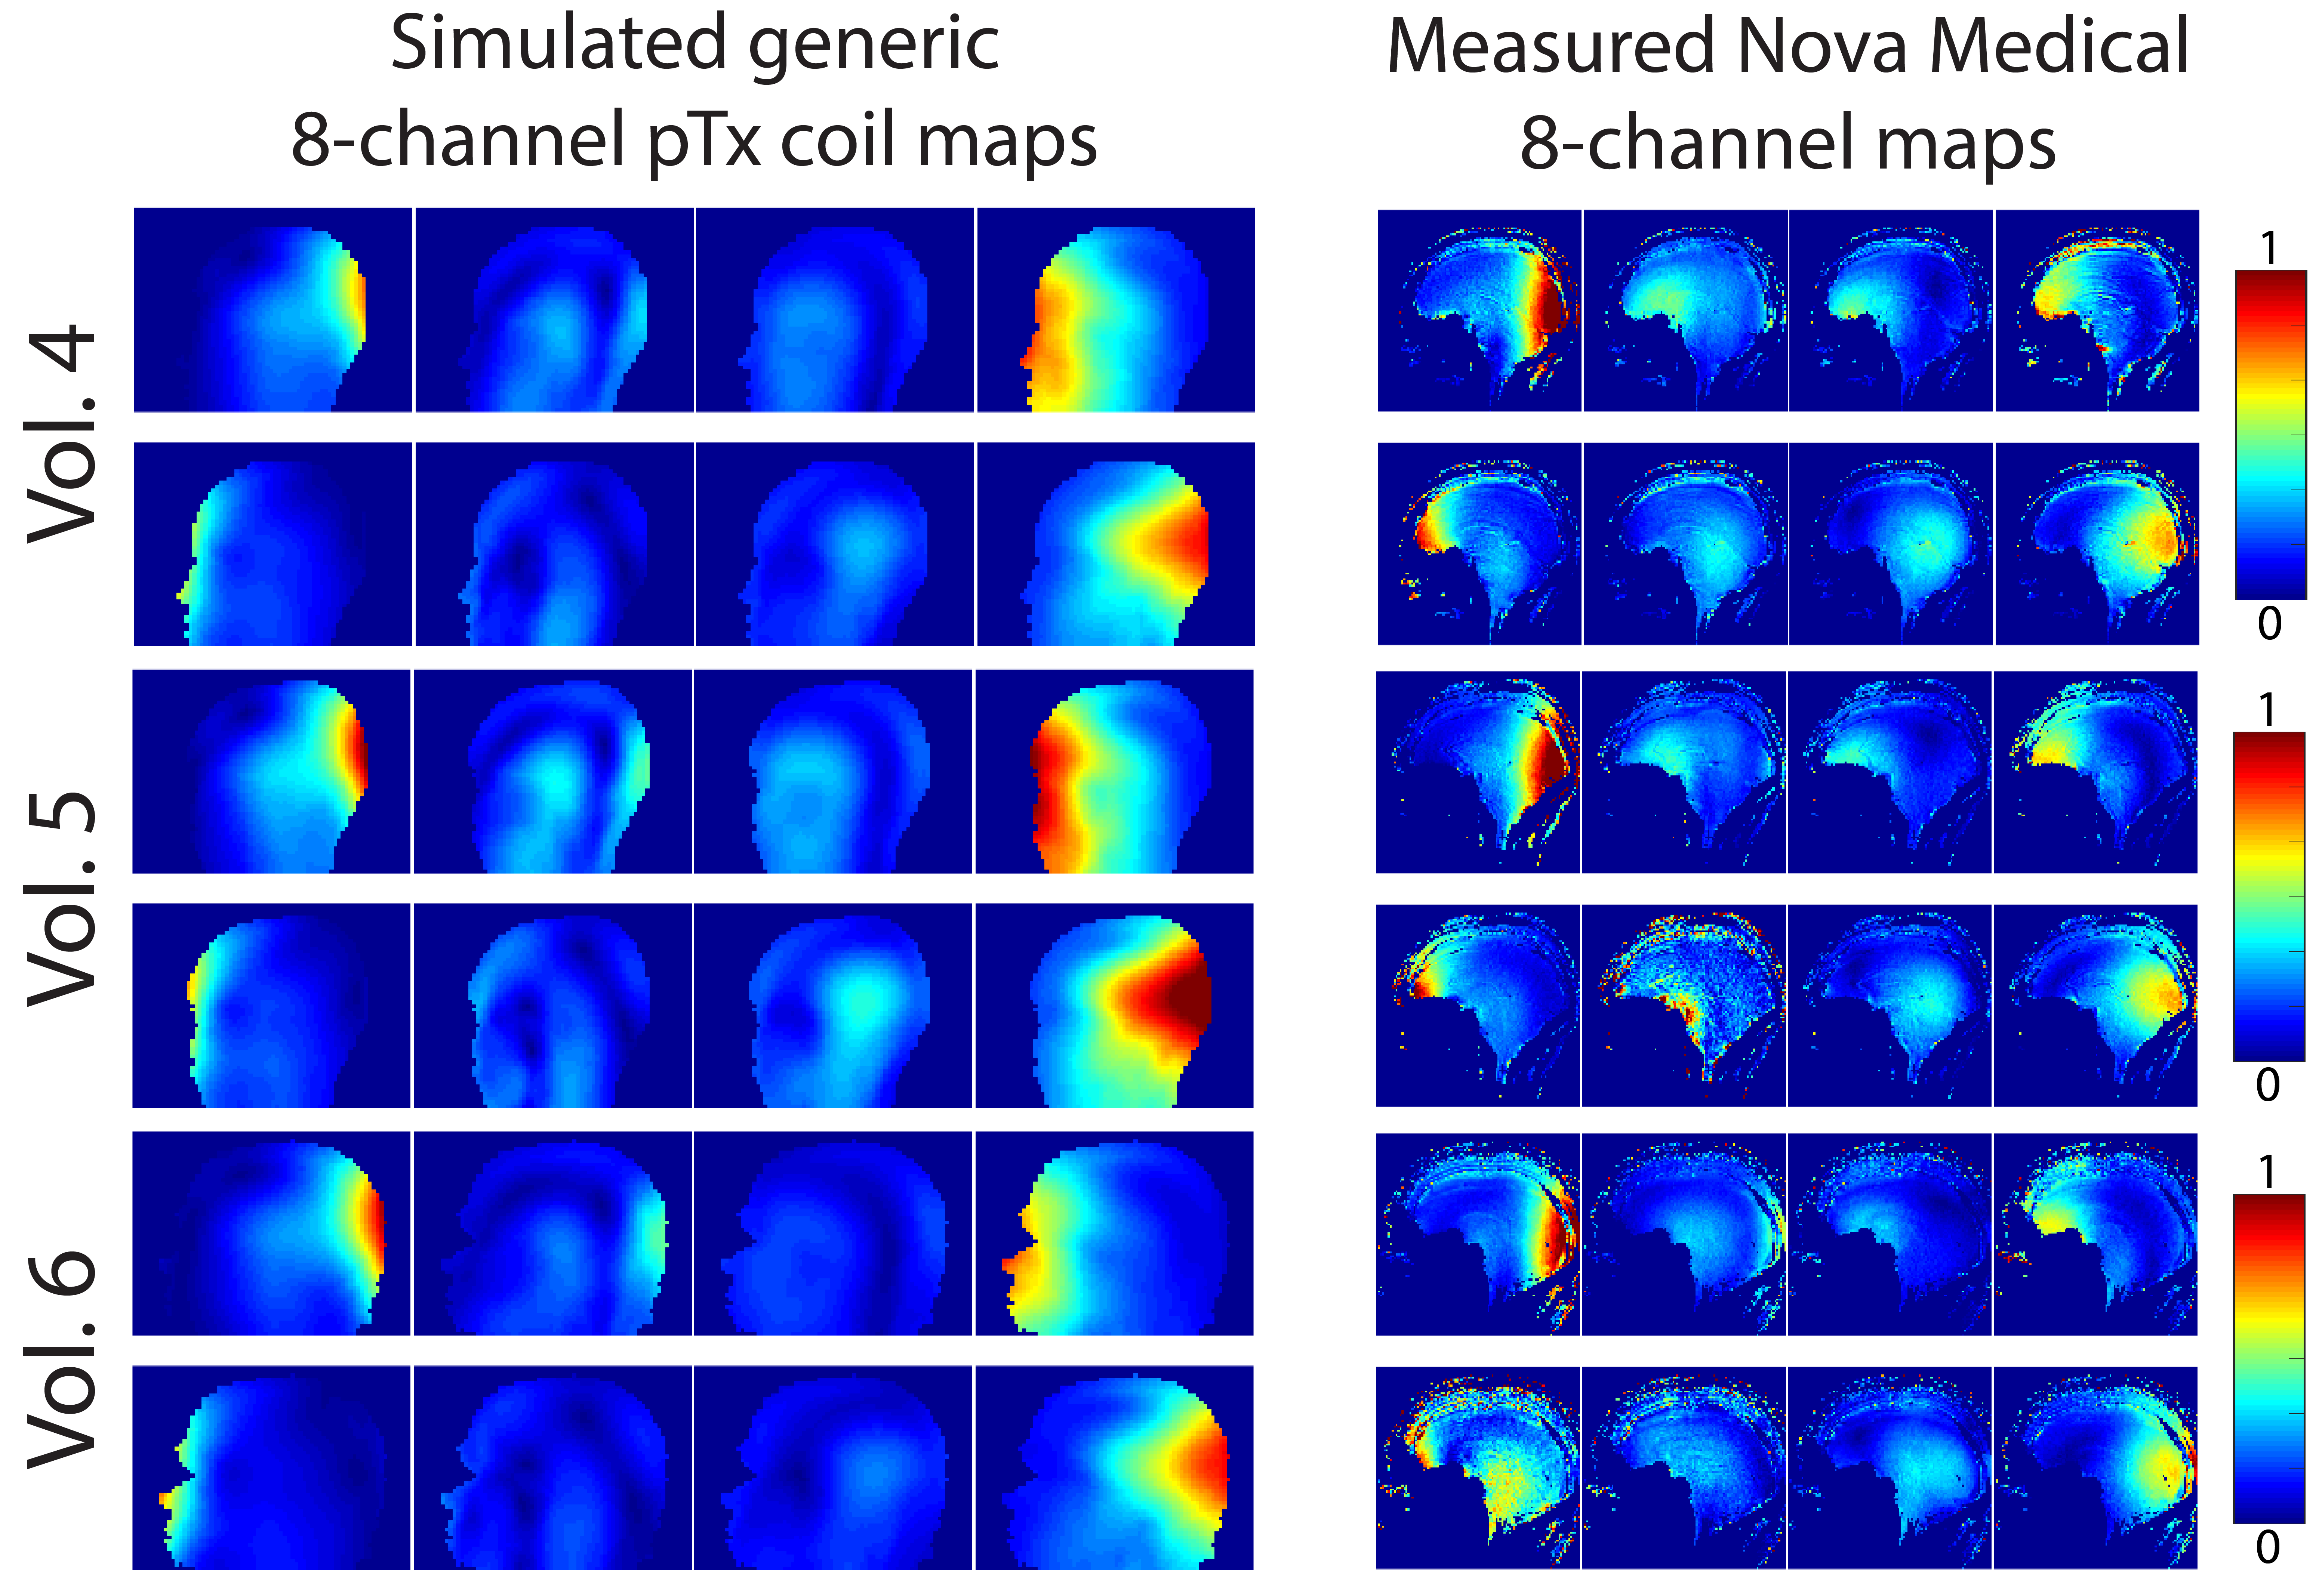
An idealized version of the complete workflow is depicted in Figure 1. The current total cumulative time of the workflow is 9 minutes for a 3mm isotropic body model. Figure 2 shows the EM simulation times for body model resolutions ranging from 2-5mm. The time per port, and consequently the overall simulation time and methodology time increased considerably at 2/2.5mm resolution. Figure 3 shows the conductivity map of the center slice and the maximum intensity projection SAR map for each volunteer with the value of the 10g local SAR. The range of 10g local SAR values was 2.52-4.71W/kg with an inter-volunteer variability of 23.4%. Figure 4 shows the B1+ map for all 8 channels from simulation and experiment for one of the volunteers.Discussion
We have shown an initial implementation of a real-time methodology for computing psSAR at 7T for an 8 channel pTx coil. We chose 3mm as the body model resolution as tradeoff between model accuracy and EM simulation time. One issue is the ability model the impact of CSF at this resolution. A recent publication indicated the need for CSF as a separate tissue class for 7T pTx head simulations (14). Unfortunately, our current implementation for models approaching 1mm isotropic would result in EM simulation times >800s. However, there are a few approaches we are exploring that would shorten the current total time of our methodology. First, we are working on a deep learning (DL) implementation of the segmentation pipeline, whereby a single multi-echo GRE will yield the body model described here. This DL approach will take only a few seconds and will allow us to skip the SPACE sequence, thereby saving ~3.5 minutes. Second, we can reduce the simulation time by exploiting the fact that the problem at hand could be solved for each port in parallel.Acknowledgements
NIH grant EB019482.References
1. Eichfelder G, Gebhardt M. Local Specific Absorption Rate Control for Parallel Transmission by Virtual Observation Points. Magn. Reson. Med. 2011;66:1468–1476 doi: 10.1002/mrm.22927.
2. Meliadò EF, Raaijmakers AJE, Sbrizzi A, et al. A deep learning method for image‐based subject‐specific local SAR assessment. Magn. Reson. Med. 2020;83:695–711 doi: 10.1002/mrm.27948.
3. Milshteyn E, Guryev G, Torrado-Carvajal A, et al. Individualized SAR Calculations Using Computer-Vision-Based MR Segmentation and a Fast Electromagnetic Solver. Magn. Reson. Med. 2021;85:429–443.
4. Dymerska B, Trattnig S, Eckstein K, Bachrata B. Phase unwrapping with a rapid opensource minimum spanning tree algorithm (ROMEO). Magn. Reson. Med. 2020 doi: 10.1002/mrm.28563.
5. Glover GH. Multipoint Dixon Technique for Water and Fat Proton and Susceptibility Imaging. J. Magn. Reson. Imaging 1991;1:521–530.
6. Torrado-Carvajal A, Eryaman Y, Turk EA, et al. Computer-Vision Techniques for Water-Fat Separation in Ultra High-Field MRI Local Specific Absorption Rate Estimation. IEEE Trans. Biomed. Eng. 2019;66:768–774 doi: 10.1109/TBME.2018.2856501.
7. Torrado-Carvajal A, Herraiz JL, Alcain E, et al. Fast Patch-Based Pseudo-CT Synthesis from T1-Weighted MR Images for PET/MR Attenuation Correction in Brain Studies. J. Nucl. Med. 2016;57:136–144 doi: 10.2967/jnumed.115.156299.
8. Alcain E, Torrado-Carvajal A, Montemayor AS, Malpica N. Real-time patch-based medical image modality propagation by GPU computing. J. Real-Time Image Process. 2017;13:193–204 doi: 10.1007/s11554-016-0568-0.
9. Mugler III JP. Optimized Three-Dimensional Fast-Spin-Echo MRI. J. Magn. Reson. Imaging 2014;39:745–767 doi: 10.1002/jmri.24542.
10. Gabriel S, Lau RW, Gabriel C. The dielectric properties of biological tissues: III. Parametric models for the dielectric spectrum of tissues. Phys. Med. Biol. 1996;41:2271–2293.
11. Wolf S, Diehl D, Gebhardt M, Mallow J, Speck O. SAR Simulations for High-Field MRI : How Much Detail, Effort, and Accuracy Is Needed? Magn. Reson. Med. 2013;69:1157–1168 doi: 10.1002/mrm.24329.
12. Fernandez Villena J, Polimeridis AG, Eryaman Y, et al. Fast Electromagnetic Analysis of MRI Transmit RF Coils Based on Accelerated Integral Equation Methods. IEEE Trans. Biomed. Eng. 2016;63:2250–2261.
13. Guryev GD, Polimeridis AG, Adalsteinsson E, Wald LL, White JK. Fast field analysis for complex coils and metal implants in MARIE 2.0. In: Proc. Intl. Soc. Mag. Reson. Med. 27 (2019) 1035.
14. de Buck MHS, Jezzard P, Jeong H, Hess AT. An investigation into the minimum number of tissue groups required for 7T in-silico parallel transmit electromagnetic safety simulations in the human head. Magn. Reson. Med. 2021;85:1114–1122 doi: 10.1002/mrm.28467.
Figures