0616
Feasibility and insights into transient state phase-based mapping for rapid T2 quantification in the myocardium1Magnetic Resonance Systems Lab, Department of Imaging Physics, Delft University of Technology, Delft, Netherlands, 2Computer Assisted Clinical Medicine, Medical Faculty Mannheim, University Heidelberg, Mannheim, Germany, 3Department of Radiology, University of Wisconsin, Madison, WI, United States
Synopsis
In this study we explore the use of the signal phase of RF phase modulated gradient echo imaging during steady state for rapid T2 mapping in the myocardium. RF phase modulated GRE images were obtained with quadratic phase increments of ±2° and T2 times were extracted by matching the phase evolution. B1+ sensitivity was incorporated in the reconstruction based on separately acquired Bloch-Siegert maps. Good correlation was found in phantom measurements (R>0.95; p<0.0001) and high visual image quality in vivo.
Background
Myocardial T2 mapping is commonly used for the assessment of edema and advanced myocardial tissue characterization in cardiovascular magnetic resonance imaging (CMR).[1,2] Conventionally, T2 mapping is performed by acquiring multiple T2-weighted magnitude images and reconstructed by an exponential fit. T2 preparation modules are most often used for generating these T2 contrasts, requiring multiple seconds rest periods to achieve full magnetization recovery before each preparation. This leads to long-scan times and hampers clinical use. Recently, a new technique was developed to encode the T2 information in the signal phase of a gradient-echo acquisition (GRE), circumventing the need for rest periods.[3] In this work we show the feasibility of phase-based T2 mapping in the transient state in the myocardium in vivo and in a phantom.Methods
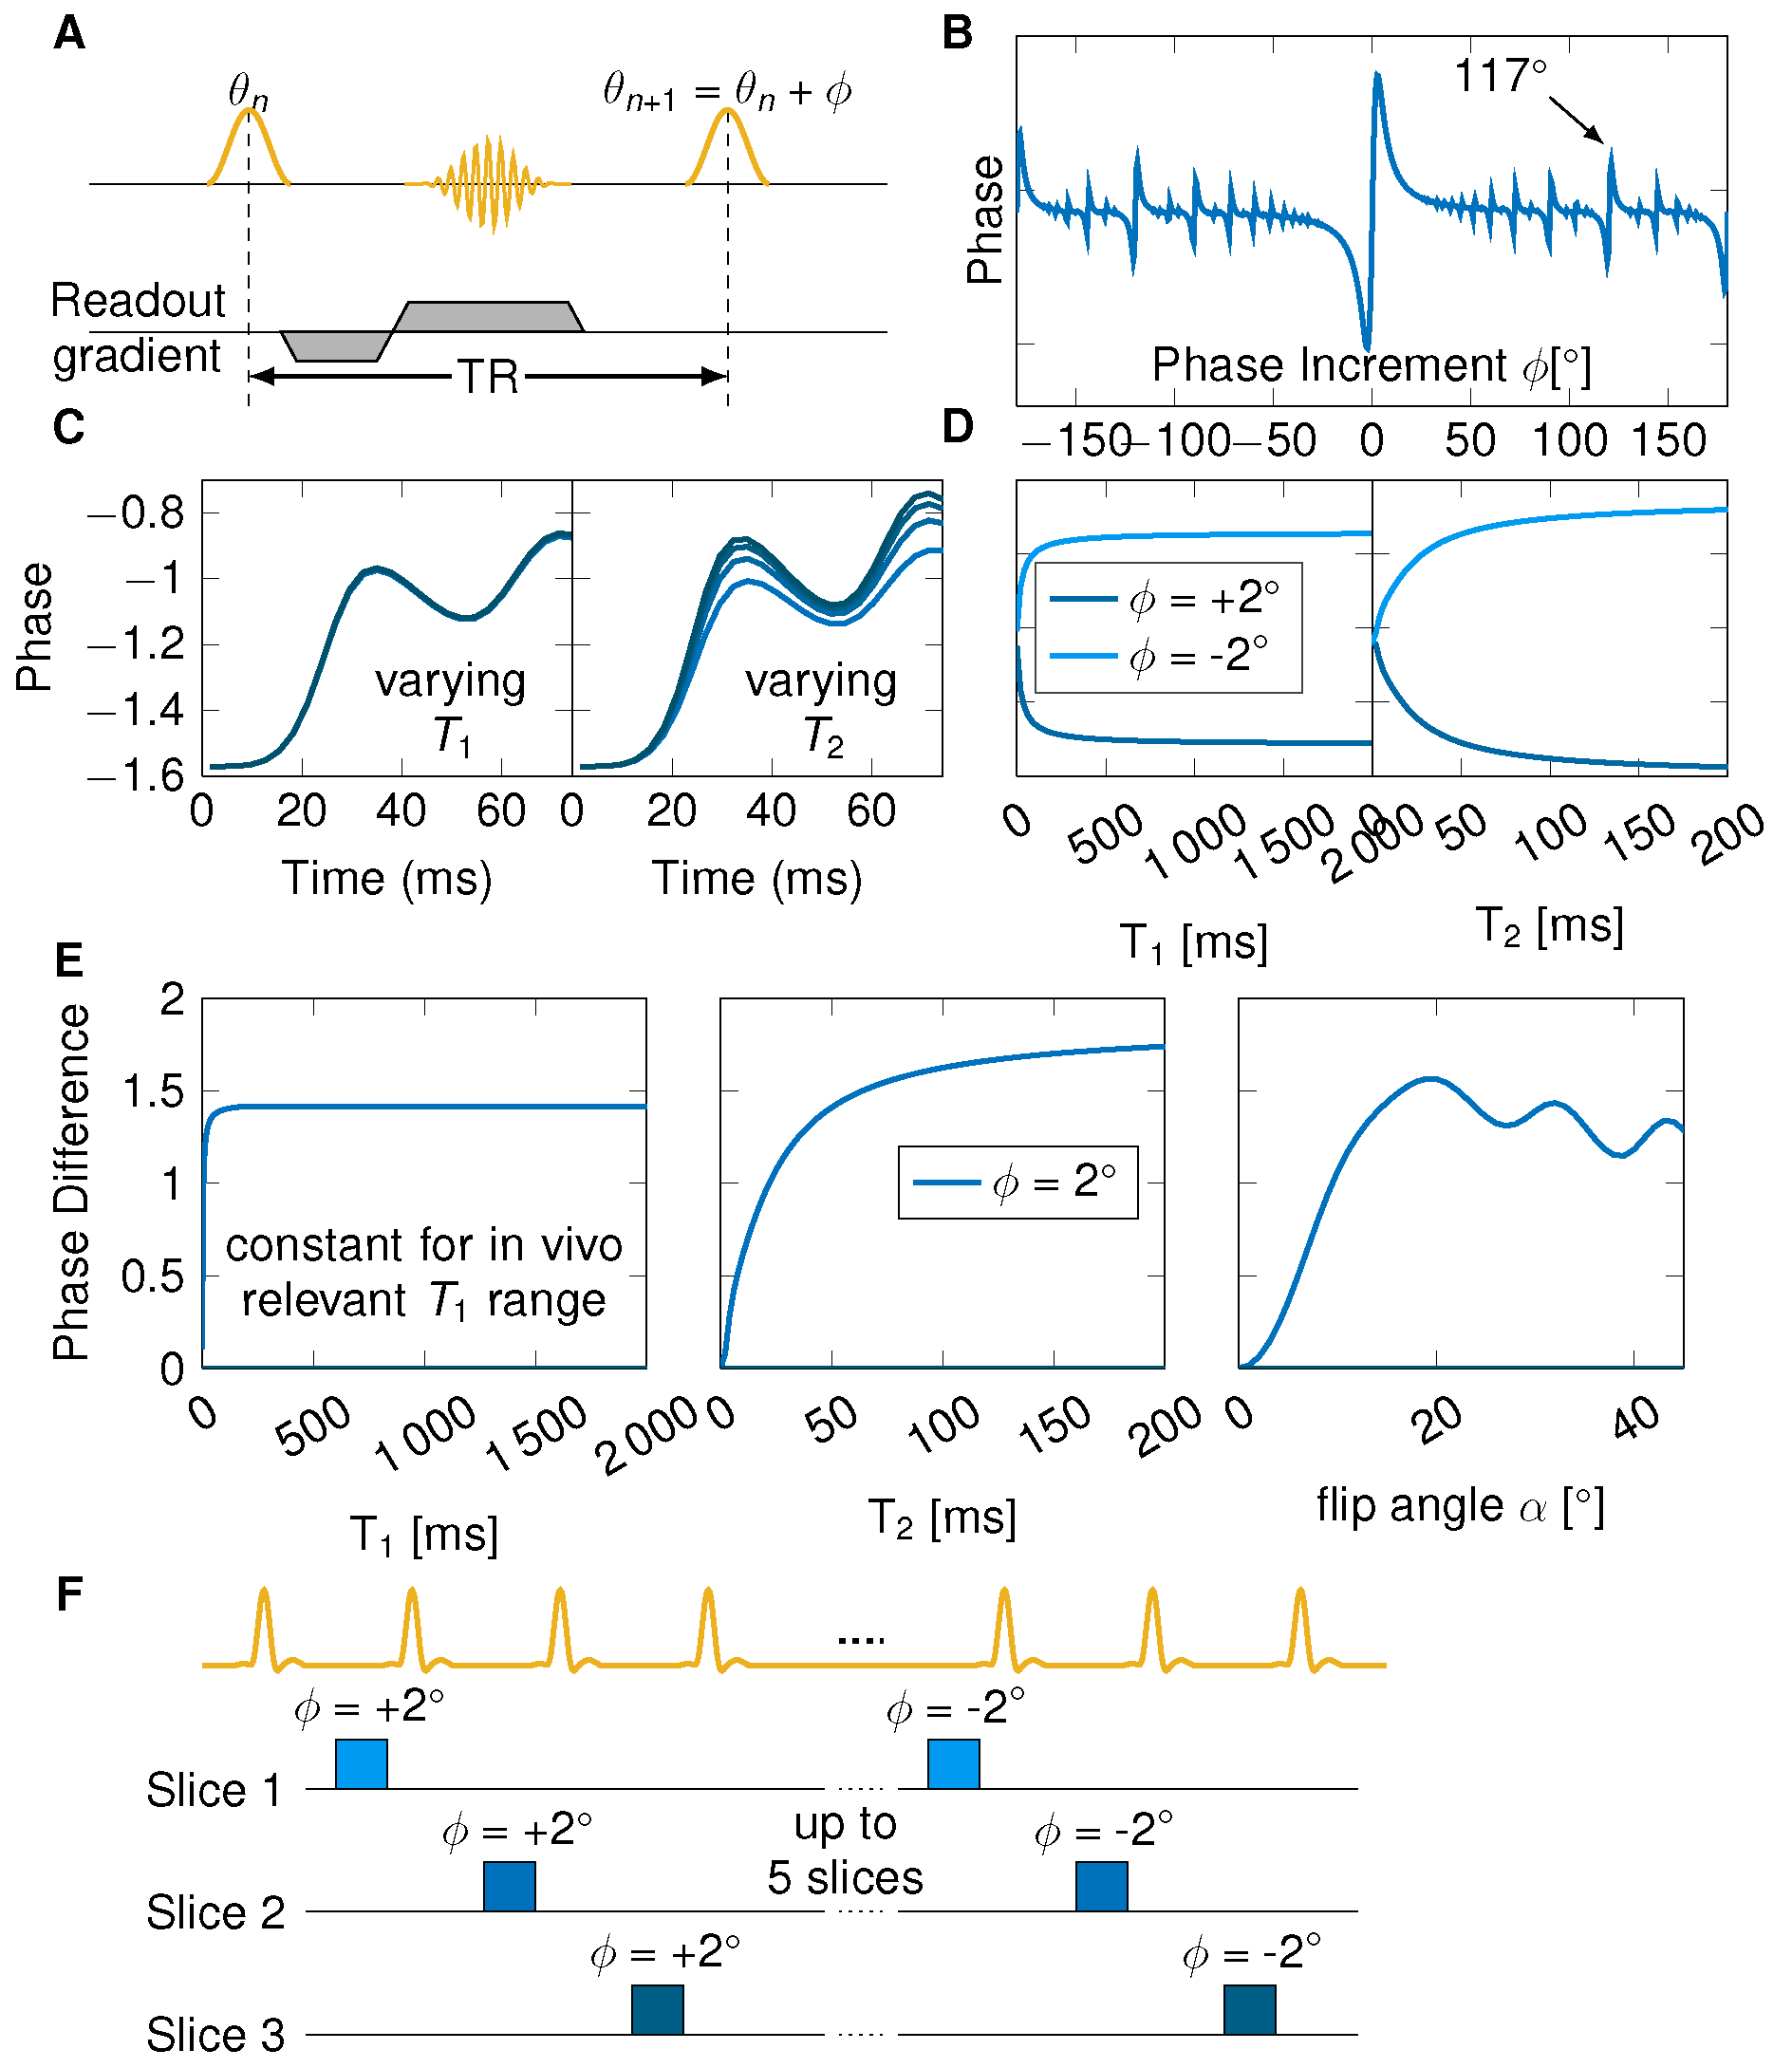
The proposed method is based on the signal phase during the transient state of an RF phase modulated gradient echo (GRE) sequence with small quadratic phase increments (Figure 1A). Bloch simulations were performed to study the phase evolution as a function of T1 and T2 (Figure 1B,C,D). Slice profile effects were incorporated by simulating 100 isochromats across the slice thickness. Furthermore, B1+ inhomogeneities were included by scaling the flip angle. Look-up tables were generated for T2 map reconstruction containing a variety of B1+ values (0.6-1.2 of the nominal flip angle) to assign each voxel a B1+ dependent T2 estimate.In the proposed sequence scheme five slices were acquired using a GRE sequence with positive phase increment Φ=2°, followed by five slices with negative phase increment Φ=-2° (Figure 1F). The two images for each slice were subtracted before T2 mapping in order to eliminate the background phase. All images were acquired at 3T (Magnetom Skyra, Siemens Healthineers). Phantom measurements were performed in 13 tubes with T1 times all above 2000 ms and T2 times varying between 30 ms and 200 ms to separately analyze the dependency in T2. Additionally, accuracy and precision was validated in the phantom and correlated to the Bloch simulations for the T2 dependency. Bloch-Siegert mapping was acquired in the same five slices to correct for B1+ inhomogeneities.
In vivo measurements were performed during end diastole in two healthy volunteers with the same sequence parameters as for the phantom. The estimated phase based T2 maps are compared with the reference cardiac T2 method[4].
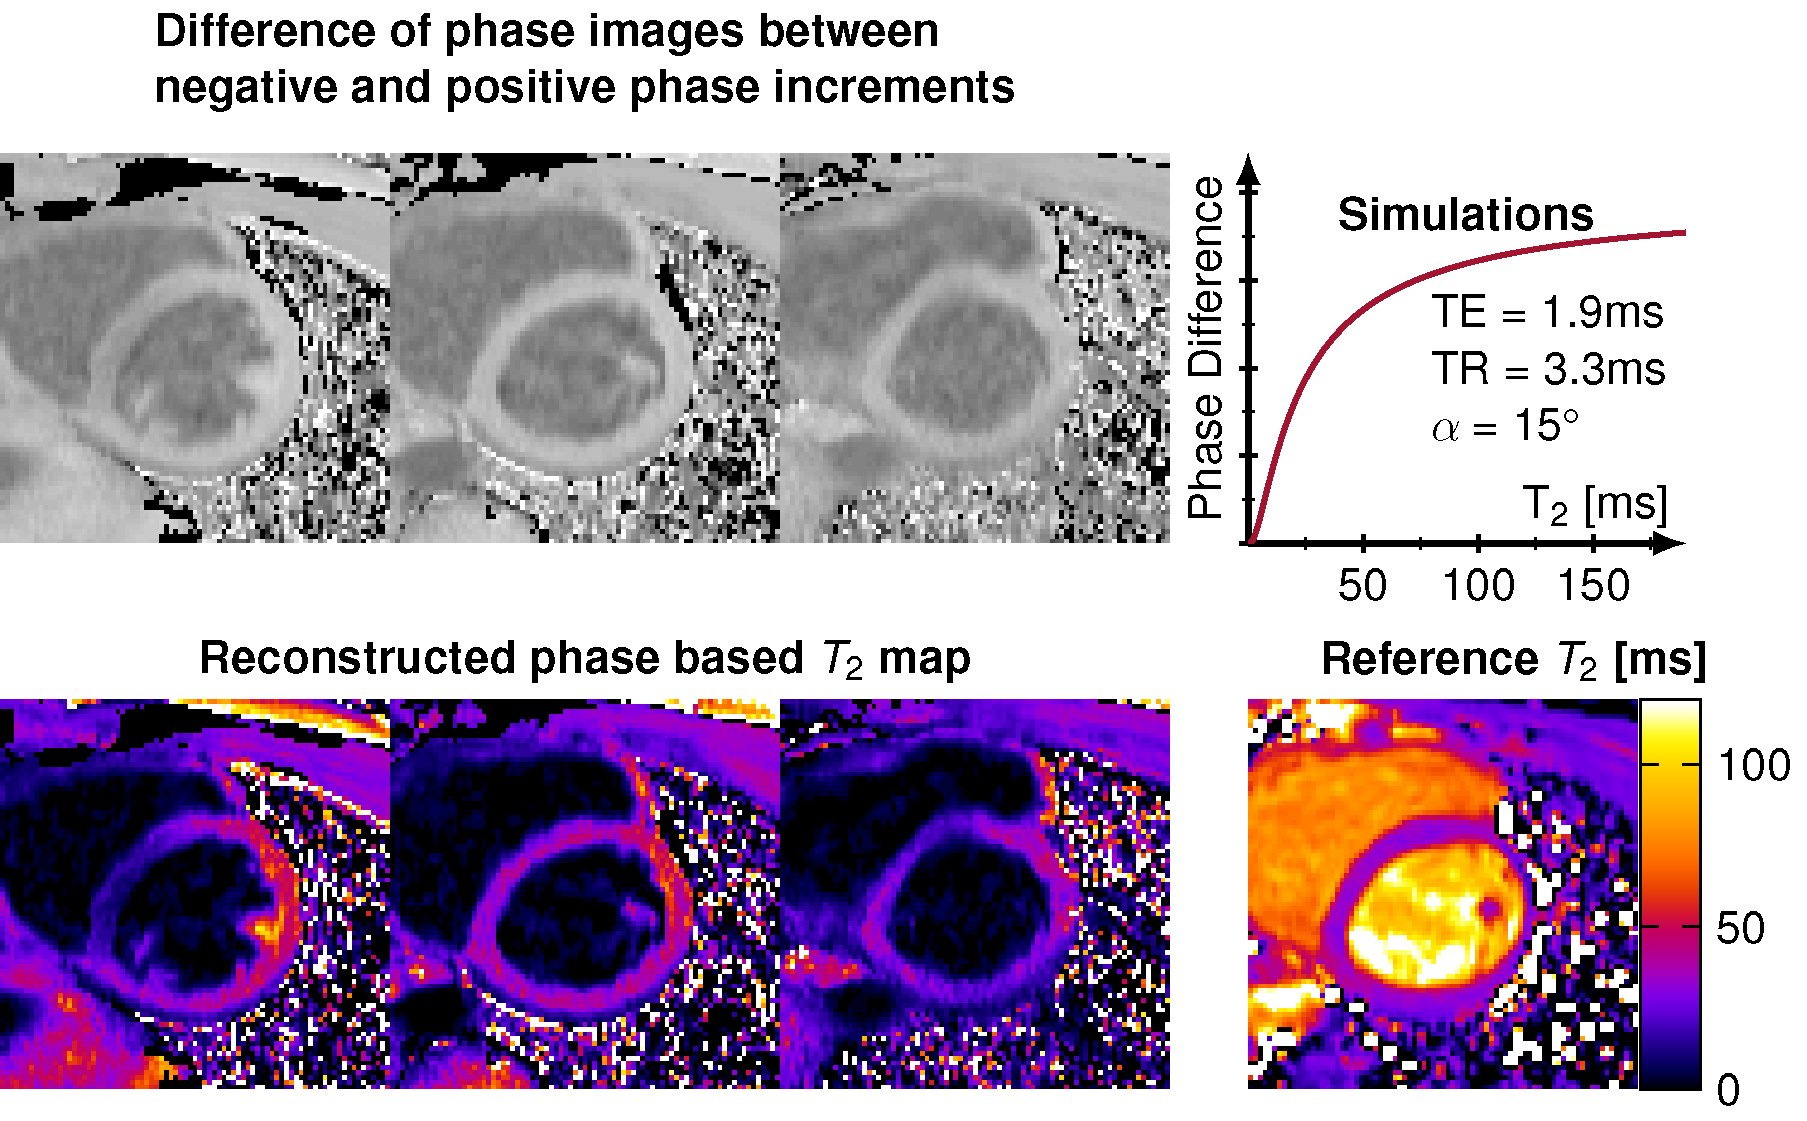
Sequence parameters were: TE=1.8 ms, TR=3.3 ms, flip angle α=15°, FOV = 384x288 mm2, in-plane resolution of 1.0x1.0 mm2, acquired lines to the center of k-space = 61 and switching phase increments of ±2°.
Results
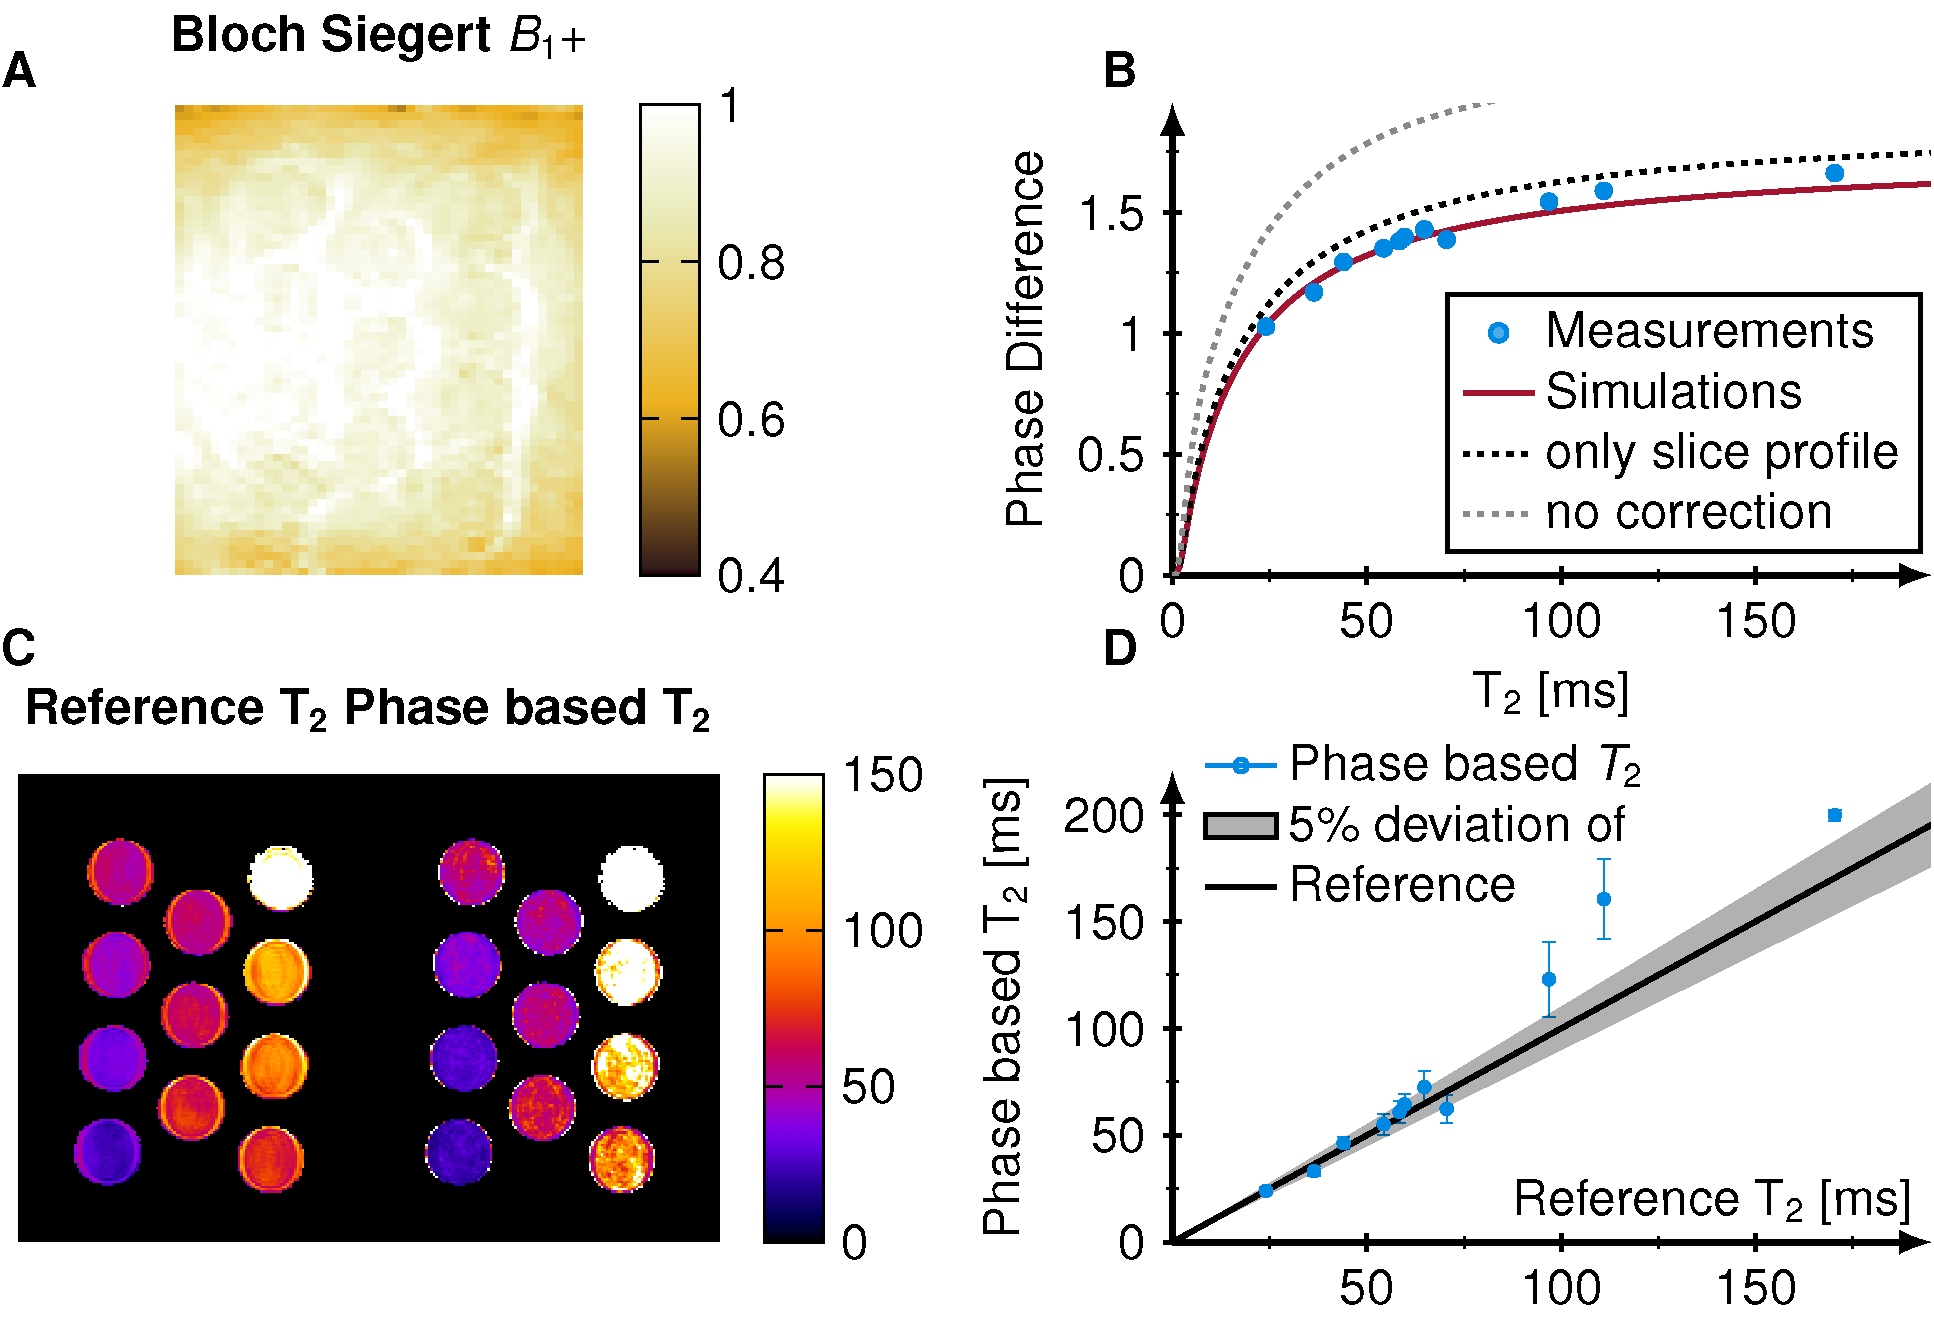
Simulations show that the signal phase is strongly dependent on T2 but not on T1 and asymmetric for positive and negative phase increments. The subtracted phase (labeled as phase difference) shows, therefore, a major dependence on T2 but negligible T1 effects (Figure 1E). During the transient state strong B1+ dependence is observed.Phantom measurements agree with the simulations and show a major T2 dependence of the phase difference (Figure 2). In comparison to phantom images, simulations overestimate the phase difference when no correction for B1+ and slice profile are applied (gray dotted line). The overestimation was reduced when incorporating slice profile effects into the simulations (black dotted line). Resulting T2 times are in good correlation (R=0.95, p<0.001) when additionally B1+ was included (Figure 2B). The average B1+ value in the tubes was 0.96 resulting in an effective flip angle of 14.4° (Figure 2A). Visually good agreement between the spin-echo reference method and phase-based T2 mapping is achieved (Figure 2C). T2 times estimated in phantom were within 6% deviation compared with the reference for T2 less than 100 ms. Higher deviations were observed at very long T2 times (Figure 2D).
In vivo phase based T2 mapping yielded mean T2 times of 29.9 ms, which is 11% lower than the reference T2 map 33.6 ms. The myocardium appears homogeneous, especially for the mid ventricular slice, and results in visual image quality comparable to the reference method (Figure 3). Residual B1+ effects were observed in the septal wall.
Discussion
We demonstrated the feasibility of using transient state phase based T2 mapping for fast T2 quantification in the myocardium, obtaining good correlation between simulations and phantom measurements and satisfactory image quality in vivo. Phase based T2 mapping enables the quantification of five slices in one breath-hold (10 heart-beats), which is similar to the reference T2 prepared single-shot acquisition covering only one slice. This enables whole heart T2 mapping within one breath-hold. Phase based T2 mapping does not provide blood T2 times because of the phase cancellations. Furthermore, residual subject specific B1+ is observed, which needs to be corrected for. Further improvements might be joint quantification of B1+ and T2 and warrant further investigation.Conclusion
Myocardial phase based T2 mapping is a promising new technique for fast quantification of multiple slices in the myocardium.Acknowledgements
S.W. acknowledges funding from the 4TU Precision Medicine program, a NWO Start-up STU.019.024 and ZonMW OffRoad 04510011910073.References
[1] Giri Shivraman, Chung Yiu-Cho, Merchant Ali, Mihai Sanjay, Raman Subha V., Simonetti OrlandoP.. T2 quantification for improved detection of myocardial edema Journal of CardiovascularMagnetic Resonance. 2009;56:1532-429X.
[2] Wiesmueller Marco, Wuest Wolfgang, Heiss Rafael, Treutlein Christoph, Uder Michael, May Matthias Stefan. Cardiac T2 mapping: robustness and homogeneity of standardized in-lineanalysis Journal of Cardiovascular Magnetic Resonance. 2020;22:1532-429X.
[3] Wang Xiaoke, Hernando Diego, Reeder Scott B.. Phase-based T2 mapping with gradient echoimaging Magnetic Resonance in Medicine. 2020;84:609-619.
[4] Huang Teng-Yi, Liu Yi-Jui, Stemmer Alto, Poncelet Brigitte P.. T2 measurement of the humanmyocardium using a T2-prepared transient-state trueFISP sequence Magnetic Resonance in Medicine. 2007;57:960-966.
Figures