0615
3D whole-heart free-breathing isotropic joint T1/T2 quantification: preliminary clinical evaluation1School of Biomedical Engineering and Imaging Sciences, King's College London, London, United Kingdom, 2MR Research Collaborations, Siemens Healthcare Limited, Frimley, United Kingdom
Synopsis
Myocardial tissue characterization, such as quantification of fibrosis and oedema plays an important role in many myocardial diseases. T1 and T2 maps are typically acquired sequentially in 2D under several breath-holds. However, they achieve limited spatial resolution and coverage. To overcome these limitations, a high resolution, motion compensated joint T1/T2 water/fat sequence has been recently proposed and validated in phantom and healthy subjects. In this study, we demonstrate the capability of the proposed approach to obtain whole-heart, motion-compensated, simultaneous and co-registered T1, T2 maps and water and fat images in ~9min in patients with cardiovascular disease.
Introduction
Myocardial tissue characterization, such as quantification of fibrosis and oedema plays an important role in many myocardial diseases1. T1 mapping has been proven as a valuable tool to assess acute ischemic injury or amyloidosis among others, while T2 mapping has shown value for myocarditis assessment2,3. T1 and T2 maps are typically acquired sequentially in 2D under several breath-holds2,4. However they achieve limited spatial resolution and coverage. To overcome these limitations, a high resolution, motion compensated joint T1/T2water/fat sequence has been recently proposed and validated in phantom and healthy subjects5. In this study, we demonstrate the capability of the proposed approach to obtain whole-heart, motion-compensated, simultaneous and co-registered T1, T2 maps and water and fat images in ~9min in patients with cardiovascular disease.Methods
The proposed framework is schematically depicted in Figure 1. Four interleaved, ECG-triggered gradient-echo volumes with 2-point bipolar Dixon encoding were acquired with a 4x undersampled Variable Density Cartesian trajectory6,7. The first and fourth volumes were preceded by an inversion recovery (IR) pulse (with inversion time TI = 120 ms) and a T2 preparation (T2p) pulse (with echo time T2pTE = 50 ms) respectively, whereas no magnetization preparation pulses were applied prior to the second and third volumes. Nonrigid motion correction was applied to each volume, and a multi-contrast patch-based higher-order low-rank reconstruction was then performed8. Subsequently, a water-fat separation algorithm9 was applied, and water image signal evolution across the four volumes was obtained voxel-wise. A dictionary of several pre-calculated T1/T2 combinations (T1 range: 60:10:2000 ms, T2 range: 4:2:100, 100:5:200, 200:10:300 ms) was simulated using EPG formalism10 and matched against the water image signal evolution.Acquisitions were performed on a 1.5T scanner (Magnetom Aera, Siemens) on 6 patients with suspected cardiovascular disease to study the feasibility of the proposed approach in a clinical setting. Acquisition parameters included FA=8˚, 2 mm3 isotropic resolution, 14 start-up echoes for iNaV acquisition, subject specific mid-diastolic trigger-delay and acquisition window of ~100ms, TR/TE1/TE2=6.67/2.38/4.76ms, total scan time=~9min. Pre- and post-contrast T1-MOLLI maps were acquired on a mid-ventricular short axis (SA) slice as part of the clinical routine. A multi-slice SA T2-bSSFP map covering the whole heart was also acquired as reference.
Results
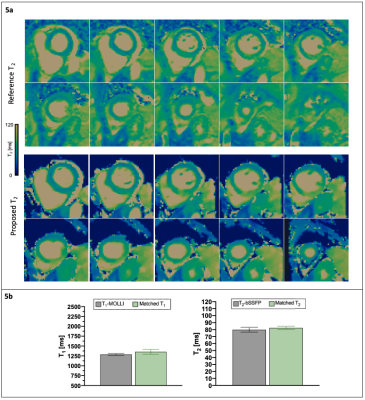
Non-rigid motion corrected 3D water and fat images for the four volumes from a representative patient are shown in Figure 2. Water and fat visualization can be obtained from the 4th volume (with T2 preparation). Joint T1/T2 maps in comparison to conventional maps are shown in Figure 3 for a representative patient without findings. Mid-ventricular SA T1 and T2 maps reformatted from the proposed joint T1/T2 approach are shown in Figure 4, along with the T1 MOLLI and 2D bSSFP T2 reference maps obtained during the same examination for two patients with clinical findings. Subject #2, diagnosed with acute myocarditis, presented elevated T1 and T2 values in the mid inferoseptal region of the joint T1/T2 maps. Quantification on the reference T1-MOLLI and T2-bSSFP confirms this finding. Subject #3, which presented with a myocardial infarction in the mid septal region shows slightly decreased T1 values in both T1-MOLLI and proposed T1 maps. A qualitative comparison of volumetric SA quantification on the T2 maps obtained from the reference and proposed methods is shown in Figure 5a. Figure 5b shows a quantitative comparison of T1 and T2 values measured within an ROI manually drawn inside the septum of Subject #3 (marked with white arrows in Figure 4). Good correlation between the proposed and the reference methods can be observed.Conclusion
We demonstrated the feasibility with the proposed free-breathing accelerated and motion corrected 3D joint T1/T2 sequence, that allows the acquisition of isotropic T1 and T2 maps and complementary co-registered water and fat visualization in a total scan time of ~9 min to identify regional abnormalities in T1 and T2 in patients with cardiovascular disease. The potential of the proposed approach to identify T1 and T2 alterations associated with cardiovascular diseases will be further investigated in a larger cohort of patients.Acknowledgements
This work was supported by EPSRC (EP/P001009, EP/P032311/1, EP/P007619/1) and Wellcome EPSRC Centre for Medical Engineering (NS/ A000049/1).References
1. Kim, P.K. et al. Korean J. Radiol. (2017). 18:113-131. doi:10.3348/kjr.2017.18.1.113
2. Messroghli, D.R. et al. J. Cardiovas. Magn. Reson. (2017). doi:10.1186/s12968-017-0389-8
3. Haaf, P. et al. J. Cardiovas. Magn. Reson. (2016). doi:10.1186/s12968-016-0308-4
4. Montant, P. et al. Diagn. Interv. Imaging. (2015). doi:10.1016/j.diii.2014.07.008.
5. Milotta, G. et al. Magn. Reson. Med. (2020). doi:10.1002/mrm/28330.
6. Prieto C. et al. J. Magn. Reson. Imaging. (2015). doi:10.1002/jmri.24602
7. Bustin A. et al. Magn. Reson. Med. (2018). doi:10.1002/mrm.27354.
8. Bustin A et al. Magn Reson Med. (2019). 81(6):3705-3719. doi:10.1002/mrm.27694.
9. Liu J. et al. Magn. Reson. Med. (2016). 78(5):1862-1869. doi:10.1002/mrm.26569.
10. Weigel M. J. Magn. Reson. Imaging. (2015). doi:10.1002/jmri.24619.
Figures


