0614
Accurate and precise myocardial T1 and T2 mapping in a single breath-hold with multi-parametric SASHA
Kelvin Chow1, Genevieve Hayes2, Jacqueline Flewitt2, Patricia Feuchter2, Carmen Lydell2, Andrew Howarth2, Joseph Pagano3, Richard Thompson4, Peter Kellman5, and James White2
1Cardiovascular MR R&D, Siemens Medical Solutions USA, Inc., Chicago, IL, United States, 2Stephenson Cardiac Imaging Centre, University of Calgary, Calgary, AB, Canada, 3Division of Pediatric Cardiology, University of Alberta, Edmonton, AB, Canada, 4Biomedical Engineering, University of Alberta, Edmonton, AB, Canada, 5National Heart, Lung, and Blood Institute, National Institutes of Health, Bethesda, MD, United States
1Cardiovascular MR R&D, Siemens Medical Solutions USA, Inc., Chicago, IL, United States, 2Stephenson Cardiac Imaging Centre, University of Calgary, Calgary, AB, Canada, 3Division of Pediatric Cardiology, University of Alberta, Edmonton, AB, Canada, 4Biomedical Engineering, University of Alberta, Edmonton, AB, Canada, 5National Heart, Lung, and Blood Institute, National Institutes of Health, Bethesda, MD, United States
Synopsis
A novel multi-parametric cardiac mapping sequence, mSASHA, is proposed to calculate T1 and T2 maps in a single breath-hold. mSASHA is validated against spin-echo in phantoms with -0.7±0.4% T1 error and -1.3±1.3% T2 error. In 10 healthy volunteers at 3T, mSASHA had similar T1 values to SASHA in the myocardium (1523±18 ms vs. 1520±18, p>0.05) and blood pool (2054±61 ms vs. 2060±65 ms, p>0.05). mSASHA had similar myocardial T1 coefficient of variation (CoV) to SASHA and MOLLI and similar myocardial T2 CoV to T2p-bSSFP (p>0.05). mSASHA provides accurate and precise T1 and T2 maps in a single breath-hold.
Introduction
Parametric mapping is commonly used in cardiac MRI to detect and quantify the severity of disease (1). T1 and T2 mapping are complementary techniques that can be used to characterize pathological changes in the tissue microstructure such as fibrosis and edema. While they are generally acquired separately, multi-parametric techniques such as cardiac magnetic resonance fingerprinting (2), multitasking (3), and joint T1-T2 mapping (4) have been described to combine them into a single acquisition. We propose a multi-parametric extension of the SAturation-recovery single-SHot Acquisition (SASHA) technique (5) to provide accurate and precise T1 and T2 maps in a single breath-hold.Methods
The prototype multi-parametric SASHA (mSASHA) sequence consists of a series of single-shot balanced steady-state free-precession (bSSFP) images in a single breath-hold similar to the acquisition proposed by Akçakaya et al (4). The first image is without magnetization preparation, followed by a series of 6 images with saturation-recovery (SR) preparation and 2 images with both SR and T2-preparation (T2p) (Fig. 1).The magnetization evolution for each image can be described as a combination of T1 recovery, T2 decay, and the effect of the imaging readout between the end of the magnetization preparation and center k-space (Fig. 2). For a variable-flip-angle (VFA) readout (6), the flip angles prior to center k-space are sufficiently small such that the effect can be approximated as T1 recovery.
The mSASHA sequence was validated using a NiCl2-doped agarose T1MES phantom (7) with physiologic T1/T2 combinations corresponding to myocardium and blood in various pathological states. All imaging was performed on a 3T MAGNETOM Prisma (Siemens Healthcare, Erlangen, Germany). Inversion-recovery spin-echo was used for reference T1 measurements with parameters: field of view 360×124 mm2, slice thickness 8 mm, matrix size 192×66, turbo factor 1, echo time (TE) 12 ms, repetition time (TR) 10,000 ms, with 16 inversion times (TI) between 100-5000 ms. Reference T2 measurements were made using spin-echo images with 6 TEs between 12-200 ms in separate measurements and other parameters matched.
Conventional cardiac T1 mapping was performed using the prototype MOLLI (8) and SASHA sequences using a simulated heart rate of 60 bpm. MOLLI was acquired with: field of view 340×255 mm2, slice thickness 8 mm, matrix size 256×144, phase resolution 75%, partial Fourier 7/8, TE/TR 1.15/2.77 ms, GRAPPA rate 2, sampling scheme 5(3)3, and flip angle 35°. SASHA was acquired with one non-prepared image and 10 images with a 600 ms saturation recovery time (TS), VFA readout with 70° maximum, TE/TR 1.29/3.00 ms, and other parameters matched to MOLLI. Conventional cardiac T2 mapping was performed using T2-prepared images with a linear bSSFP readout (9), TE/TR 1.42/3.23 ms, flip angle 70°, 3 images with 0, 30, 55 ms T2p duration separated by 3 recovery beats, and other parameters matched to MOLLI.
mSASHA was acquired using one non-prepared image, 6 SR images with 600 ms TS, and 2 SR+T2p images with 1600 ms TS and 55 ms T2p. A 100° maximum VFA readout was used and other parameters matched to SASHA.
Ten healthy volunteers were recruited with informed consent, and mSASHA, SASHA, MOLLI, T2p-bSSFP sequences were acquired in a short-axis slice with parameters matched to phantom experiments. In vivo images were motion corrected using the Advanced Normalization Tools (ANTs) software (10), and high-contrast images were used to improve motion correction for mSASHA (11). Regions of interest were manually contoured, and T1 and T2 values are reported as mean±standard deviation across the entire ROI. Paired two-sided Student’s t-tests were used to test for statistical significance with p<0.05.
Results
mSASHA had excellent accuracy compared to spin-echo in phantoms, with -0.7±0.4% T1 error and -1.3±1.3% T2 error (Fig. 3). Conventional SASHA also had high accuracy while MOLLI underestimated T1 values by up to 11%, particularly in the short-T2 myocardial-like vials. T2p-bSSFP had significant errors, reaching 78% overestimation in vials simulating post-contrast T1/T2 combinations. Precision of mSASHA T1 (0.68±0.14%) was similar to MOLLI (0.70±0.11%, p>0.05) and better than SASHA (0.76±0.13%, p<0.05). mSASHA T2 precision was also similar to T2p-bSSFP (1.42±0.57% vs 1.45±0.54%, p>0.05).In volunteers (Fig. 4), mSASHA T1 values were not statistically significantly different from SASHA T1 values in both the myocardium (1523±18 ms vs. 1520±18, p>0.05) and blood (2054±61 ms vs. 2060±65 ms, p>0.05, Fig. 5). T2 values with linear T2p-bSSFP were higher than mSASHA in the myocardium (41.3±1.7 ms vs. 36.7±1.1 ms) but lower in the blood (127.9±9.8 ms vs. 160.8±14.8 ms), consistent with over/underestimation observed in phantoms for similar T1/T2 combinations.
The coefficient of variation (CoV) of myocardial T1 values was similar between all three sequences in the myocardium (p>0.05, Fig. 5), but larger for mSASHA compared to MOLLI in the blood (3.0±0.7% vs. 1.6±0.3%, p<0.001). T2 CoV was similar between mSASHA and T2p-bSSFP in both the myocardium and blood (p>0.05).
Discussion
The proposed multi-parametric mSASHA technique extends upon the well-studied SASHA sequence to provide T1 and T2 maps in a single breath-hold, maintaining both high accuracy and precision. Accurate quantification of T1 and T2 with mSASHA enables more comprehensive characterization of the myocardium and each parameter can be reliably measured even if the other is altered.Conclusion
mSASHA enables accurate and precise multi-parametric characterization of the myocardium in a single breath-hold.Acknowledgements
No acknowledgement found.References
- Leiner T, Bogaert J, Friedrich MG, Mohiaddin R, Muthurangu V, Myerson S, Powell AJ, Raman SV, Pennell DJ. SCMR Position Paper (2020) on clinical indications for cardiovascular magnetic resonance. J Cardiovasc Magn Reson 2020;22:1–37.
- Hamilton JI, Jiang Y, Chen Y, Ma D, Lo WC, Griswold MA, Seiberlich N. MR fingerprinting for rapid quantification of myocardial T1, T2, and proton spin density. Magn Reson Med 2017;77:1446–1458.
- Christodoulou AG, Shaw JL, Nguyen C, Yang Q, Xie Y, Wang N, Li D. Magnetic resonance multitasking for motion-resolved quantitative cardiovascular imaging. Nat Biomed Eng 2018;2:215–226.
- Akçakaya M, Weingärtner S, Basha TA, Roujol S, Bellm S, Nezafat R. Joint myocardial T1 and T2 mapping using a combination of saturation recovery and T2-preparation. Magn Reson Med 2016;76:888–896.
- Chow K, Flewitt JA, Green JD, Pagano JJ, Friedrich MG, Thompson RB. Saturation recovery single-shot acquisition (SASHA) for myocardial T1 mapping. Magn Reson Med 2014;71:2082–2095.
- Chow K, Spottiswoode B, Pagano JJ, Thompson R. Improved precision in SASHA T1 mapping with a variable flip angle readout. J Cardiovasc Magn Reson 2014;16:M9.
- Captur G, Gatehouse PD, Heslinga FG, et al. A T1 and ECV phantom for global T1 mapping quality assurance: The T1 mapping and ECV standardisation in CMR (T1MES) program. J Cardiovasc Magn Reson 2016;18:W18–571.
- Messroghli DR, Radjenovic A, Kozerke S, Higgins DM, Sivananthan MU, Ridgway JP. Modified Look-Locker inversion recovery (MOLLI) for high-resolution T1 mapping of the heart. Magn Reson Med 2004;52:141–146.
- Giri S, Chung Y-C, Merchant A, Mihai G, Rajagopalan S, Raman SV, Simonetti OP. T2 quantification for improved detection of myocardial edema. J Cardiovasc Magn Reson 2009;11:56.
- Avants BB, Tustison NJ, Song G, Cook PA, Klein A, Gee JC. A reproducible evaluation of ANTs similarity metric performance in brain image registration. Neuroimage 2011;54:2033–2044.
- Chow K, Yang Y, Shaw P, Kramer CM, Salerno M. Robust free-breathing SASHA T 1 mapping with high-contrast image registration. J Cardiovasc Magn Reson 2016;18:47.
Figures
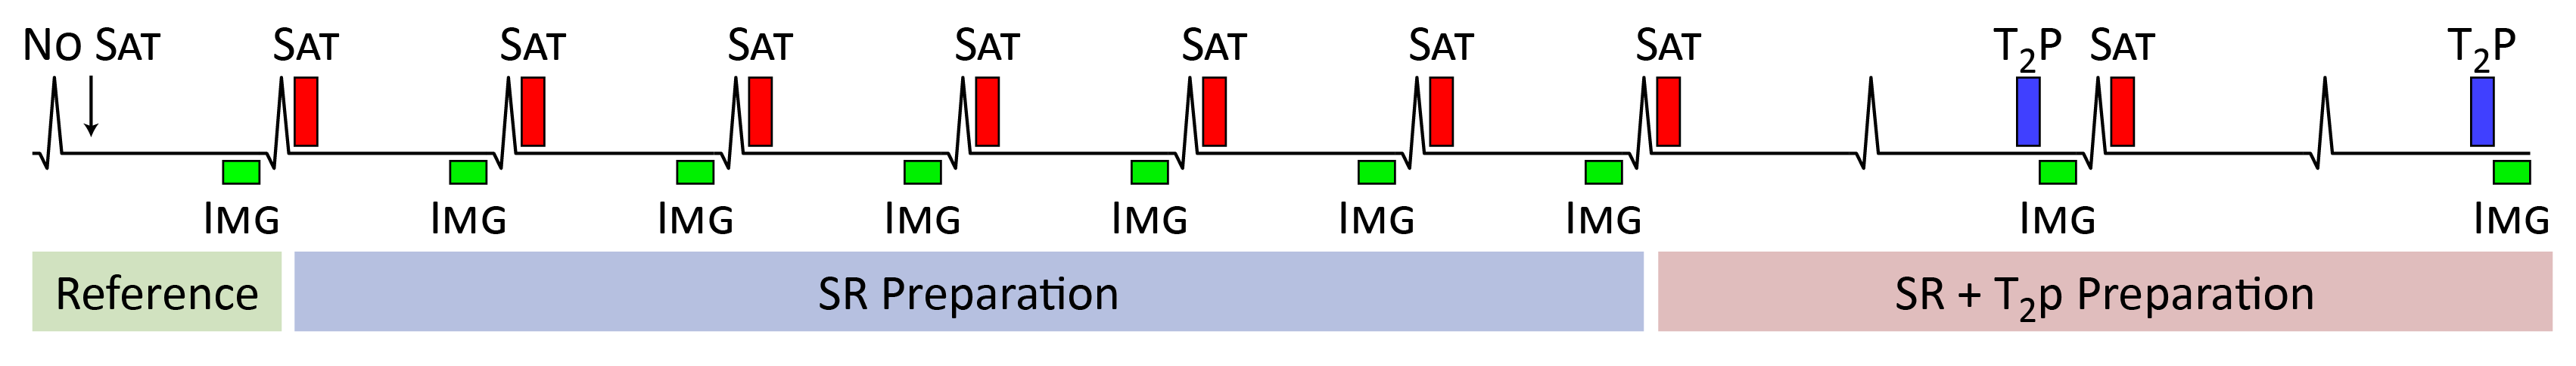
Fig. 1. Sequence diagram for multi-parametric SASHA. A series of images are acquired without magnetization preparation, with saturation-recovery preparation, and with both saturation-recovery and T2-preparation.
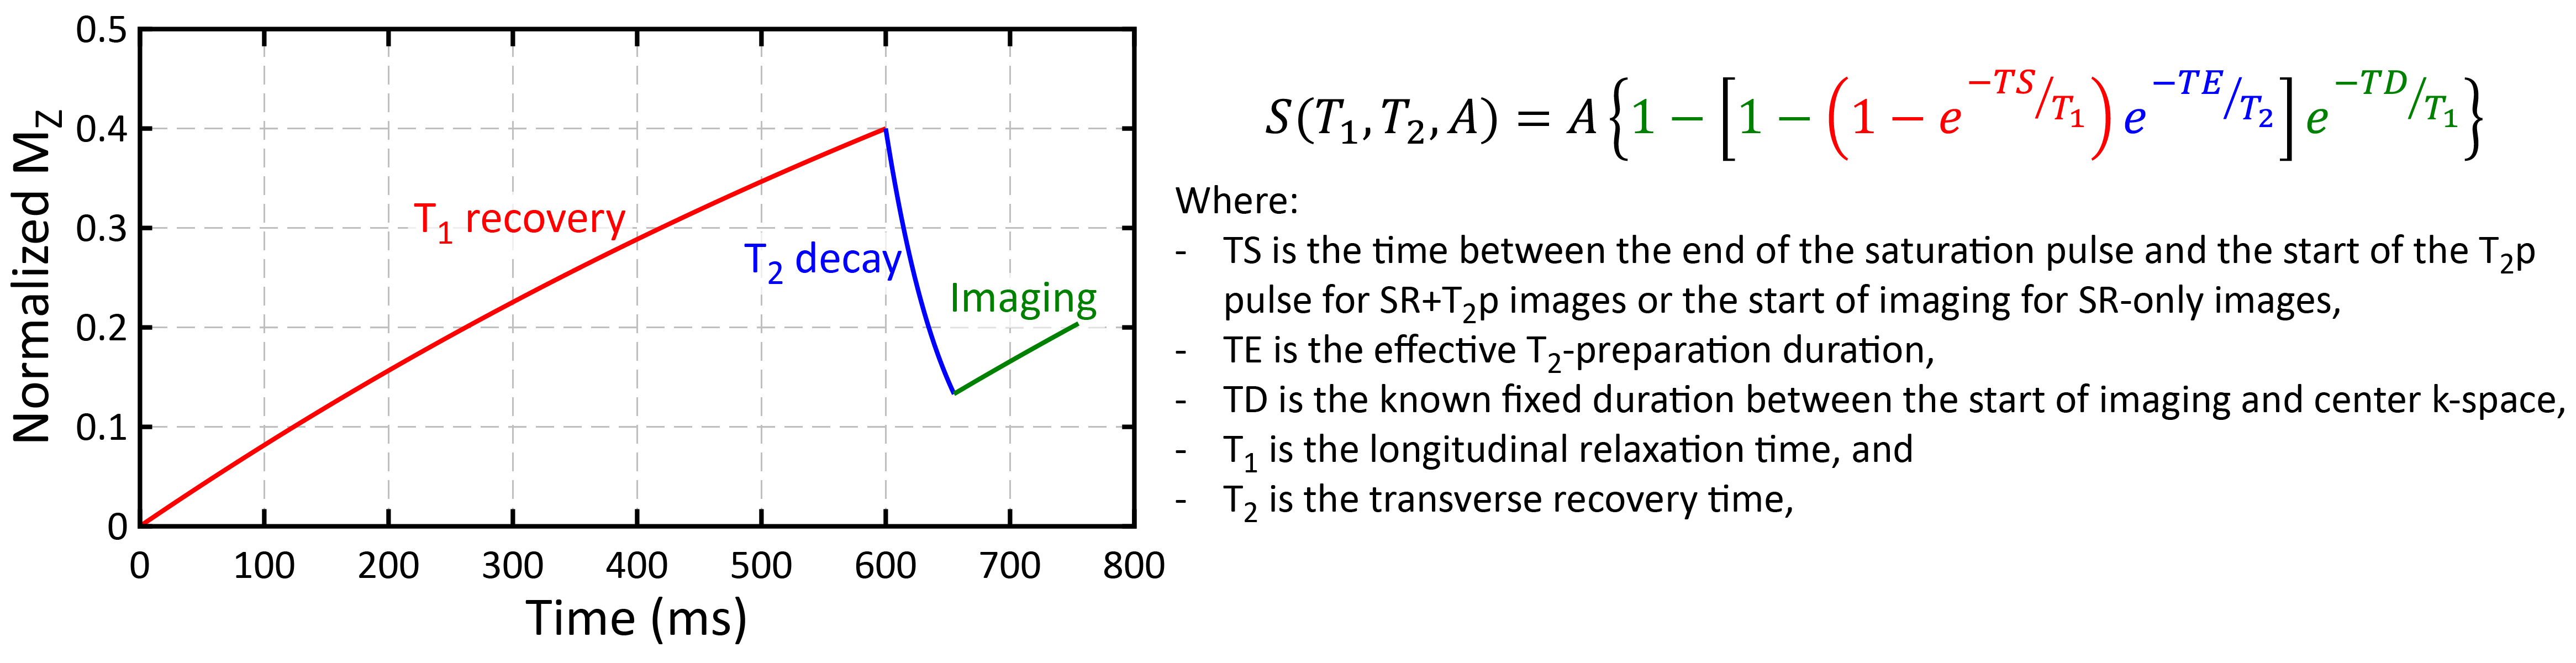
Fig. 2. Three-parameter signal model for multi-parametric SASHA. The magnetization evolution for each image can be described as a combination of T1 recovery, T2 decay, and the effect of the imaging readout. For a VFA bSSFP readout, the imaging component can be approximated as T1 recovery.
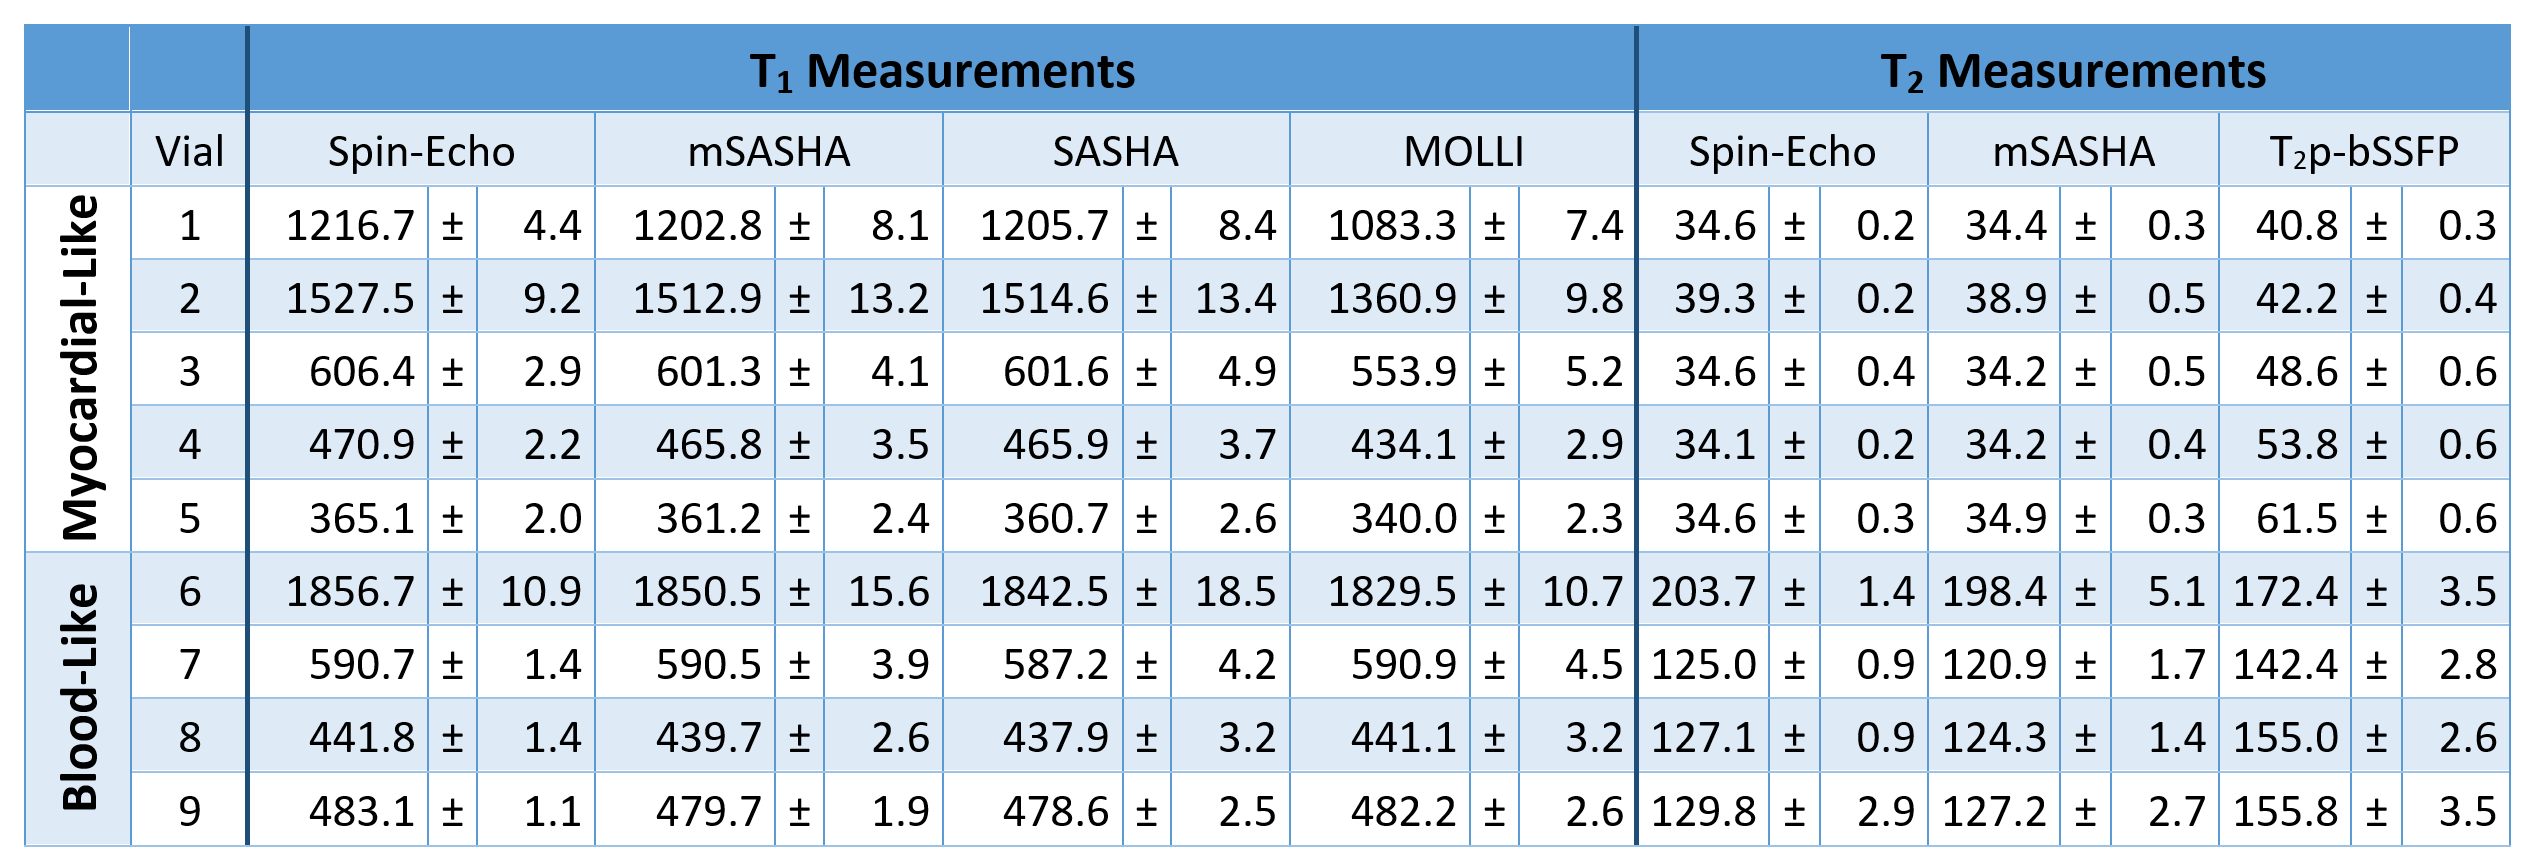
Fig. 3. T1 and T2 measurements with various sequences in a NiCl2-doped agarose T1MES phantom.
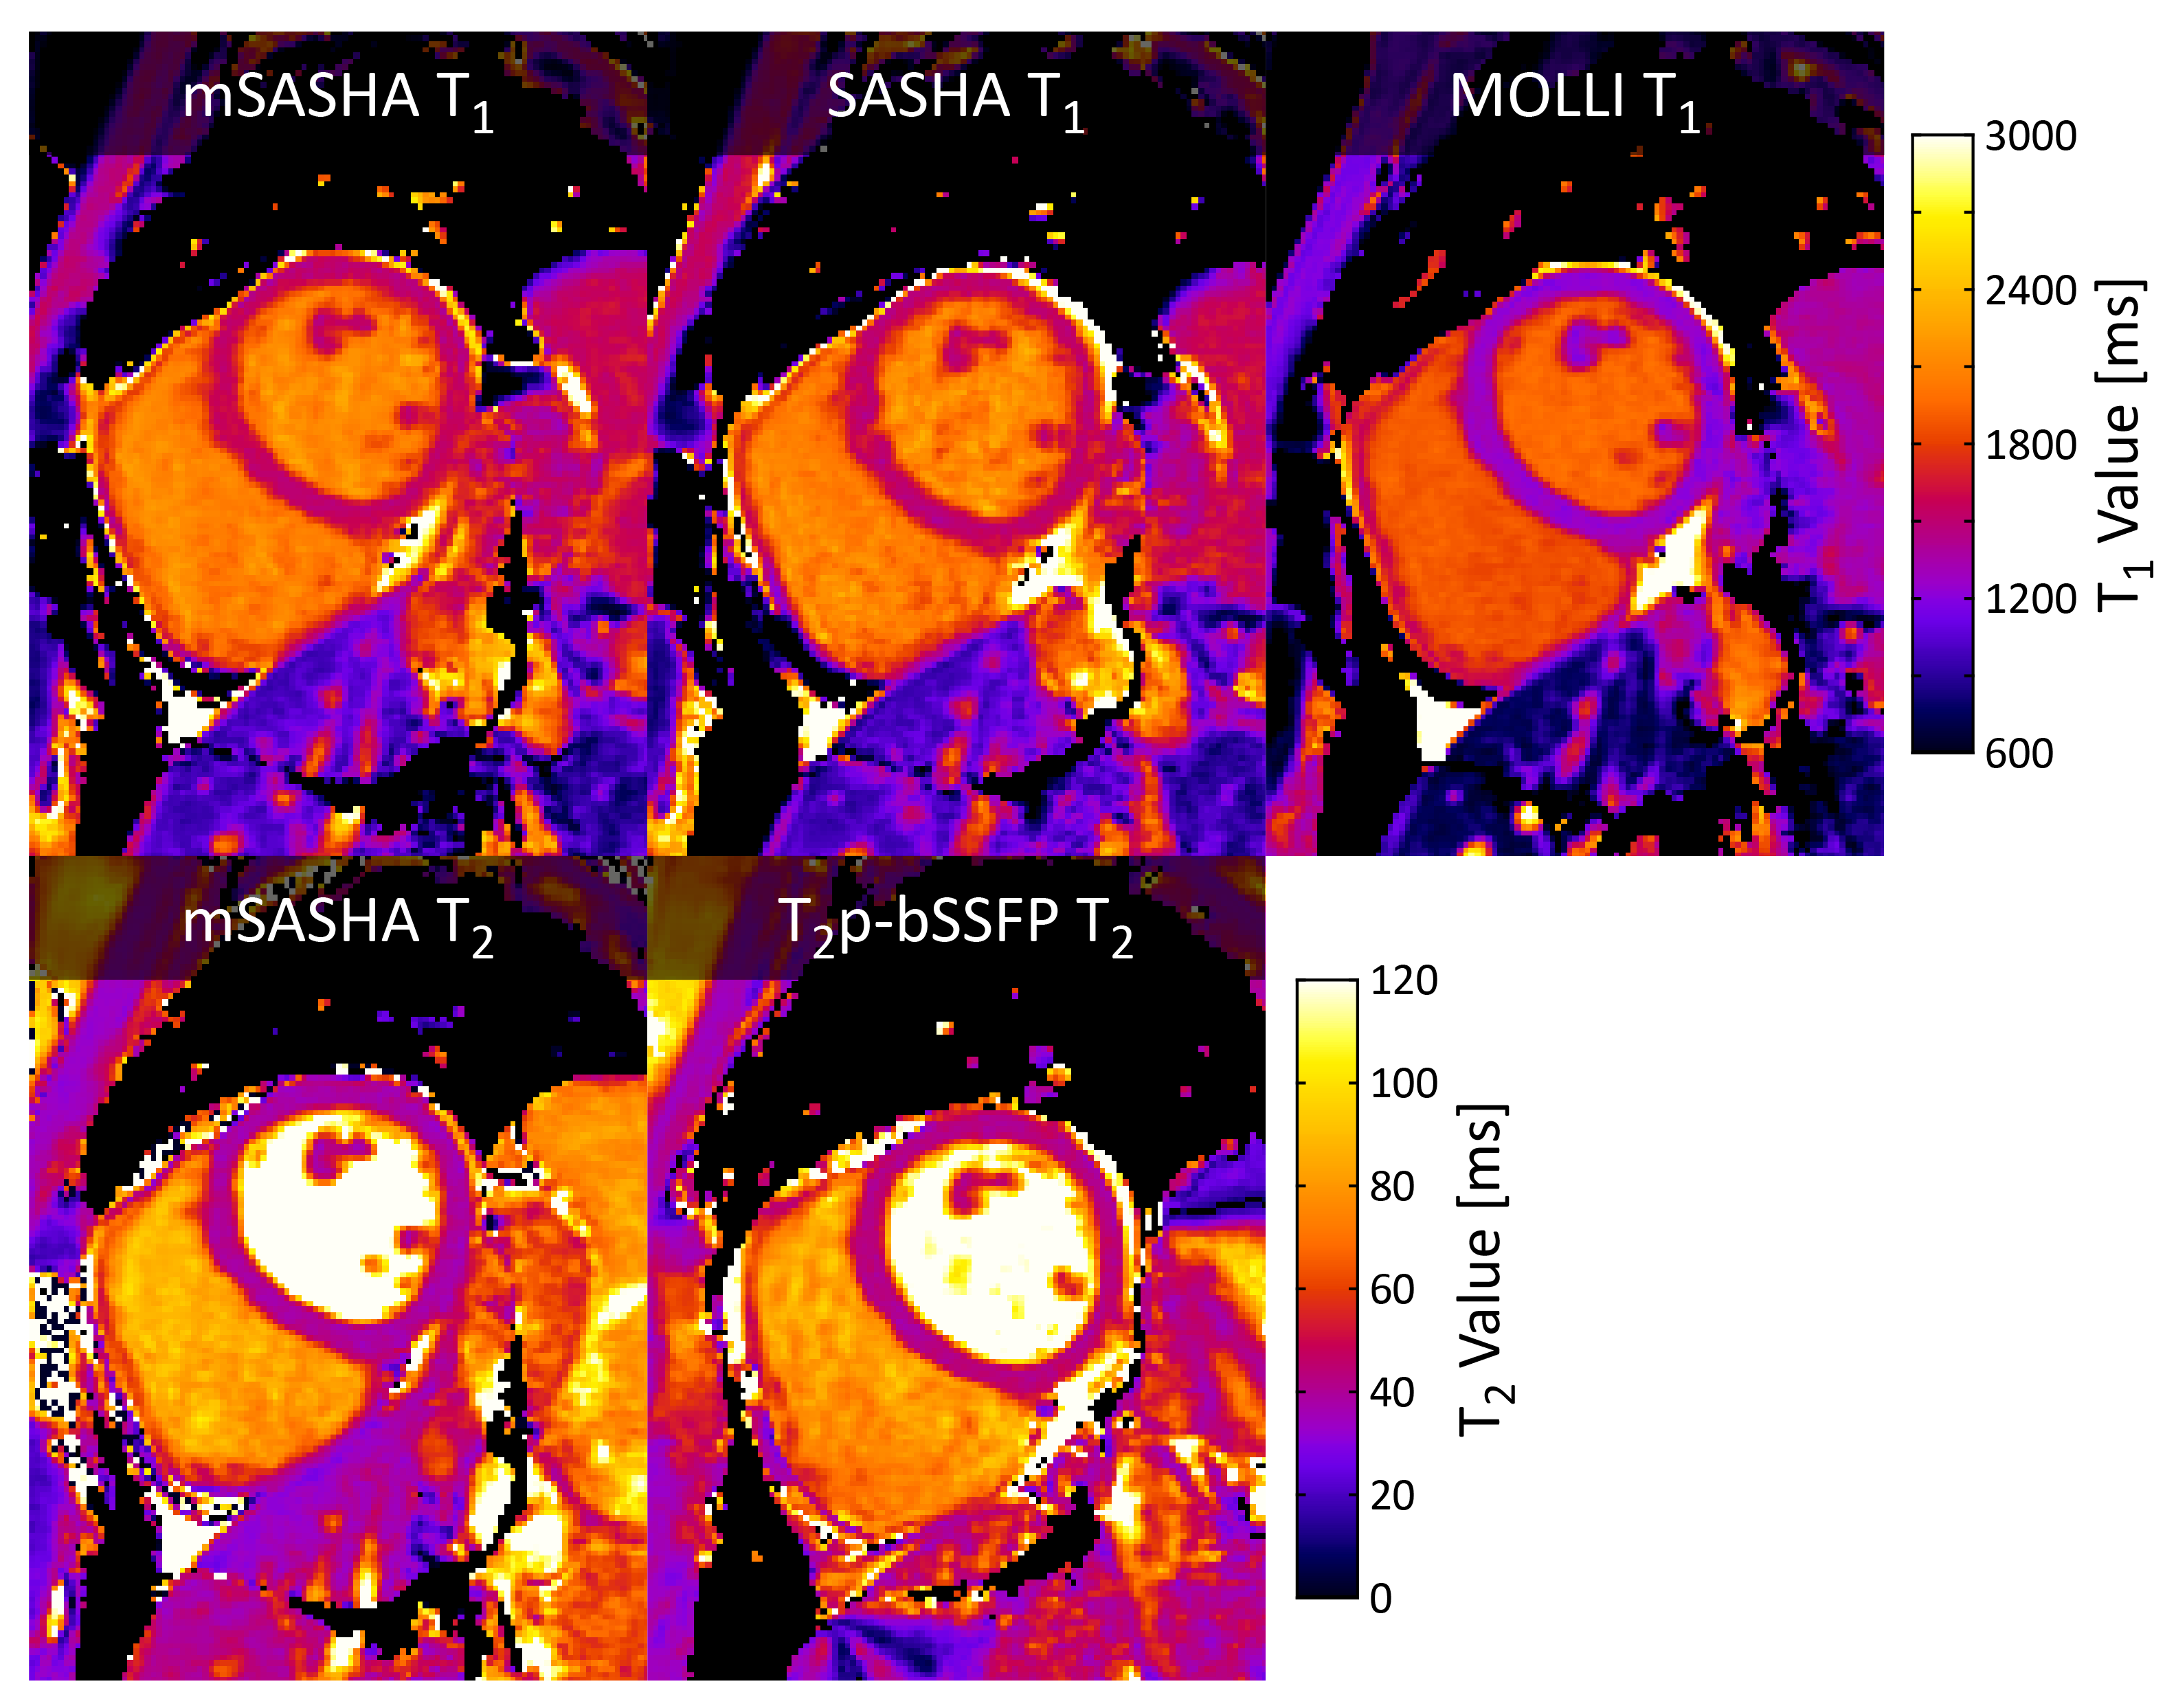
Fig. 4. T1 and T2 maps with mSASHA, SASHA, MOLLI, and linear T2p-bSSFP in a healthy volunteer at 3T.
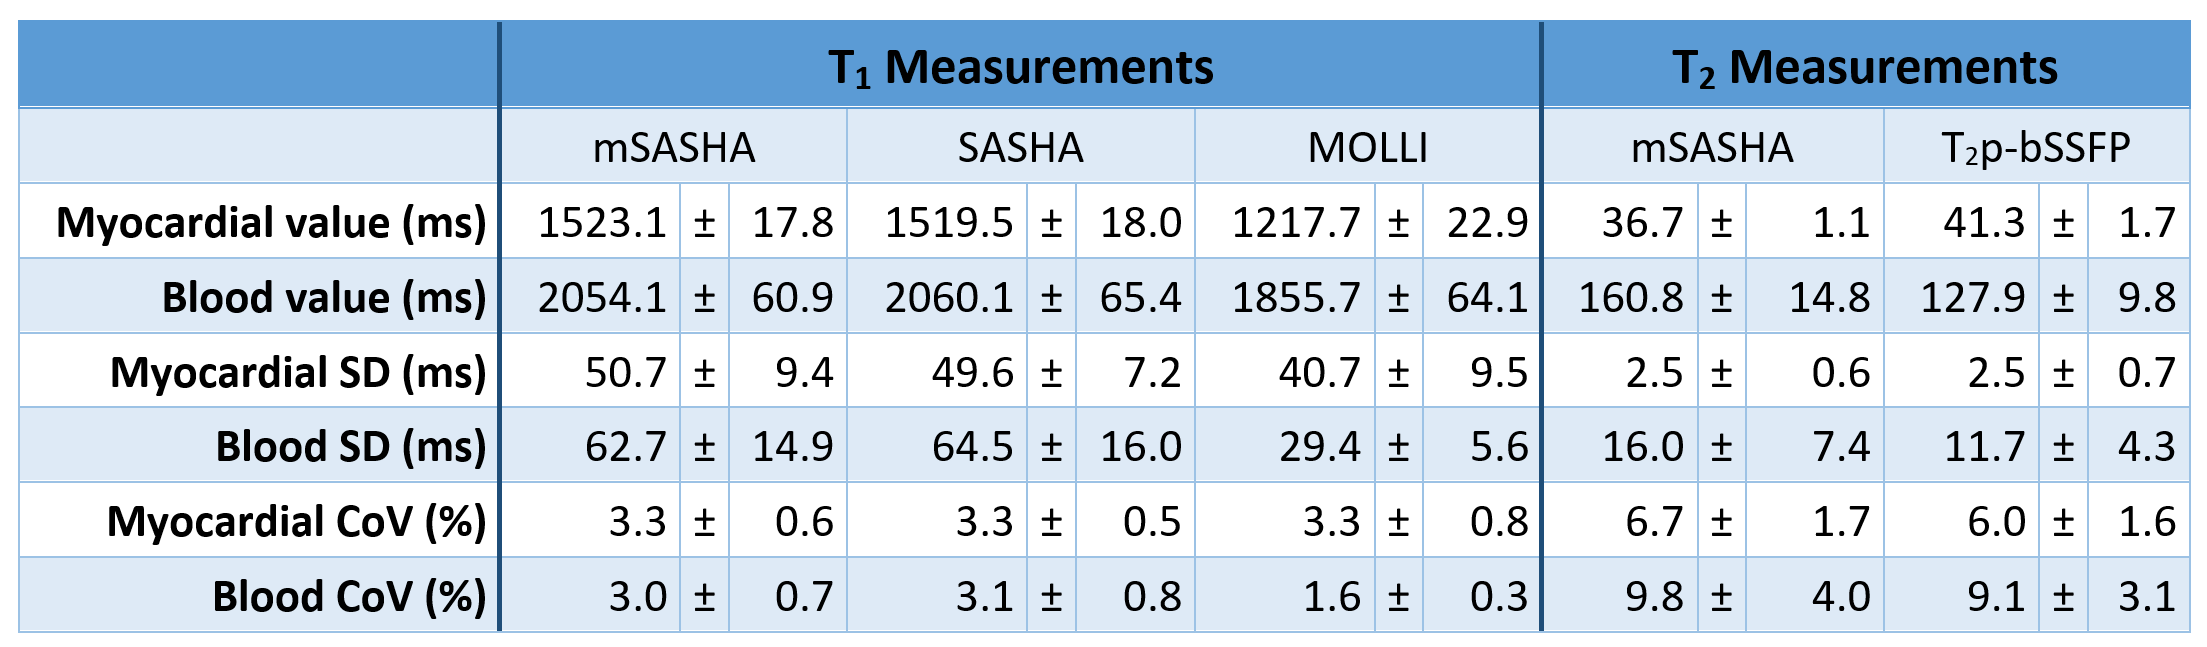
Fig. 5. T1 and T2 values with mSASHA, SASHA, MOLLI, and T2p-bSSFP in 10 healthy volunteers at 3T.