0613
Efficient T2 mapping of the Abdomen with low SAR Variable Flip Angle Radial Turbo Spin Echo1Siemens Medical Solutions USA Inc, New York, NY, United States, 2Medical Imaging, University of Arizona, Tucson, AZ, United States, 3Electrical and Computer Engineering, University of Arizona, Tucson, AZ, United States, 4Biomedical Engineering, University of Arizona, Tucson, AZ, United States
Synopsis
Radial TSE techniques have been proposed for abdominal T2-weighted (T2w) imaging and T2 mapping. Slice efficiency of breath-held RADTSE is limited by the specific absorption rate (SAR). We present a reduced SAR variable refocusing flip angle RADTSE (RADTSE-VFA) technique designed for efficient slice coverage and improved T2 estimation. The flip angles are designed to (1) minimize T2 estimation error, (2) improve lesion-liver relative contrast, and (3) minimize SAR. RADTSE-VFA generated T2w images with comparable contrast as constant flip angle RADTSE while resulting in a 60% increase in slice coverage at a 1.5x reduction in SAR.
Introduction
T2-weighted (T2w) imaging is routinely used in the clinic for the diagnosis of focal liver lesions. The difference in signal intensity in T2w images allows radiologists to differentiate malignancies from the most common benign lesions (cysts and hemangiomas). The qualitative analysis of T2w images for differentiating abdominal neoplasms is inherently subjective and prone to inconsistency1. As an alternative, the estimation of T2 relaxation times through an accelerated radial TSE (RADTSE) sequence2,3 that yields TE images with high spatial and temporal resolution from a single breath hold has been proposed. In breath-held TSE pulse sequences, slice coverage is limited by the specific absorption rate (SAR). Although, the use of refocusing pulses with flip angles (FA) less than 180o can be exploited to reduce SAR and increase slice coverage4,5, the late echoes are affected by noise due to signal decay which compromises accuracy of T2 estimation. In this work we present a reduced SAR variable refocusing flip angle (VFA) RADTSE technique designed for efficient slice coverage and improved T2 estimation.Methods
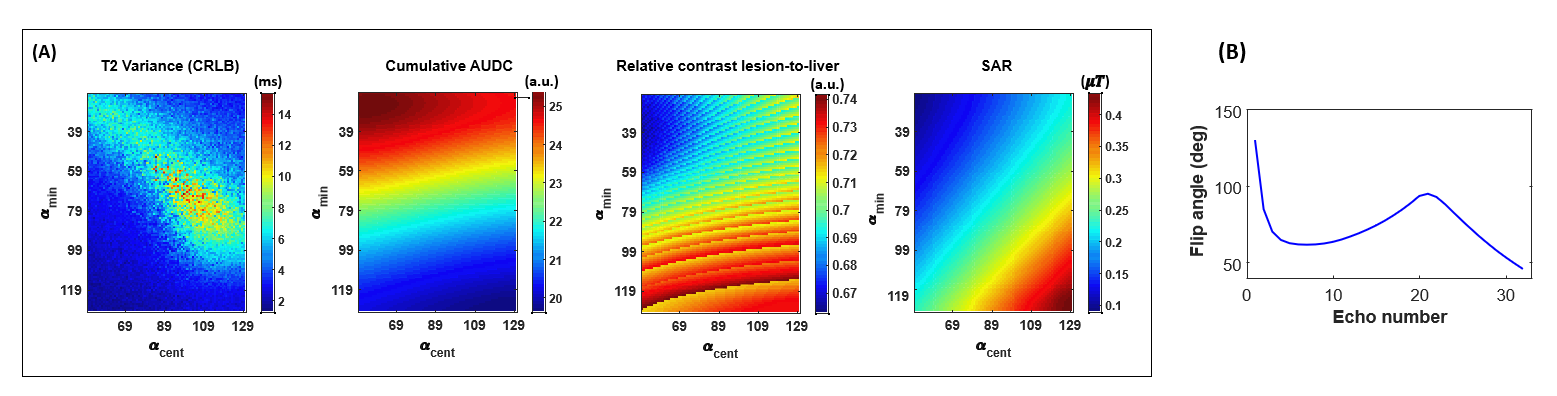
The VFA scheme was designed based on 4 control angles6 optimized to (1) maintain the signal above the noise floor (S/N) through the echo train length (ETL), (2) minimize variance of T2 estimation based on the Cramer Rao lower bound (CRLB), (3) improve relative contrast between malignant lesions and liver, and (4) reduce SAR. The area under the T2 decay curve (AUDC) was used to compute S/N; $$$b1_{+rms}$$$ was used as a subject independent measure of SAR; relative contrast lesion-to-liver contrast was defined as $$$relC_{lesion\_to\_liver}= \frac{s_{lesion} (TE)-s_{liver} (TE)}{s_{liver} (TE)}$$$ and computed at TE=90ms. Figure 1A shows 2D plots of the objective function and constraints for the CRLB, AUDC, $$$relC_{lesion\_to\_liver}$$$, and $$$b1_{+rms}$$$. Figure 1B shows the VFA scheme for ETL=32 based on the optimal choice of control angles $$$ \vec{\alpha}=[60^∘,120^∘,40^∘,130^∘] $$$ used in this study.Phantom data were acquired with the VFA and constant FA RADTSE (ETL=32, echo spacing=8ms, TR=2sec, constant FA=150o). Reference T2 estimates were acquired using a single-echo spin-echo sequence (32 TEs in increments of 8ms). In vivo data were acquired on 17 subjects at 1.5T with VFA and constant FA RADTSE (ETL=32, echo spacing=6.7ms, TR=2.5sec, breath-hold=18sec).
T2w images (32 TEs) were reconstructed from undersampled data (6 views per TE) using an iterative algorithm2 which incorporates RF pulse information and B1 into the signal model for accurate T2 estimation. A dictionary based fitting approach was used to estimate the T2 maps.
Results and Discussion
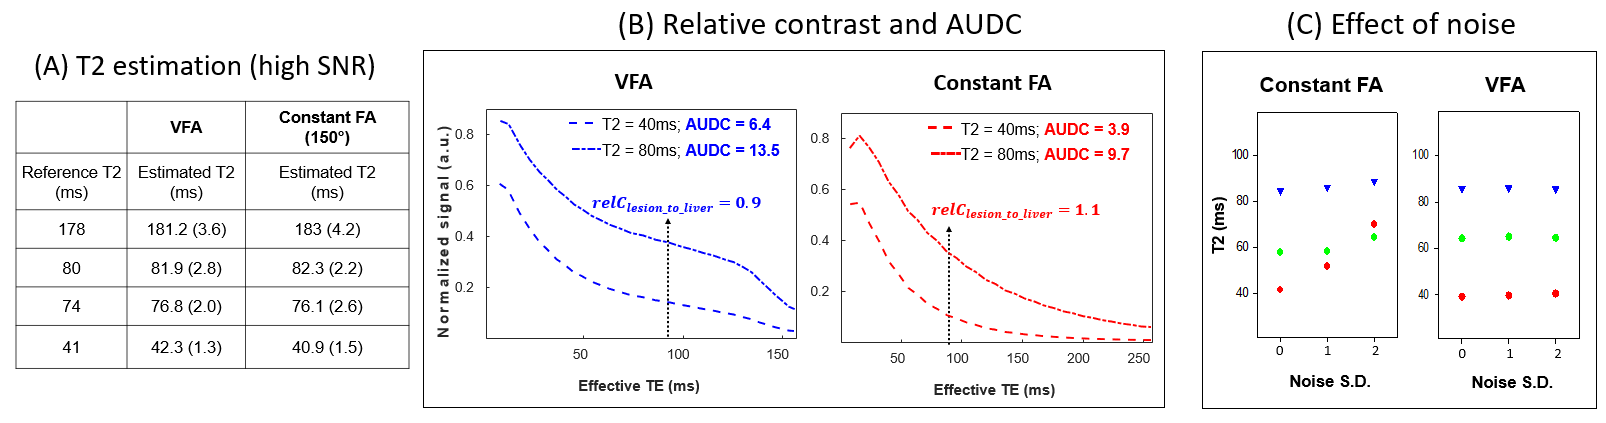
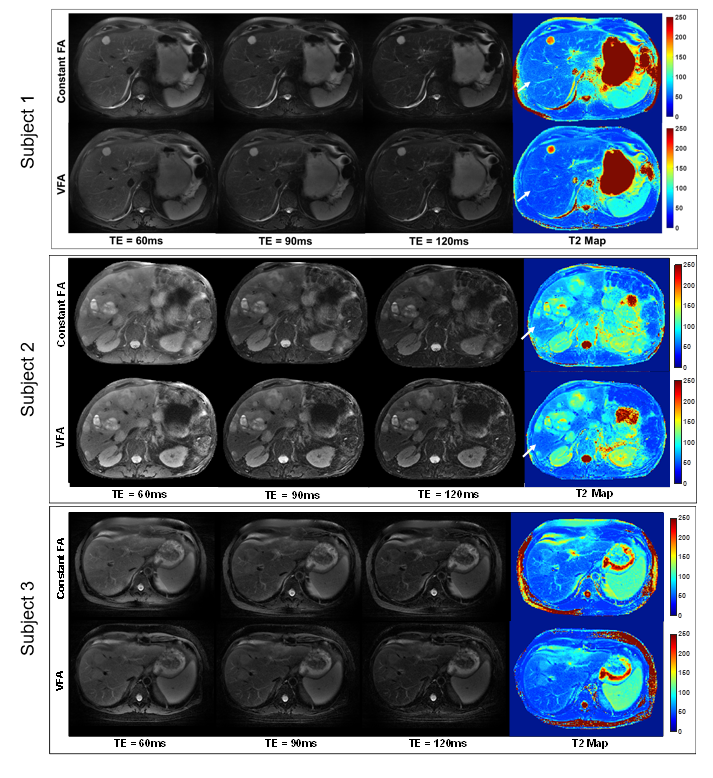
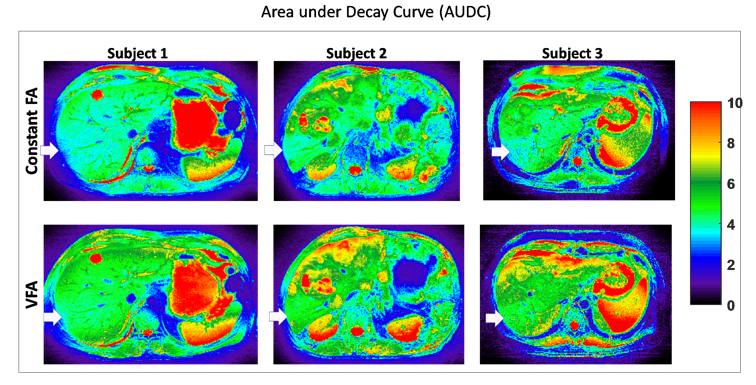
As shown in Figure 2A, phantom T2 values from VFA and constant FA RADTSE match the reference values. Figure 2B show the decay curves for phantoms with T240ms and T280ms (representing liver and malignancies). Note that both VFA and the constant FA schemes provide a similar relative contrast at TEeff=90ms, the contrast typically used by radiologists to detect focal liver lesions. The VFA scheme provides a higher AUDC over the echo train than the constant FA. To analyze the effect of noise on T2 estimation, noise was added to the phantom data. As can be seen in Figure 2C, T2 estimation changes significantly with noise levels for the constant FA with a stronger effect for the phantom with T2=40ms. This effect is not seen in the VFA scheme, due to the higher signal level in the late echoes.Figure 3 shows T2w images (3 out of 32 TEs) and T2 maps for subjects with a hemangioma, liver metastases, and hepatocellular carcinoma. A major advantage of VFA RADTSE is that slice efficiency is 60% higher than the constant FA due to a reduced SAR, (mean SAR VFA=1.08, mean SAR constant FA=1.62). Moreover, the constant FA T2 maps have “artificially” higher T2 values in the central part of the liver (arrows), a region of low SNR due to reduced soil sensitivities. The effect is not seen in the VFA T2 maps. This is consistent with the results of Figure 2C (for lower T2 species) as well as the AUDC maps shown in Figure 4 (note the lower AUDC in the central part of liver in the constant FA compared to the upper liver). The AUDC values for the VFA are higher through the anatomy and also more uniform within the same organ.
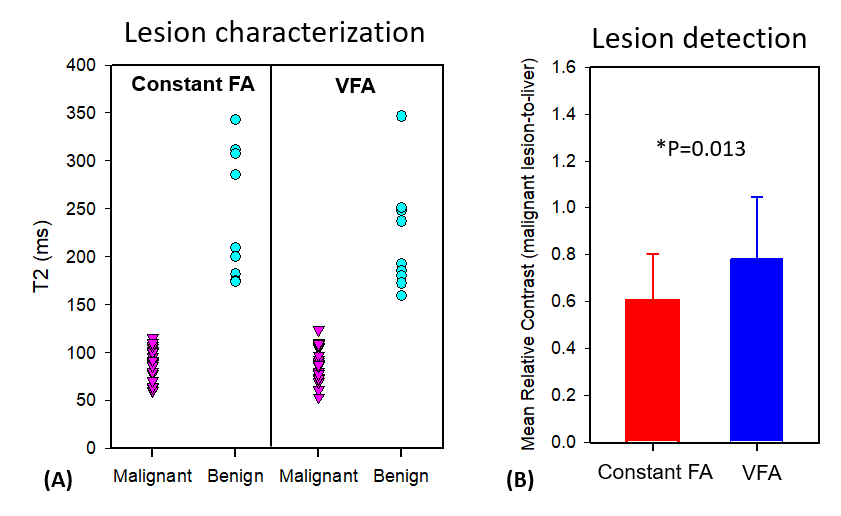
Figure 5A shows the T2 distributions for a total of 24 focal liver lesions. Both constant and VFA methods yield excellent separation between benign and malignant lesions and the mean and standard deviation for malignancies and benign are comparable between the two methods (p=0.435). The relative contrast between malignant lesions and adjacent liver, which is related to lesion conspicuity, is higher for the VFA method (p=0.013) as shown in Figure 5B.
Conclusion
A variable flip angle radial TSE sequence optimized for abdominal imaging was presented. The method yields anatomical images for 32 TEs and a T2 map for 11 slices in a single breath hold. T2 estimation, slice coverage and relative contrast between malignancies and liver is superior than the constant flip angle method. An extension of the method for higher ETLs should provide full liver anatomical coverage with T2 mapping in only 1-2 breath-holds.Acknowledgements
We would like to acknowledge grant support from NIH (CA245920), the Arizona Biomedical Research Commission (ADHS14-082996), and the Technology and Research Initiative Fund Technology and Research Initiative Fund (TRIF).References
1. Fenlon, H. M., Tello, R., Victor, L. S., & Yucel, E. K. (2000). Signal characteristics of focal liver lesions on double echo T2-weighted conventional spin echo MRI: observer performance versus quantitative measurements of T2 relaxation times. Journal of computer assisted tomography, 24(2), 204-211.
2. Huang C., Bilgin A., Barr T., Altbach M, T2 relaxometry with indirect echo compensation from highly undersampled data, Magnetic Resonance in Medicine, 70(4) 2013
3. Altbach M., Bilgin A., Li Z., Clarkson E., Trouard T., Gmitro A., Processing of radial fast spin-echo data for obtaining T2 estimates from a single k-space data set, Magnetic Resonance in Medicine, 54 2005
4. Hennig, Jürgen, and Klaus Scheffler. "Easy improvement of signal‐to‐noise in RARE‐sequences with low refocusing flip angles." Magnetic Resonance in Medicine: An Official Journal of the International Society for Magnetic Resonance in Medicine 44.6 (2000): 983-985.
5. Lebel, R. Marc, and Alan H. Wilman. "Transverse relaxometry with stimulated echo compensation." Magnetic resonance in medicine 64.4 (2010): 1005-1014.
6. Busse RF, Brau ACS, Vu A, Michelich CR, Bayram E, Kijowski R, Reeder SB, Rowley HA. Effects of refocusing flip angle modulation and view ordering in 3D fast spin echo. Magn Reson Med 2008;60: 640-649
Figures