0611
Free-Breathing, Confounder Corrected T1 Mapping in the Liver with Stack-of-Stars Inversion Recovery MRI1Department of Biomedical Engineering, University of Wisconsin-Madison, Madison, WI, United States, 2Department of Radiology, University of Wisconsin-Madison, Madison, WI, United States, 3Global MR Applications and Workflow, GE Healthcare, Madison, WI, United States, 4Global MR Applications and Workflow, GE Healthcare, Atlanta, GA, United States, 5Department of Medical Physics, University of Wisconsin-Madison, Madison, WI, United States, 6Department of Medicine, University of Wisconsin-Madison, Madison, WI, United States, 7Department of Emergency Medicine, University of Wisconsin-Madison, Madison, WI, United States
Synopsis
Quantitative T1 mapping in the liver is an emerging biomarker of hepatic fibrosis and characterization of liver function. The variable flip angle approach with Cartesian sampling is among the most popular T1 mapping methods used in the abdomen. A major drawback of this approach is that T1 estimations are highly sensitive to B1 inhomogeneities. Furthermore, Cartesian sampling suffers from motion related ghosting artifacts and requires breath-holding acquisitions. In this study, we propose to combine stack-of-stars radial sampling with dual-echo inversion recovery (IR-SoS) MRI for confounder corrected T1 mapping in the abdomen.
Introduction
Quantitative T1 mapping has emerged as a quantitative biomarker of hepatic fibrosis using native T1 measurements1-3. Further, the change in T1 after the administration of gadoxetic acid is emerging as a biomarker of liver function4.Conventional T1 mapping methods in the abdomen include variable flip angle (VFA) technique with additional calibration scan for B1 correction and multi-echo spoiled gradient echo (SGRE) acquisition to separate water and fat signals5-7. Such techniques require breath-holding acquisitions which put limitations to scan parameters such as resolution, SNR and scan time, limiting its use in children and elderly patients.
Breath-held 2D inversion recovery (IR) modified Look-Locker (MOLLI) methods have also been proposed, based on the application of cardiac T1 mapping methods in the liver8. This strategy is limited by the acquisition of a single slice per breath-hold and also the confounding effects of liver fat9.
In this work, we propose the combination of inversion recovery MRI with a multi-echo stack-of-stars k-space sampling for fat-corrected T1 mapping in the liver. The proposed method takes advantage of motion robustness of radial sampling for free-breathing acquisition. Furthermore, it addresses multiple confounding factors, such as fat and B1 inhomogeneities, by leveraging both chemical shift and T1 differences between fat and water, simultaneously.
Theory
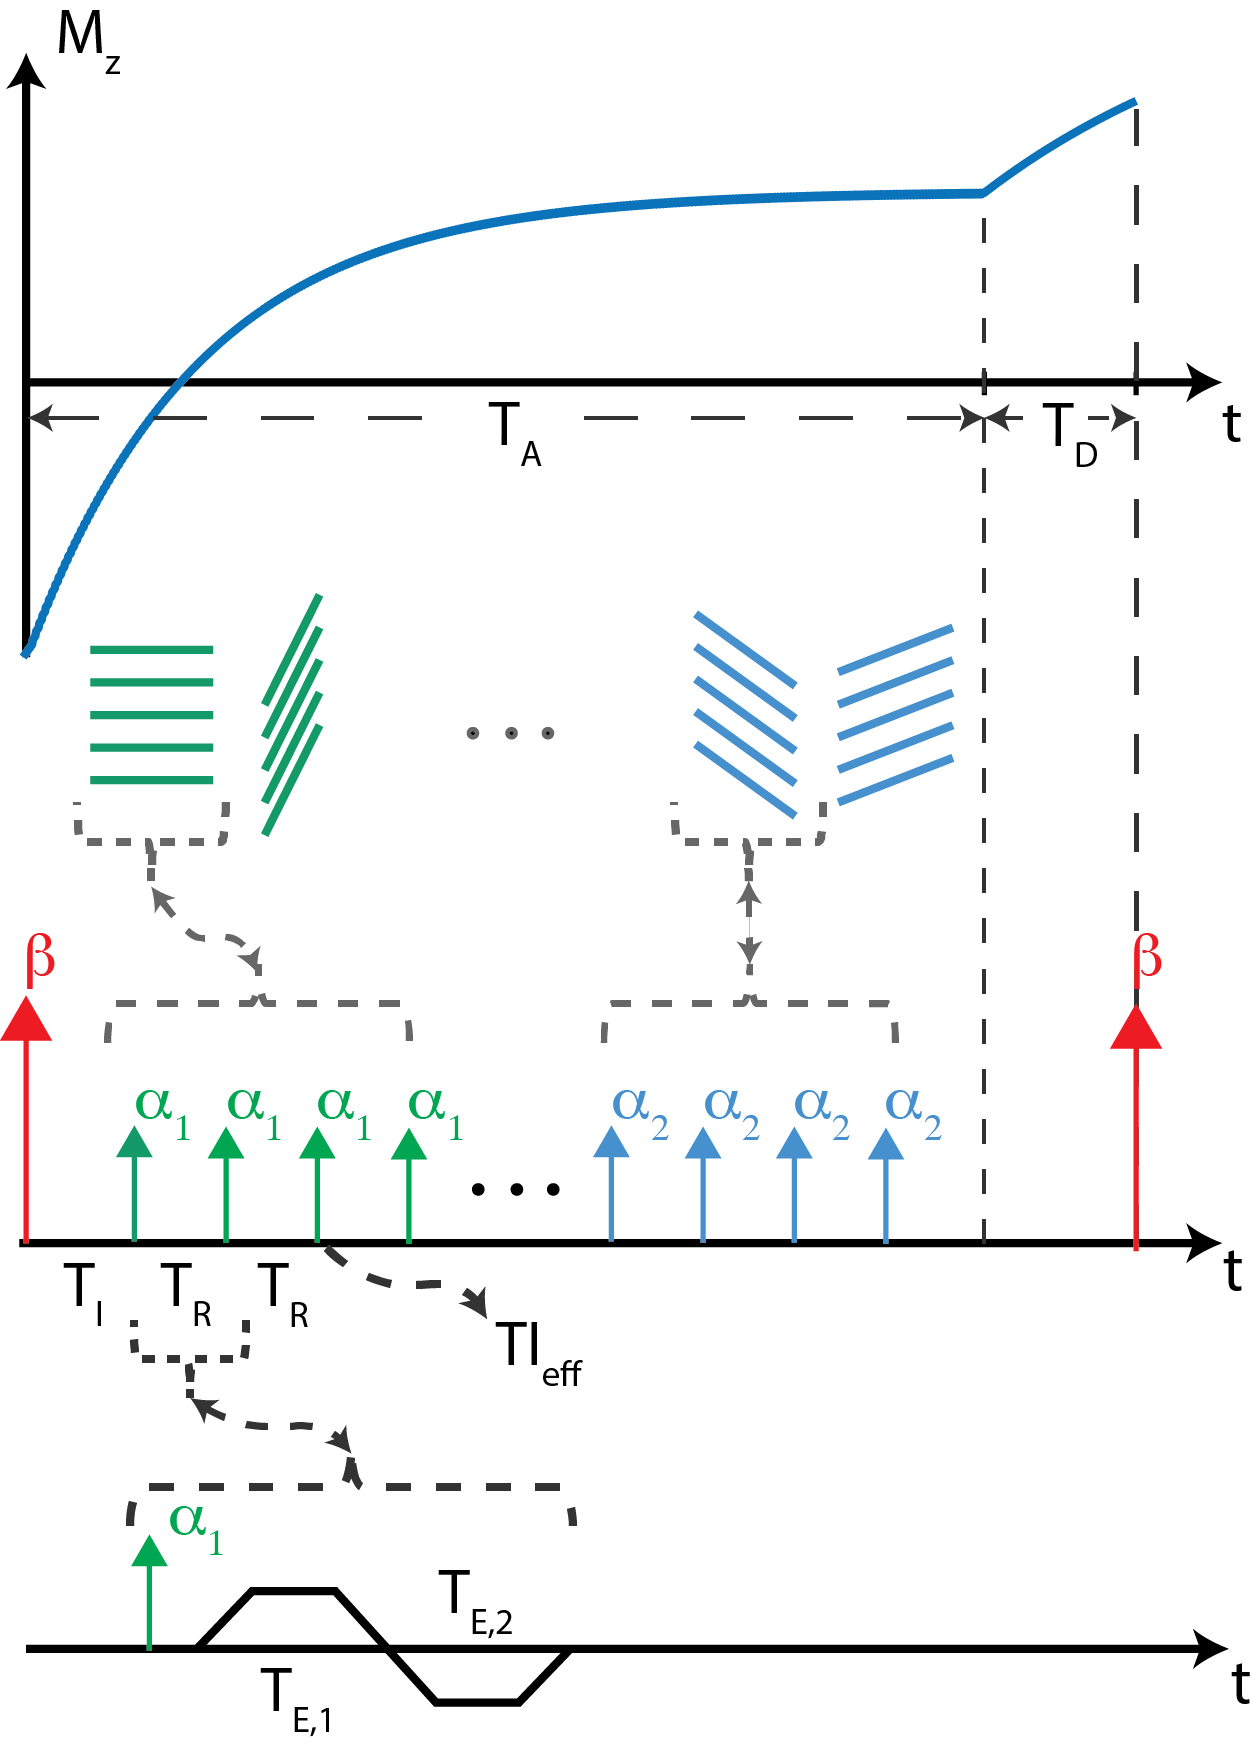
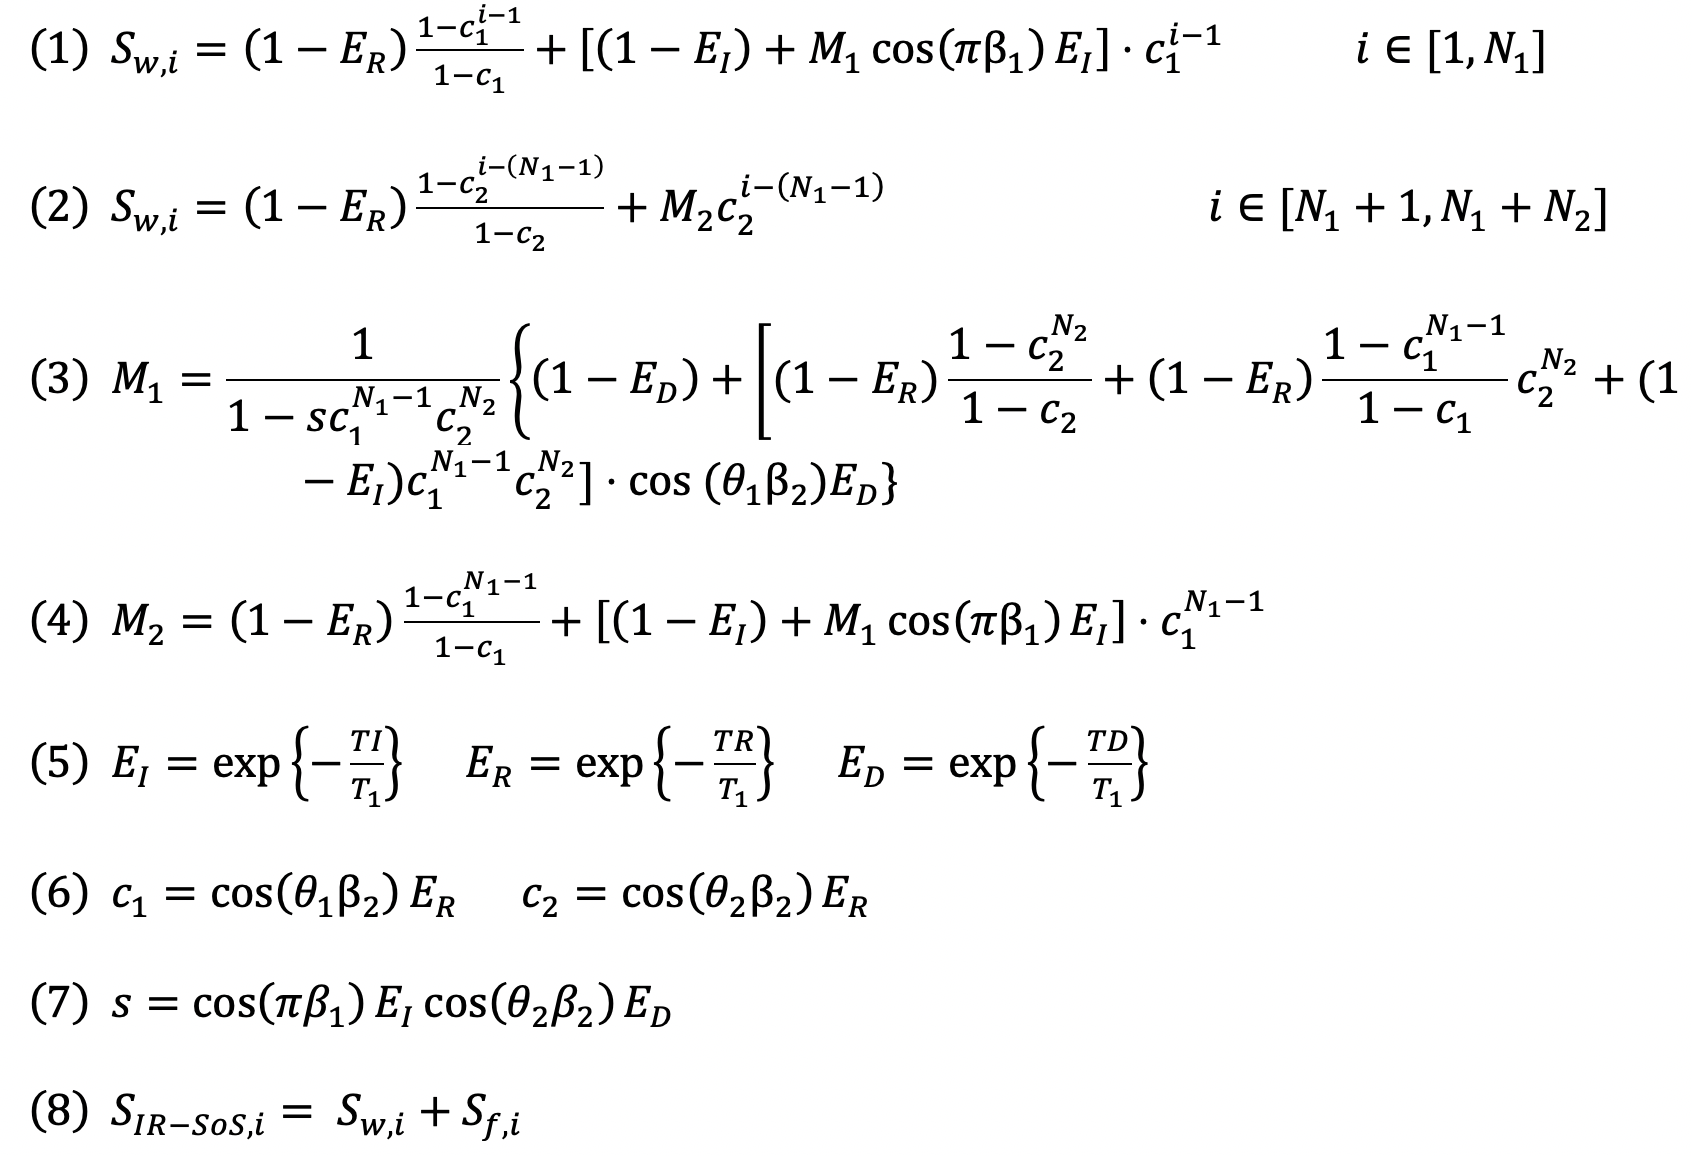
Inversion recovery-based acquisitions are popular for T1 mapping strategies due to utilization of full dynamic range of the T1 recovery. In a recently published work, we proposed a T1 mapping method that corrects for multiple confounder factors, such as B0/B1 inhomogeneities and partial volume effects on T1 estimations stemming from presence of fat, by separately acquiring IR-T1w and chemical shift encoded (CSE) images and using two compartment signal equation to fit T1 separately for water and fat signals11. In this work, we are combining dual-echo MRI with stack-of-stars inversion recovery MRI for truly simultaneous correction of B1 inhomogeneities and the presence of fat.MRI Acquisition: An adiabatic, spatially non-selective inversion pulse is applied, followed by the acquisition of a series of radial stacks, rotated by the golden angle increments. The number of radial stacks is determined by the T1 relaxation of the tissue of interest. Radial stacks, during T1 recovery, are acquired with varying flip angles to simultaneously fit for B1 (excitation) and inversion inefficiencies12. A dual-echo acquisition is achieved using bipolar gradients for each kz-encode. Figure 1 illustrates the proposed dual-echo inversion recovery stack-of-stars pulse sequence. The signal measured from this acquisition can then be modeled using a bi-exponential signal model summarized with equations in Figure 2.
Methods
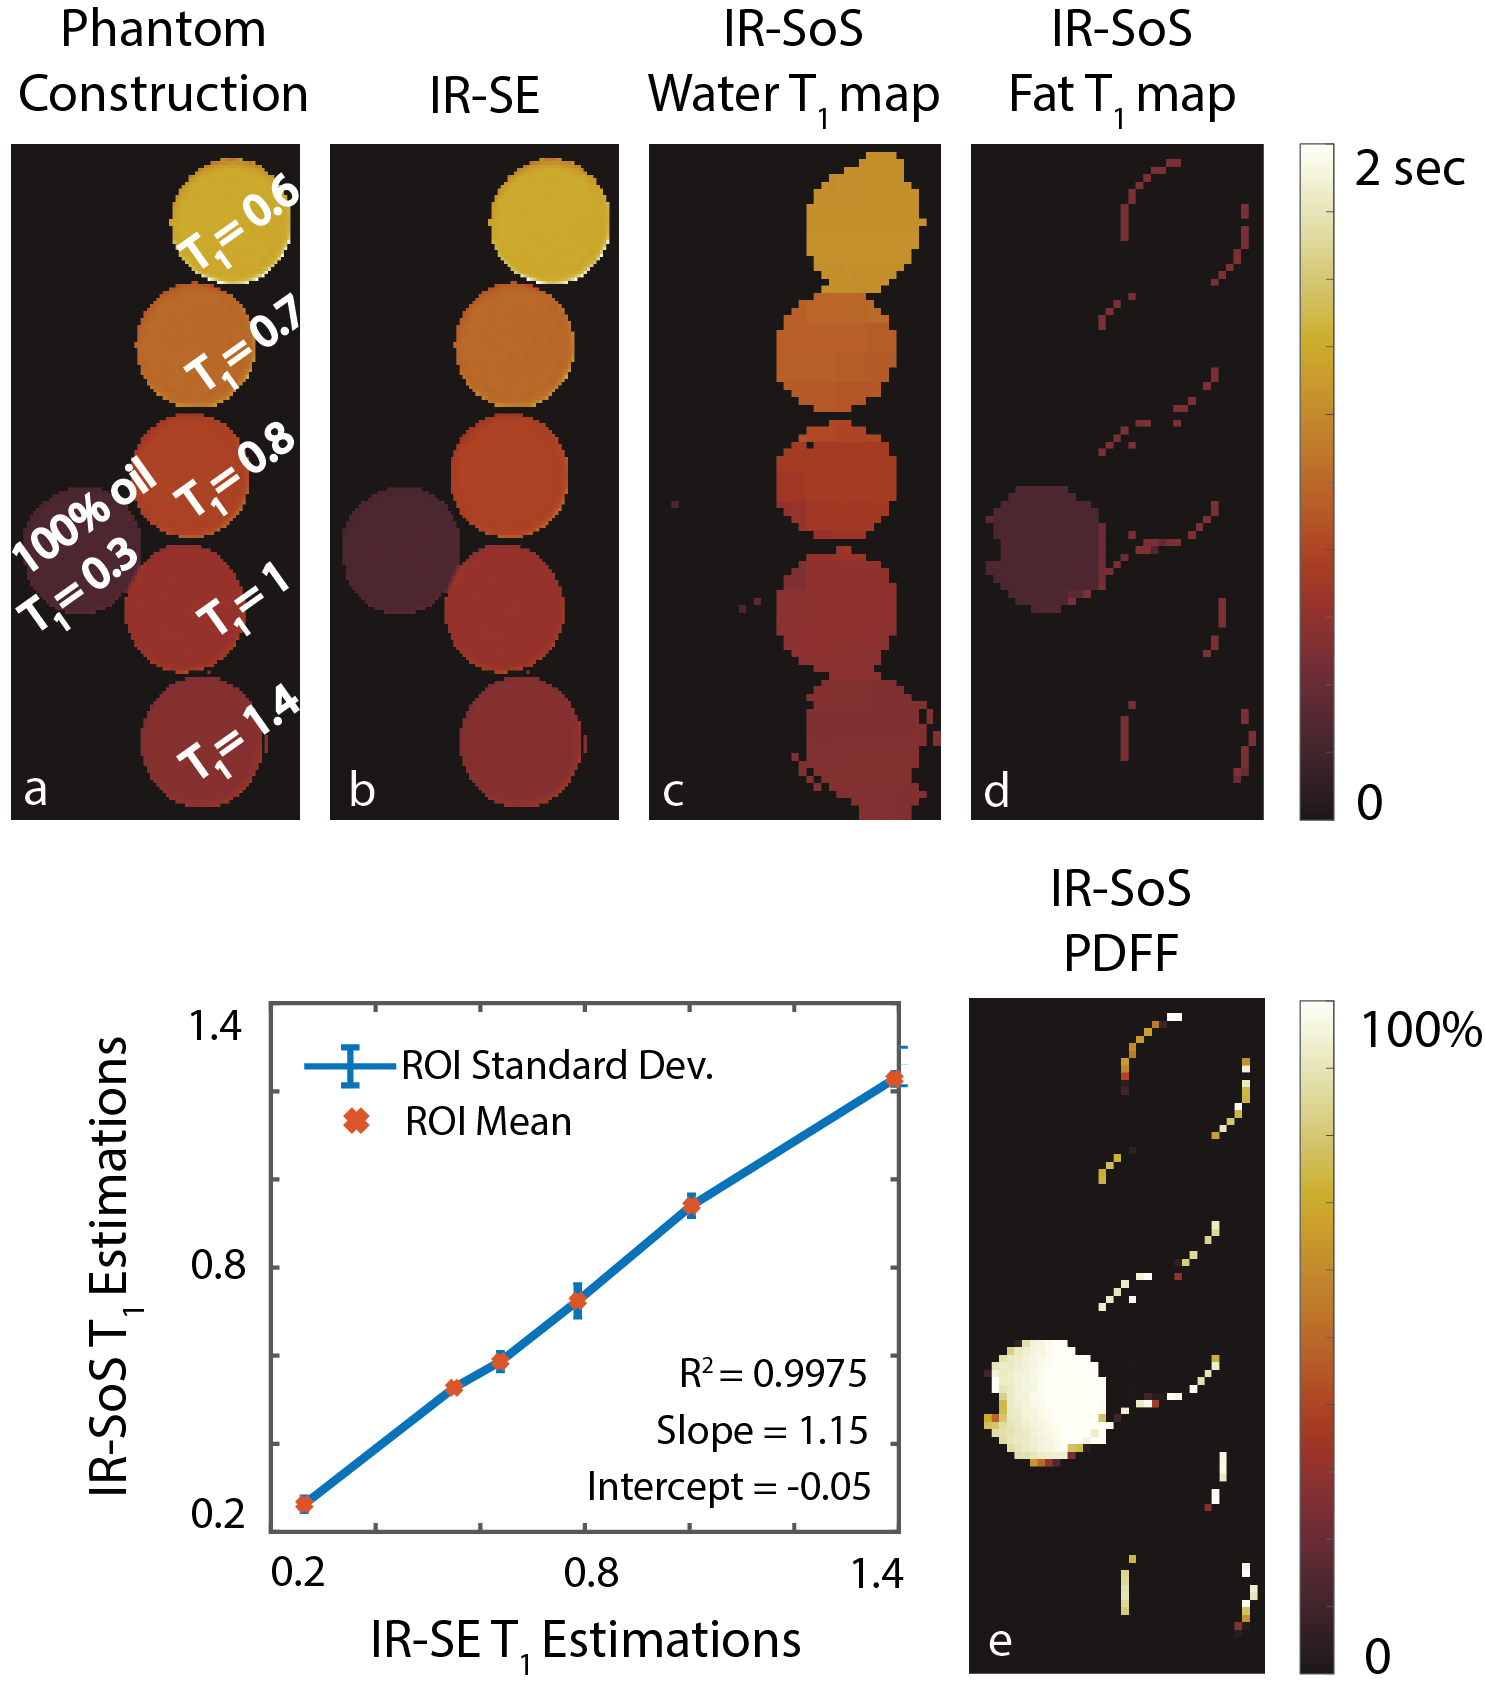
Phantom Imaging: Dual-echo (in-phase and out-of-phase) radial stack-of-stars (SOS) images were acquired on a phantom with varying T1 relaxations (260-1400msec) on a 3T MR scanner (GE Healthcare Discovery MR750, Waukesha, WI). Imaging parameters were as follows: FOV=300x300mm2, resolution=1x1mm2, slice thickness=4.0mm, flip angle=8/4o, number of slices=34, partial Fourier readout fraction=70%, TR/TE1/TE2=4.4/1.3/2.4ms, Bandwidth=±167kHz. 24 radial stacks were acquired after each inversion pulse. Dead time was set to 500ms in all imaging experiments, leading to total acquisition time of 2.5 minutes. Inversion recovery spin echo (IR-SE) was used as the reference T1 mapping method.Knee Imaging: Single-echo radial stack-of-stars images were acquired in one volunteer (male, age = 33) on a 3T MR scanner (GE Healthcare Discovery MR750, Waukesha, WI), using an 18-channel knee coil. Imaging parameters are as follows: FOV=210x210mm2, in-plane resolution=0.6x0.6mm2, slice thickness=4.0mm, flip angle=8/4o, number of slices=58, partial Fourier readout fraction=70%, TR/TE1=5/2.2ms, Bandwidth=±167kHz. 16 radial stacks were acquired after each inversion pulse, leading to total acquisition time of 3.5 minutes.
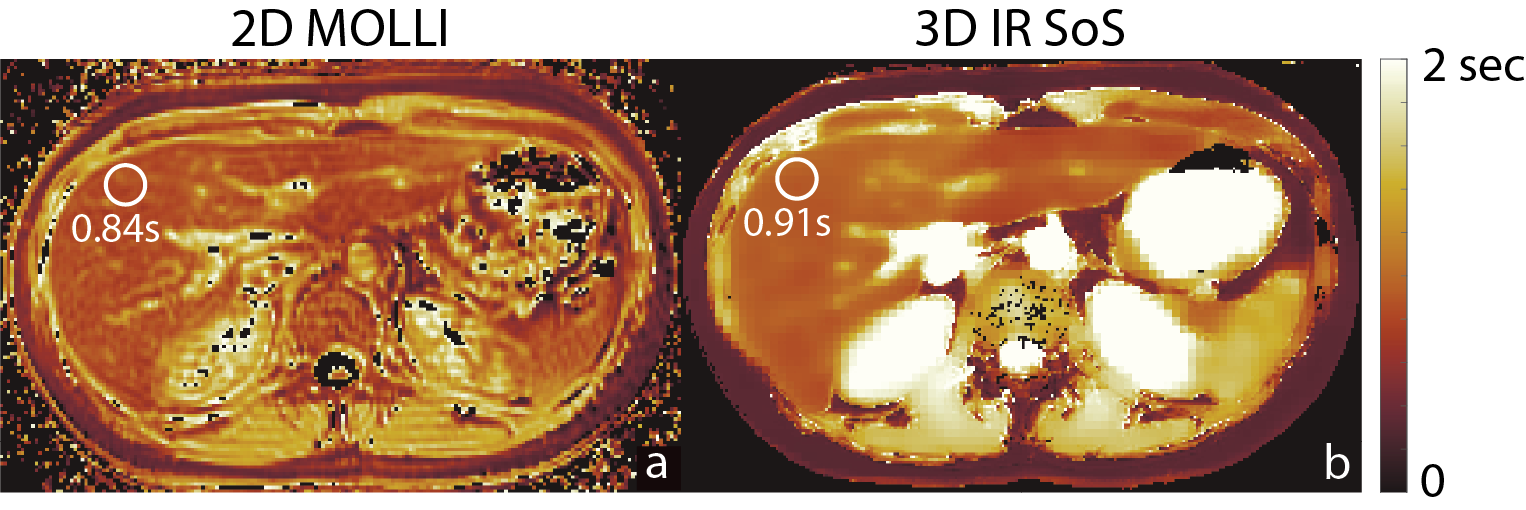
Liver Imaging: Dual-echo radial stack-of-stars images were acquired on a 3T MR scanner, using a 32-channel torso coil. Imaging parameters are as follows: FOV=540x540mm2, resolution=1.1x1.1mm2, slice thickness=3.0mm, flip angle=8/4o, number of slices=58, partial Fourier readout fraction=70%, TR/TE1/TE2=5/1.4/2.7ms, Bandwidth=±167kHz. 12 radial stacks were acquired after each inversion pulse, leading to total acquisition time of 8.5 minutes. T1 maps generated with 2D MOLLI acquisition were used as reference for liver and knee scans.
Image Reconstruction: Locally low rank (LLR) reconstruction was applied to basis coefficients of separate echo images (13). Low rank constraint in time dimension was applied through temporal basis transformation, where basis functions for T1 relaxation are calculated using Bloch equation simulations, covering a wide range of T1 (200-3000ms) values, B1 inhomogeneities (0.5-1.5) and inversion efficiencies (0.5-1). T1 mapping was achieved by nonlinear fitting on the analytical signal equation.
Results
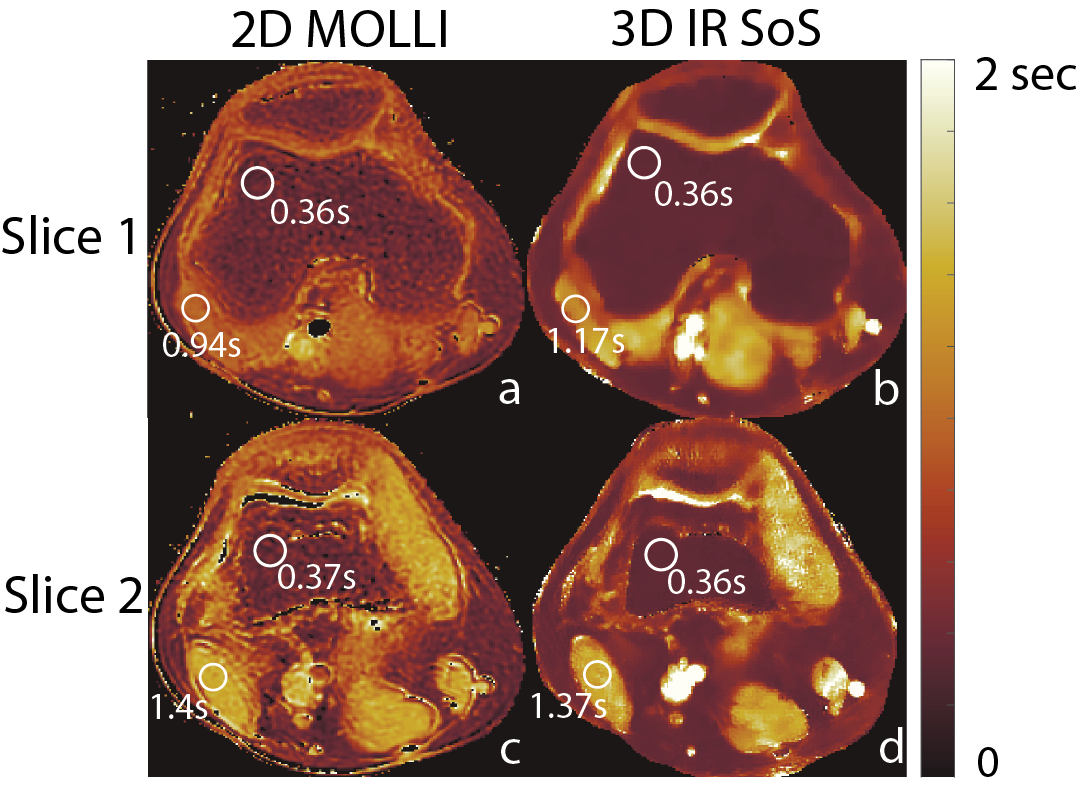
Validation of the proposed method is shown in Figure 3 with the phantom study, where, estimated T1w and T1f values show linear agreement with IR-SE acquisitions. Figure 4 and 5 show the T1 maps, of knee and liver respectively, reconstructed with the proposed method and MOLLI. ROI measurements show that proposed method is in good agreement with the reference acquisition in the knee and liver parenchyma.Discussion
In this work, we presented an image acquisition and reconstruction scheme for free-breathing, 3D T1 mapping in the liver. Proposed method corrects for B1-related errors, in both excitation and inversion pulses and partial volume effects by combining IR with CSE-MRI. We observed biased T1 estimations in longer-T1 species due to lack of optimization of acquisition parameters. Future work will focus on improvement and optimization of acquisition/reconstruction strategy.Acknowledgements
We wish to acknowledge investigator-initiated research support from Bayer, UW Institute for Clinical and Translational Research, and the Clinical and Translational Science Award of the NCATS/NIH (UL1TR002373). Further, we wish to acknowledge GE Healthcare who provides research support to the University of Wisconsin. Finally, Dr. Reeder is a Romnes Faculty Fellow, and has received an award provided by the University of Wisconsin-Madison Office of the Vice Chancellor for Research and Graduate Education with funding from the Wisconsin Alumni Research Foundation.References
1. Banerjee R et al. Multiparametric magnetic resonance for the non-invasive diagnosis of liver disease. J Hepatol, 60(1):69 – 77, 2014.
2. Haimerl M et al. Assessment of clinical signs of liver cirrhosis using t1 mapping on gd-eob-dtpa-enhanced 3t mri. PLOS ONE, 8(12):1–8, 12 2014.
3. Hoad CL et al. A study of t1 relaxation time as a measure of liver fibrosis and the influence of confounding histological factors. NMR Biomed, 28(6):706–714, 2015.
4. Kim JE et al. T1 mapping for liver function evaluation in gadoxetic acid–enhanced mr imaging: comparison of look-locker inversion recovery and b1 inhomogeneity-corrected variable flip angle method. European Radiology, 29(7):3584–3594, Jul 2019.
5. Tamada D et al. Multiparameter estimation using multi-echo spoiled gradient echo with variable flip angles and multicontrast compressed sensing.Magn Reson Med, 80(4):1546–1555, 2018.
6. Wang, X, Colgan, TJ, Hinshaw, LA, et al. T1‐corrected quantitative chemical shift‐encoded MRI. Magn Reson Med. 2020; 83: 2051– 2063.
7. Hai-Ling Margaret Cheng and Graham A Wright. Rapid high-resolution t1 mapping by variable flip angles: Accurate and precise measurements in thepresence of radiofrequency field inhomogeneity. Magn Reson Med, 55(3):566–574, 2006.
8. Messroghli, D.R., Radjenovic, A., Kozerke, S., Higgins, D.M., Sivananthan, M.U. and Ridgway, J.P. (2004), Modified Look‐Locker inversion recovery (MOLLI) for high‐resolution T1 mapping of the heart. Magn. Reson. Med., 52: 141-146.
9. Mozes, F.E., Tunnicliffe, E.M., Pavlides, M. and Robson, M.D. (2016), Influence of fat on liver T1measurements using modified Look–Locker inversion recovery (MOLLI) methods at 3T. J. Magn. Reson. Imaging, 44: 105-111.
10. Kecskemeti S et al. Mpnrage: A technique to simultaneously acquire hundreds of differently contrasted mprage images with applications to quantitative t1 mapping. Magn Reson Med, 75(3):1040–1053, 2016.
11. Muslu Y, Kecskemeti S, Hernando D, Reeder SB. Free-Breathing, Confounder-Corrected T Mapping in the Liver with 3D Radial Inversion Recovery MRI. ISMRM; 2020 8 August 2020.
12. Kecskemeti S, Alexander AL. Three‐dimensional motion‐corrected T1 relaxometry with MPnRAGE. Magn Reson Med. 2020; 84: 2400– 2411
13. Tamir, J.I., Uecker, M., Chen, W., Lai, P., Alley, M.T., Vasanawala, S.S. and Lustig, M. (2017), T2 shuffling: Sharp, multicontrast, volumetric fast spin‐echo imaging. Magn. Reson. Med., 77: 180-195.
Figures