0610
Rapid high resolution simultaneous mapping of composite T1, water-only T1 and PDFF in the abdomen with dual-echo IR-radSPGR pulse sequence1Department of Radiology, Stanford University, Palo Alto, CA, United States, 2Electrical Engineering, Stanford University, Palo Alto, CA, United States
Synopsis
A radial IR-SPGR pulse sequence with bipolar readouts is demonstrated along with a model-based iterative reconstruction to simultaneously map high resolution composite and water-only T1 and proton density fat fraction (PDFF) in the abdomen. The proposed pulse sequence and reconstruction algorithm can yield high-quality T1 and PDFF maps in 2.5 seconds/slice. The resulting maps have an in-plane resolution of 1.25mm and through-plane resolution of 5.00mm. When combined with selective inversion pulse, the technique achieves multi-slice imaging for breath-hold studies.
Introduction
Spin-lattice relaxation time (T1) has been shown to be a valuable biomarker in abdominal MR studies, for differentiation of cirrhotic liver tissues[1]; identification of tumor malignancy[2]. PDFF is also been proven to be a reproducible and widely available biomarkers for fatty liver diseases[3] and for quantifying the liver lip content[4,5,6]. It has been shown in clinical studies that non-alcoholic fatty liver disease (NAFLD) is one of the main causes of cirrhosis[7], and it has been linked with higher rate of malignancy[8].The T1 of liver may be heavily influenced by the fat component of the tissue, potentially confounding the assessment of fibrosis. Previous studies treated the fat/water separated T1 mapping problem as a multi-compartment non-linear fitting problem, which requires the assumption of a constant fat T1 and a fat signal fraction map as input; performance suffered in areas with low fat or water concentrations[9].
Here we present a radial inversion-recovery (IR) Spoiled Gradient-Echo (SPGR) technique with bipolar readouts together with a fat/water separated model-based iterative reconstruction algorithm for both composite and water-only T1 as well as PDFF mapping. This proposed method can directly reconstruct fat/water separated T1 maps and does not require the assumption of fat T1 nor does it need a fat-signal-fractions input. This method can generate composite, water-only T1 and PDFF map of the abdomen in 2.5 seconds/slice applicable for breath-hold studies.
Technique and methods
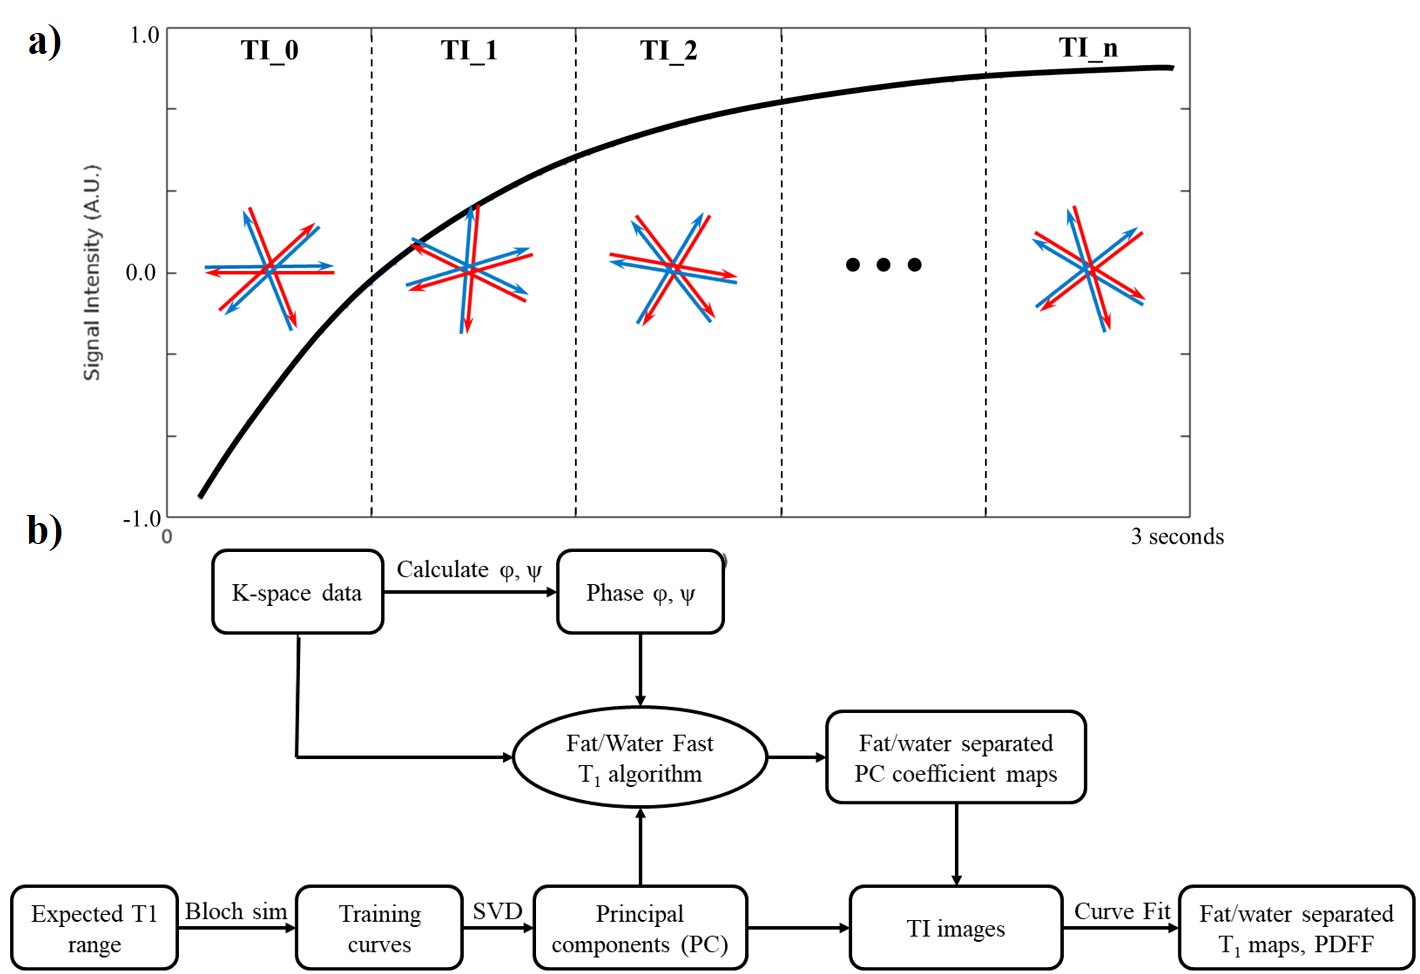
In data acquisition, single-shot bipolar radial data is acquired following a 180° adiabatic slice-selective inversion pulse, with a fixed flip angle of 10°. Tiny golden angle[10] view-ordering is used to avoid excessive eddy current artifacts. The acquired data is then partitioned into multiple so-called TI-groups (N=16 views/group, ~4% Nyquist). The TI for each TI-group is approximated by the average TI of the radial projections in the group (Figure 1a).The proposed dual-echo IR-radSPGR sequence was implemented on 3T scanners (GE MR750) using an EPIC wrapper from Karolinska Foundation[11]. For breath-hold studies, the following parameters were used: TE1=1.88ms, TE2=3.35ms, TR=4.87ms, TI=35ms, base resolution=256, FOV=320mm, radial views=512, bandwidth=976.6Hz/pixel.
A fat/water separated model-based reconstruction (Figure 1b) is used to recover multi-parameter maps. Singular value decomposition (SVD) is done on a set of training curves generated using Bloch simulations with expected T1 ranges in the tissues and resulting principal components (PC) are used in the model-based reconstruction. A naïve non-uniform FFT[12] reconstruction is first done to recover the phase information necessary for fat/water separation[13]. The k-space data is then partitioned and passed to the model-based reconstruction[14] which solves the reconstruction problem in Eq.1. Once the fat and water separated PC coefficients are reconstructed, the aforementioned PCs are used to recover the fat, water and composite TI images. Eq.2 is then used to map for the respective T1 values and the proton density maps. A PDFF map can also be calculated using the proton density maps.
$$<\hat{\textbf{M}_{\textbf{w}}},\hat{\textbf{M}_{\textbf{f}}}>=\operatorname*{arg\,max}_{\textbf{M}_{\textbf{w}},\textbf{M}_{\textbf{f}}}\sum_{j=1}^{\#Coils}\sum_{i=1}^{L}||FT_{i}\{\textbf{S}_{j}A(\textbf{M}_{\textbf{w}}\vec{\textbf{P}}_{i}^{T},\textbf{M}_{\textbf{f}}\vec{\textbf{P}}_{i}^{T})\}-\textbf{K}_{i,j}||_{2}^{2}+\sum_{k=1}^{L}\lambda_{k}TV_{k}(\textbf{M}_{\textbf{w}},\textbf{M}_{\textbf{f}})...[Eq.1]$$
A NIST phantom[15] and a Calimetrix PDFF phantom[16] was used to verify the accuracy of the proposed technique, IS-Spin Echo (IR-SE) and IDEAL sequence was used as references. Under IRB approval with informed consent seven patients with hepatic steatosis were imaged.
$$S(t)=A-Be^{-\frac{TI}{T_{1}^{*}}},A=\frac{I_{0}T_{1}^{*}}{T_{1}},B=I_{0}(1+\frac{T_{1}^{*}}{T_{1}})...[Eq.2]$$
The proposed reconstruction algorithms were implemented on dual NVIDIA GTX-1080 GPUs using C++ with OpenCL, and Python.
Results and discussion
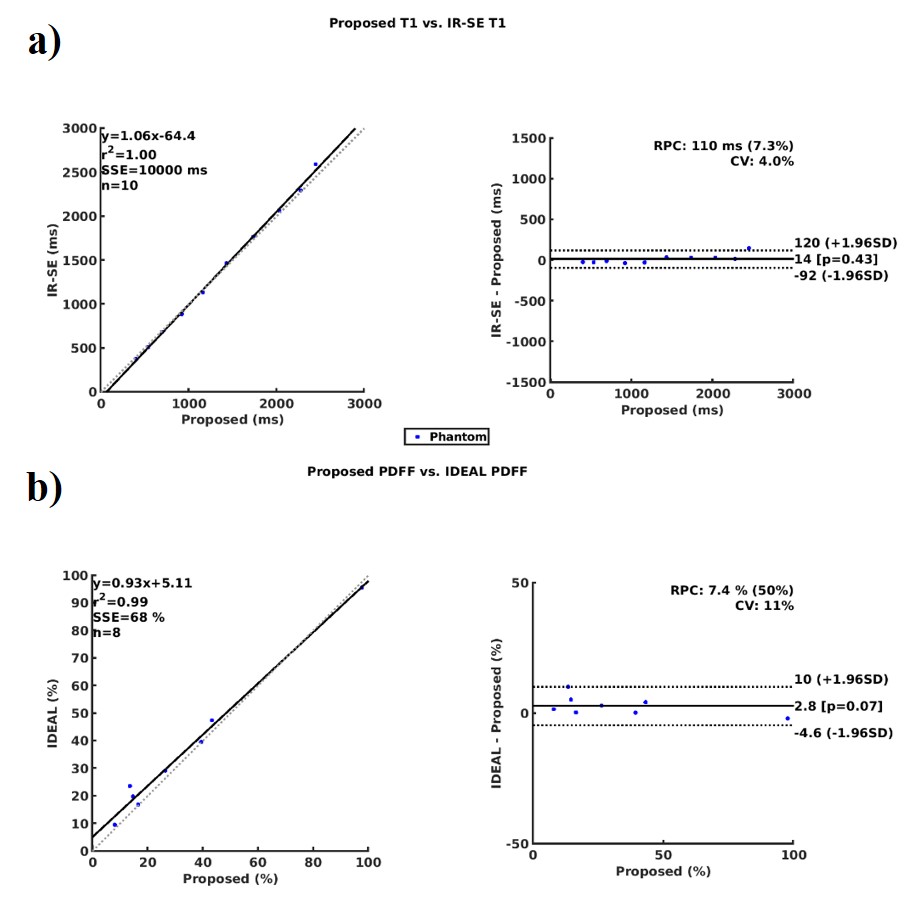
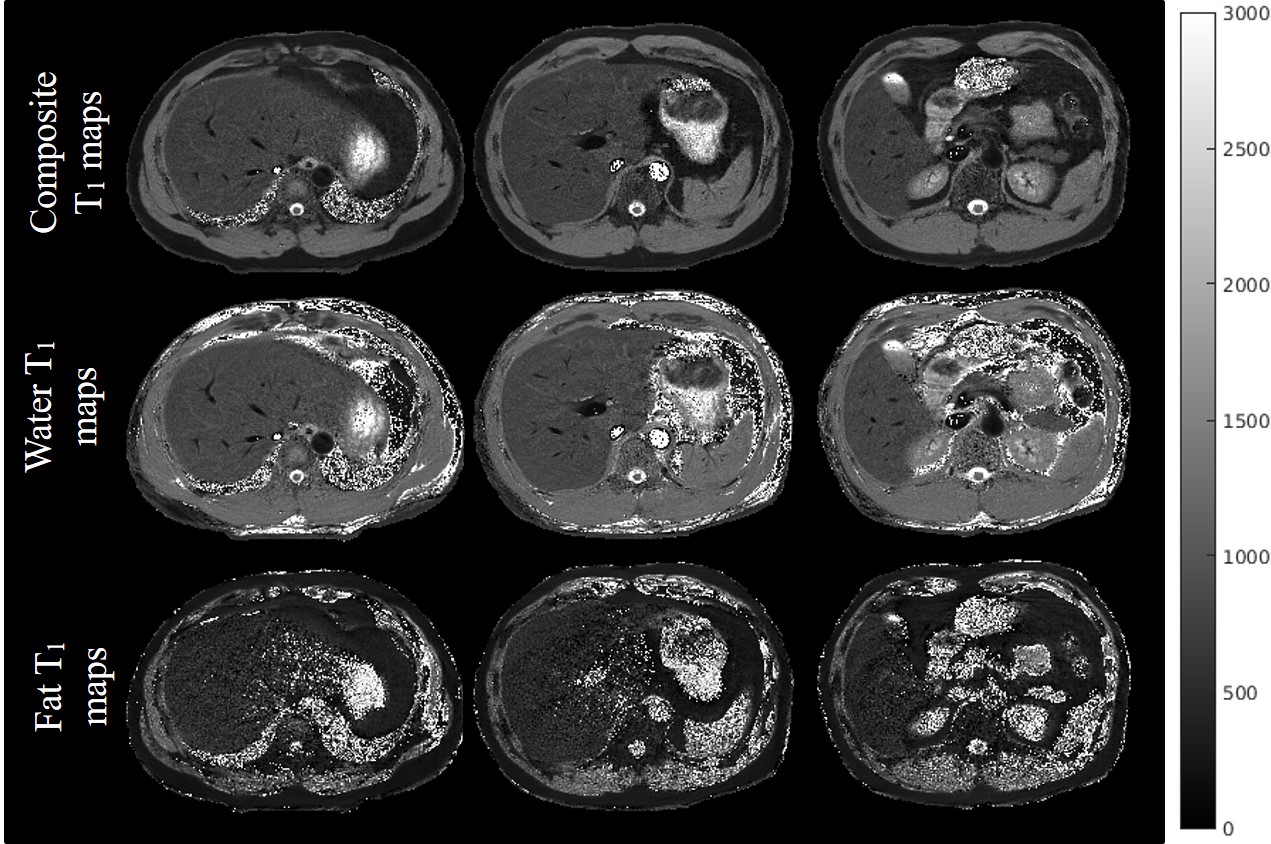
Figure 2 shows the Bland-Altman plots for the phantom studies. a) shows the comparison of IR-SE and the proposed water-only T1 values on the NIST phantom. b) shows the PDFF comparison between the proposed technique and IDEAL. From the plots it can be seen that the proposed method matches the reference well.In Figure 3, three slices of the T1 maps from a breath-hold study using the proposed technique is presented. Note the sharp details in the T1 maps are preserved. Because of the subject’s higher liver fat fraction, the fat only T1 maps also show reasonable values.
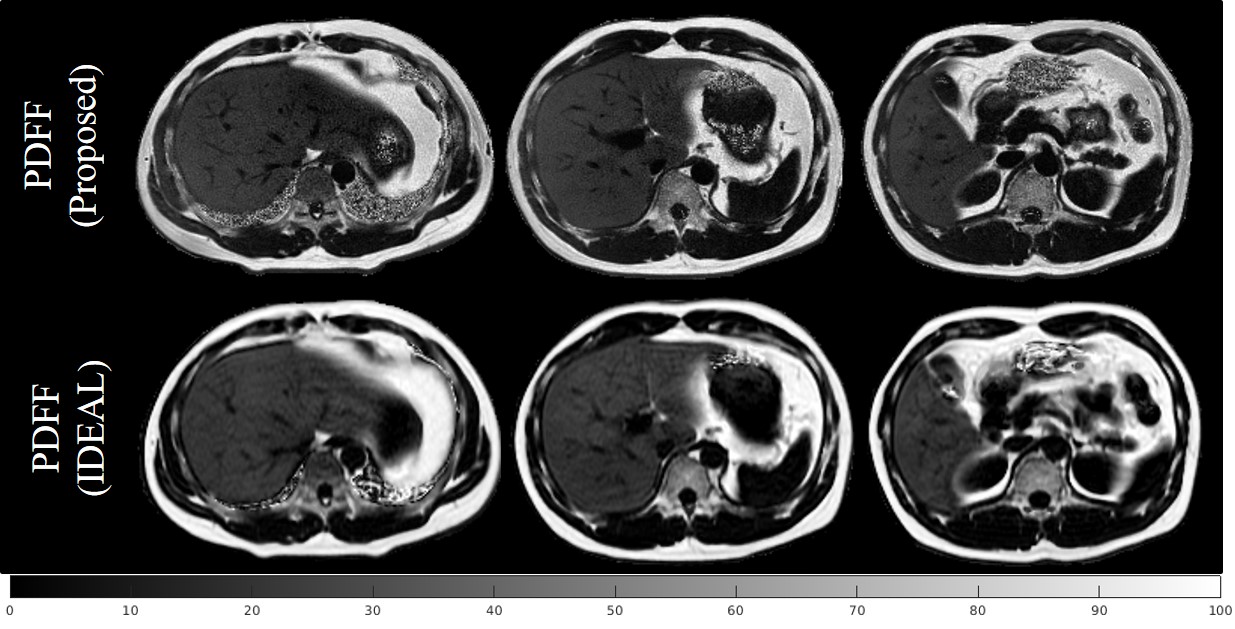
In Figure 4, three slices of PDFF maps generated by the proposed technique from the same subject are presented in the first row. Three slices from IDEAL pulse sequence at similar anatomical locations are presented in the second row. Note the sharp details presented in the proposed technique’s PDFF maps. This higher spatial resolution not only preserved the liver’s vascular structures in both the T1 maps and the PDFF maps, it also allowed the kidney’s cortex and medulla to be delineated. In comparison to the IDEAL, there are fewer undersampling artifacts from the proposed method’s PDFF maps. The breath-hold nature of the study and the radial trajectory used also eliminated most of the motion artifacts in the proposed method’s PDFF maps.
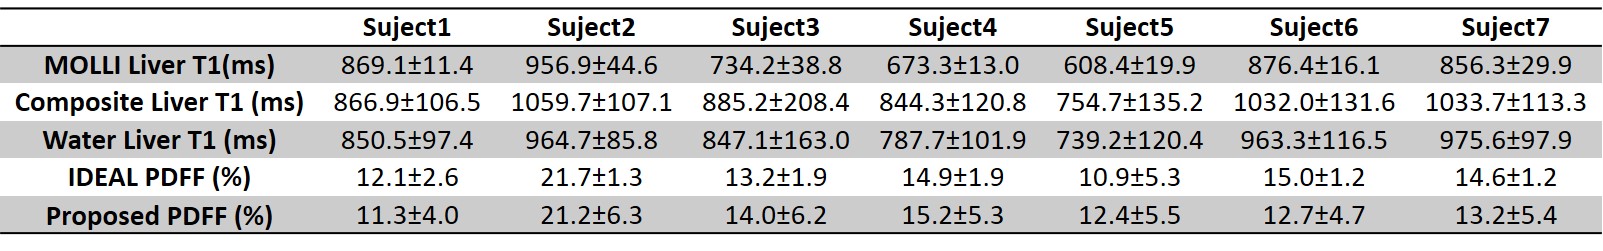
In Table 1, the results of the ROI analysis for the hepatic steatosis patients are presented. Both the values from the proposed technique and the references are shown.
Conclusion
A fast multi-slice dual-echo IR-radSPGR with bipolar readouts pulse sequence and an accompanying fat/water separated model-based reconstruction algorithm are proposed for high-resolution abdominal fat/water separated T1 and PDFF mapping. High-resolution composite T1, water component T1 and PDFF maps can be acquired in 2.5seconds/slice. The proposed method is efficient in data acquisition and can provide high-quality estimations of multiple parameters. Future work will assess the differences between composite T1 and water-only T1 in hepatic fibrosis.Acknowledgements
The authors would like to thank NIH R01 EB009690, NIH R01 EB026136, and GE HealthcareReferences
1 Kim KA, Park MS, Kim IS, Kiefer B, Chung WS, Kim MJ, Kim KW. Quantitative evaluation of liver cirrhosis using T1 relaxation time with 3 tesla MRI before and after oxygen inhalation. J Magn Reson Imaging. 2012;36:405-410.
2 Goldberg MA, Hahn PF, Cohen MS, Reimer P, Brady TJ, Mueller PR. Value of T1 and T2 relaxation times from echoplanar MR imaging in the characterization of focal hepatic lesions. AJR Am J Roentgenol. 1993;160:1011-1017.
3 Reeder SB, Mckenzie CA, Pineda AR, Yu H, Shimakawa Ann, Brau AC, Hargreaves BA, Gold GE, Brittain JH. Water-fat separation with IDEAL gradient-echo imaging. J Magn Reson Imaging. 2007;25:644-652.
4 Reeder SB, Sirlin CB. Quantification of liver fat with magnetic resonance imaging. Magn Reson Imaging Clin N Am. 2010;18:337-357.
5 Meisamy S, Hines CDG, Hamilton G, Sirlin CB, McKenzie CA, Yu H, Brittain JH, Reeder SB. Quantification of Hepatic Steatosis with T1-independent, T2*-corrected MR Imaging with Spectral Modeling of Fat: Blinded Comparison with MR Spectroscopy. Radiology. 2011;258:767-775.
6 Idilman LS, Aniktar H, Idilman R, Kabacam G, Savas B, Elhan A, Celik, A, Bahar K, Karcaaltincaba M. Hepatic Steatosis: quantification by proton density fat fraction with MR imaging versus liver biopsy. Radiology. 2013;267:767-775.
7 Dowman JK, tomlinson JW, Newsome PN. Systematic review: The diagnosis and staging of non-alcoholic fatty liver disease and non-alcoholic steatohepatitis.. Aliment Pharmacol Ther.. 2011;33:525-540.
8 Adams LA Lymp JF, St Sauver J, Sanderson SO, Lindor KD Feldstein A, Angulo P. The natural history of nonalcoholic fatty liver disease: a population-based cohort study. Gastroenterology. 2005;129:13-121.
9 Li Z, Pauly J, Vasanawala S. Rapid multi-slice fat and water separated T1 and composite R2* mapping using a dual-echo radial inversion recovery SPGR pulse sequence. In: ISMRM; 2020; Online. Available from: https://www.ismrm.org/20m/.
10 Wundrak S, Paul J, Ulrici J, Hell E, Geibel MA, Bernhardt P, Rottbauer W and Rasche V. Golden ratio sparse MRI using tiny golden angles. Magn Reson Med. 2016;75:2372-2378.
11 KS Foundation. [Internet]. Available from: https://ksfoundationepic.org/.
12 Fessler JA, Sutton BP. Nonuniform fast Fourier transforms using min-max interpolation. IEEE Transactions on Signal Processing. 2003;51(2):560-574.
13 Berglund J, Ahlström H, Johansson L, Kullberg Joel. Two-point Dixon method with flexible echo times. Magn Reson Med. 2011;65:994-1004.
14 Li Z, Bilgin A, Johnson K, Galons JP, Vedantham S, Martin DR, Altbach MI. Rapid high-resolution T1 mapping using a highly accelerated radial steady-state free-precession technique. J Magn Reson Imaging. 2018;49:239-252.
15 Russek SE, Boss M, Jackson EF, Jennings DL, Evelhoch JL, Gunter JL, Sorensen AG. Characterization of NIST/ISMRM MRI System Phantom. In: ISMRM; 2012; Melbourne Australia.
16 Hu HH, Yokoo T, Hernando D, Bashir MR, MIddleton MS, Serai SD, Malyarenko D, Chenevert T, Smith M, Henderson W, Hamilton G, Shu Y, Sirlin CB, Tkach JA, Trout AT, Brittain JH, Reeder SB, RSNA QIBA PDFF Committee. Multi-site, multi-vendor, and multi-platform reproducibility and accuracy of quantitative proton-density fat fraction (PDFF) at 1.5 and 3 Tesla with a standardized spherical phantom: preliminary results from a study by the RSNA QIBA PDFF Committee. In: ISMRM; 2019; Montreal, QC, Canada. Available from: https://www.ismrm.org/19m/.
17 Mozes FE, Tunnicliffe EM, Pavlides M, Robson MD. Influence of fat on liver T1 measurements using modified Look-Locker inversion recovery (MOLLI) methods at 3T. J Magn Resoon Imaging. 2016;44:105-111.
18 Larmour S, Chow K, Kellman P, Thompson RB. Characterization of T1 bias in skeletal muscle from fat in MOLLI and SASHA pulse sequences: quantitative fat-fraction imaging with T1 mapping. Magn Reson Med. 2017;77:237-249.
Figures