0609
Six-Dimensional, Free-Breathing Multitasking Multi-Echo (MT-ME) MRI for Whole-Liver T1, PDFF, and R2* Quantification1Biomedical Imaging Research Institute, Cedars-Sinai Medical Center, Los Angeles, CA, United States, 2Bioengineering, University of California, Los Angeles, Los Angeles, CA, United States, 3Siemens Medical Solutions USA, Inc., Los Angeles, CA, United States, 4Department of Medicine, Cedars-Sinai Medical Center, Los Angeles, CA, United States
Synopsis
Chronic liver disease has been a leading cause of mortality worldwide. Multiparametric MRI is a promising tool for non-invasive characterization of liver disease, but has yet to be widely used in clinical practice due to demanding technical challenges. In this work, we proposed a 6D Multitasking multi-echo (MT-ME) technique that allows free-breathing acquisition, whole-liver coverage, and simultaneous T1, PDFF, R2*, and water-specific T1 (T1w) quantification. Phantom study and in vivo studies with 14 volunteers and 1 patient with NAFLD were performed. The quantitative parameters measured from MT-ME were repeatable and showed good agreement with the reference methods.
Introduction
Chronic liver disease is a leading cause of mortality worldwide1. Liver biopsy is the gold standard for diagnosis and staging. However, it is invasive, costly, prone to sampling error, and has a relatively high risk of complications2,3. Recent studies have shown that quantitative markers from multiparametric MRI can serve as a non-invasive approach for liver tissue characterization4. Proton-density fat-fraction (PDFF) and R2* derived from multi-echo GRE can noninvasively quantify fat content and iron overload5-7. Native T1 has been correlated to fibrosis severity with histological validation8-10. Despite the encouraging findings, a standard protocol for clinical use has yet to be established due to practical challenges: 1) compromises among scan time, spatial coverage, and spatial resolution; 2) extra burden on patients due to breath-hold requirements; 3) mis-registration between breath-holds due to separate scans for R2*+FF and T1; 4) confounding factors from fat that may affect the water-specific T1 quantification8. To address the abovementioned limitations, we developed a 6D Multitasking multi-echo (MT-ME) technique that allows free-breathing acquisition, whole-liver coverage, and simultaneous T1, PDFF, R2*, and water-specific T1 (T1w) quantification and performed preliminary studies on volunteers and patients.Methods
Image acquisition: A custom prototype sequence using a continuous scan with 3D 6-echo bipolar FLASH readouts following periodic non-selective IR preparation was developed to generated T1, water/fat, and R2* contrasts. A stack-of stars sampling pattern with golden-angle rotation in kx-ky plane and Gaussian-density randomized Cartesian reordering in kz dimension incoherently sampled the k-space. A center k-space line in kz dimension was acquired every 8 readouts as training data11.Image reconstruction: The 6D MT-ME images were represented as a 4-way tensor $$$\mathcal{A}$$$ with voxel location index, IR, multi-echo, and respiratory dimensions. The high correlation along and across multiple image dimensions induces that $$$\mathcal{A}$$$ can be decomposed into the product of different basis matrices representing each dimension12:$$\mathcal{A}=\mathcal{G} \times_{1} \mathbf{U} \times_{2} \mathbf{V} \times_{3} \mathbf{W} \times_{4} \mathbf{Q}$$Where the columns of $$$\mathbf{U}$$$, $$$\mathbf{V}$$$, $$$\mathbf{W}$$$, and $$$\mathbf{Q}$$$ contain the basis functions for spatial, IR, multi-echo, and respiratory dimensions, respectively, and $$$\mathcal{G}$$$ is the core tensor. The reconstruction of the final 6D images can be framed as the recovery of each basis matrix, which are much smaller in size.
Joint T1, PDFF, and R2* quantification: “Joint T1” combining water and fat components was mapped based on the first-echo images at all TIs using the equation in our previous work13. Independently, R2* and PDFF were fitted together using the multi-echo images at the last TI. An in-house algorithm based on variable projection (VARPRO)14 was developed to jointly estimate the proton density for water and fat, field inhomogeneity-related frequency offset, and R2*.
Water-specific T1: To obtain a water-only T1 map, we performed water-fat separation on the low-rank tensor model parameters15. Specifically, we generated a partially-recomposed tensor $$$\mathcal{Y}$$$:$$\mathcal{Y}=\mathcal{G} \times_{1} \mathbf{U} \times_{3} \mathbf{W} \times_{4} \mathbf{Q}=\mathcal{A} \times_{2} \mathbf{V}^{+}$$which multiplies out all model factors except the IR basis $$$ \mathbf{V}$$$, thereby keeping T1 information embedded. The water-fat separation was then performed on $$$\mathcal{Y}$$$ using the abovementioned in-house algorithm, yielding respiratory-motion-resolved water and fat component $$$\mathcal{W}$$$ and $$$\mathcal{F}$$$, respectively. Then $$$\mathcal{A}_{\mathrm{w}}$$$, the water images with multiple TIs, were generated as:$$\mathcal{A}_{\mathrm{w}}=\mathcal{W}\times_{2} \mathbf{V}$$
Subsequently, the T1 mapping was performed on $$$\mathcal{A}_{\mathrm{w}}$$$, producing the water-specific T1, denoted as T1w.
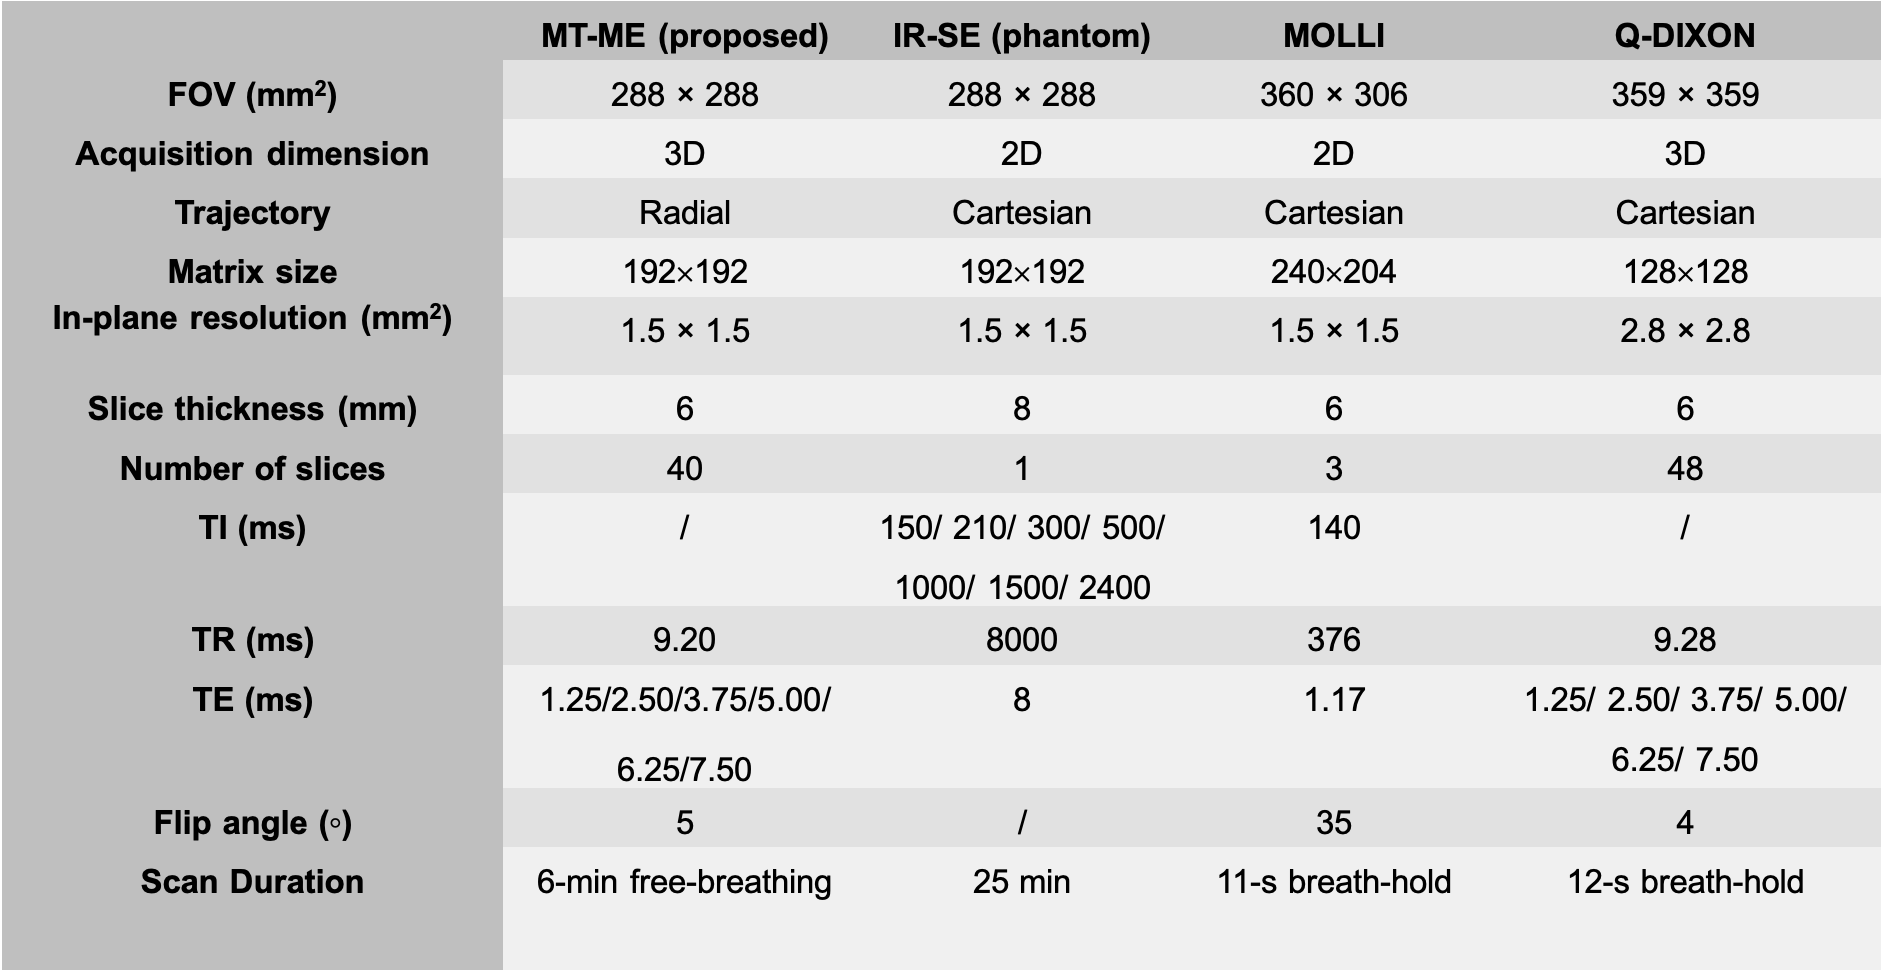
Imaging experiments: All studies were performed on a 3T scanner (MAGNETOM Vida, Siemens Healthcare, Germany) in transversal orientation. In phantom and volunteer (n = 14) studies, MT-ME was performed twice in each imaging session to assess its repeatability; IR-SE sequences without and with water excitation were acquired as T1 reference in phantom; MOLLI16 and q-DIXON7 with breath-hold was used in all in vivo studies as references for T1 and PDFF + R2*, respectively. One patient with nonalcoholic fatty liver disease (NAFLD) was recruited, and MT-ME, MOLLI, and q-DIXON were successfully performed. Table 1 lists the detailed protocols.
Statistical analysis: The repeatability of the parameters estimated using MT-ME was evaluated with Bland-Altman plots and intraclass correlation coefficient (ICC). The Pearson correlation coefficient R was assessed between the parameters quantified from MT-ME and references.
Results
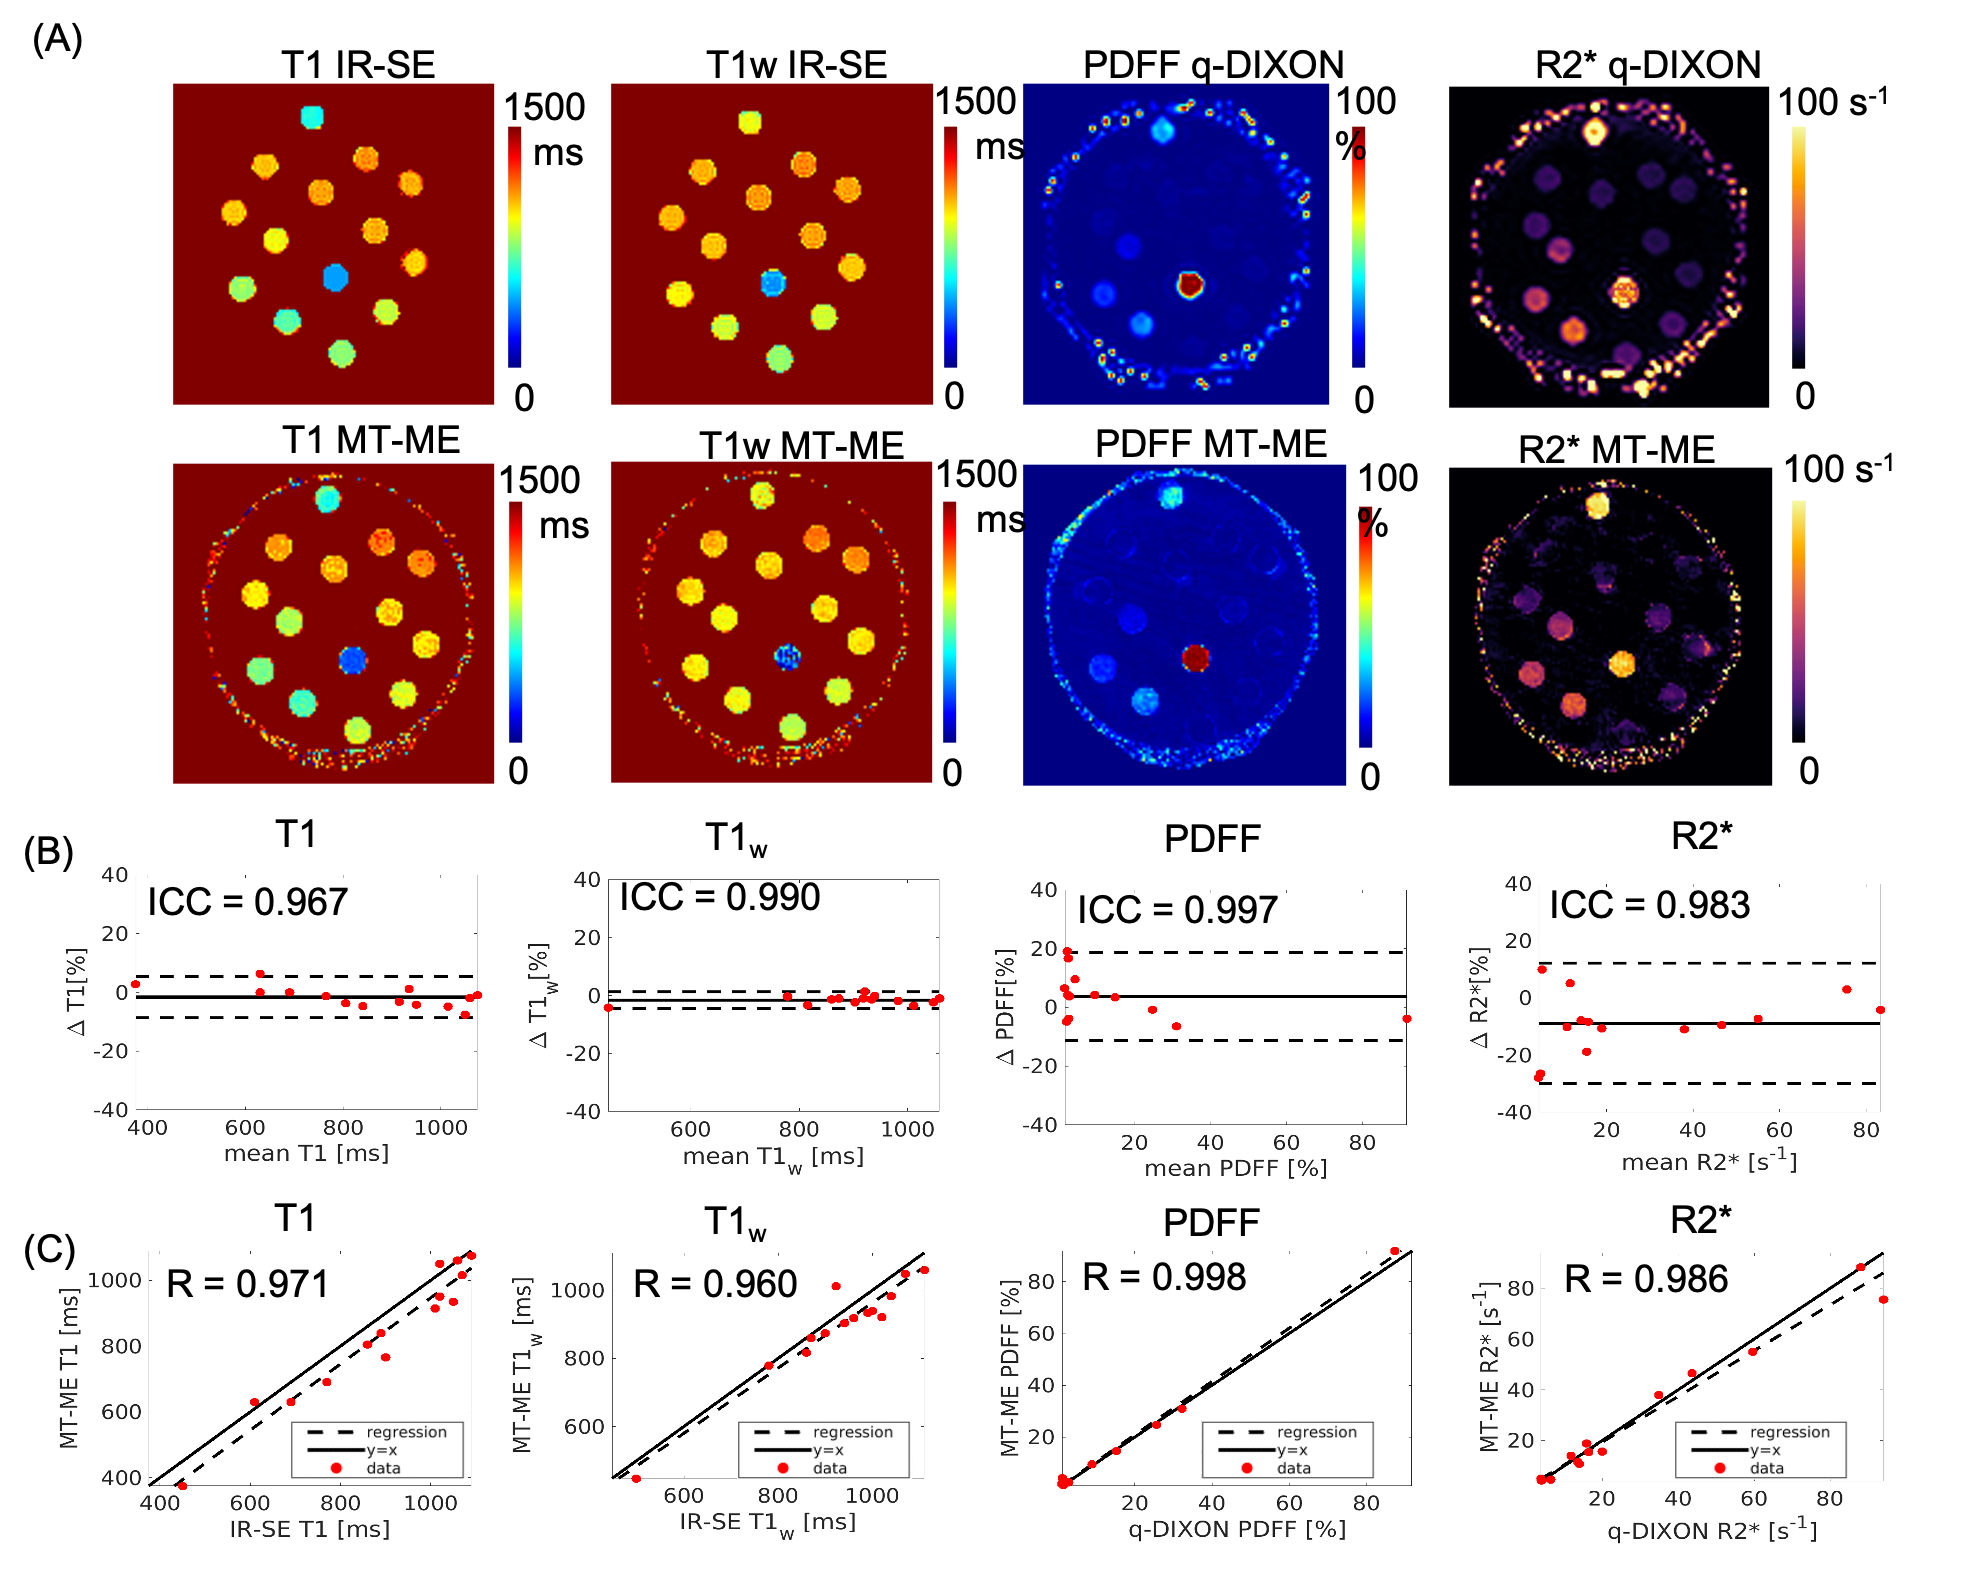
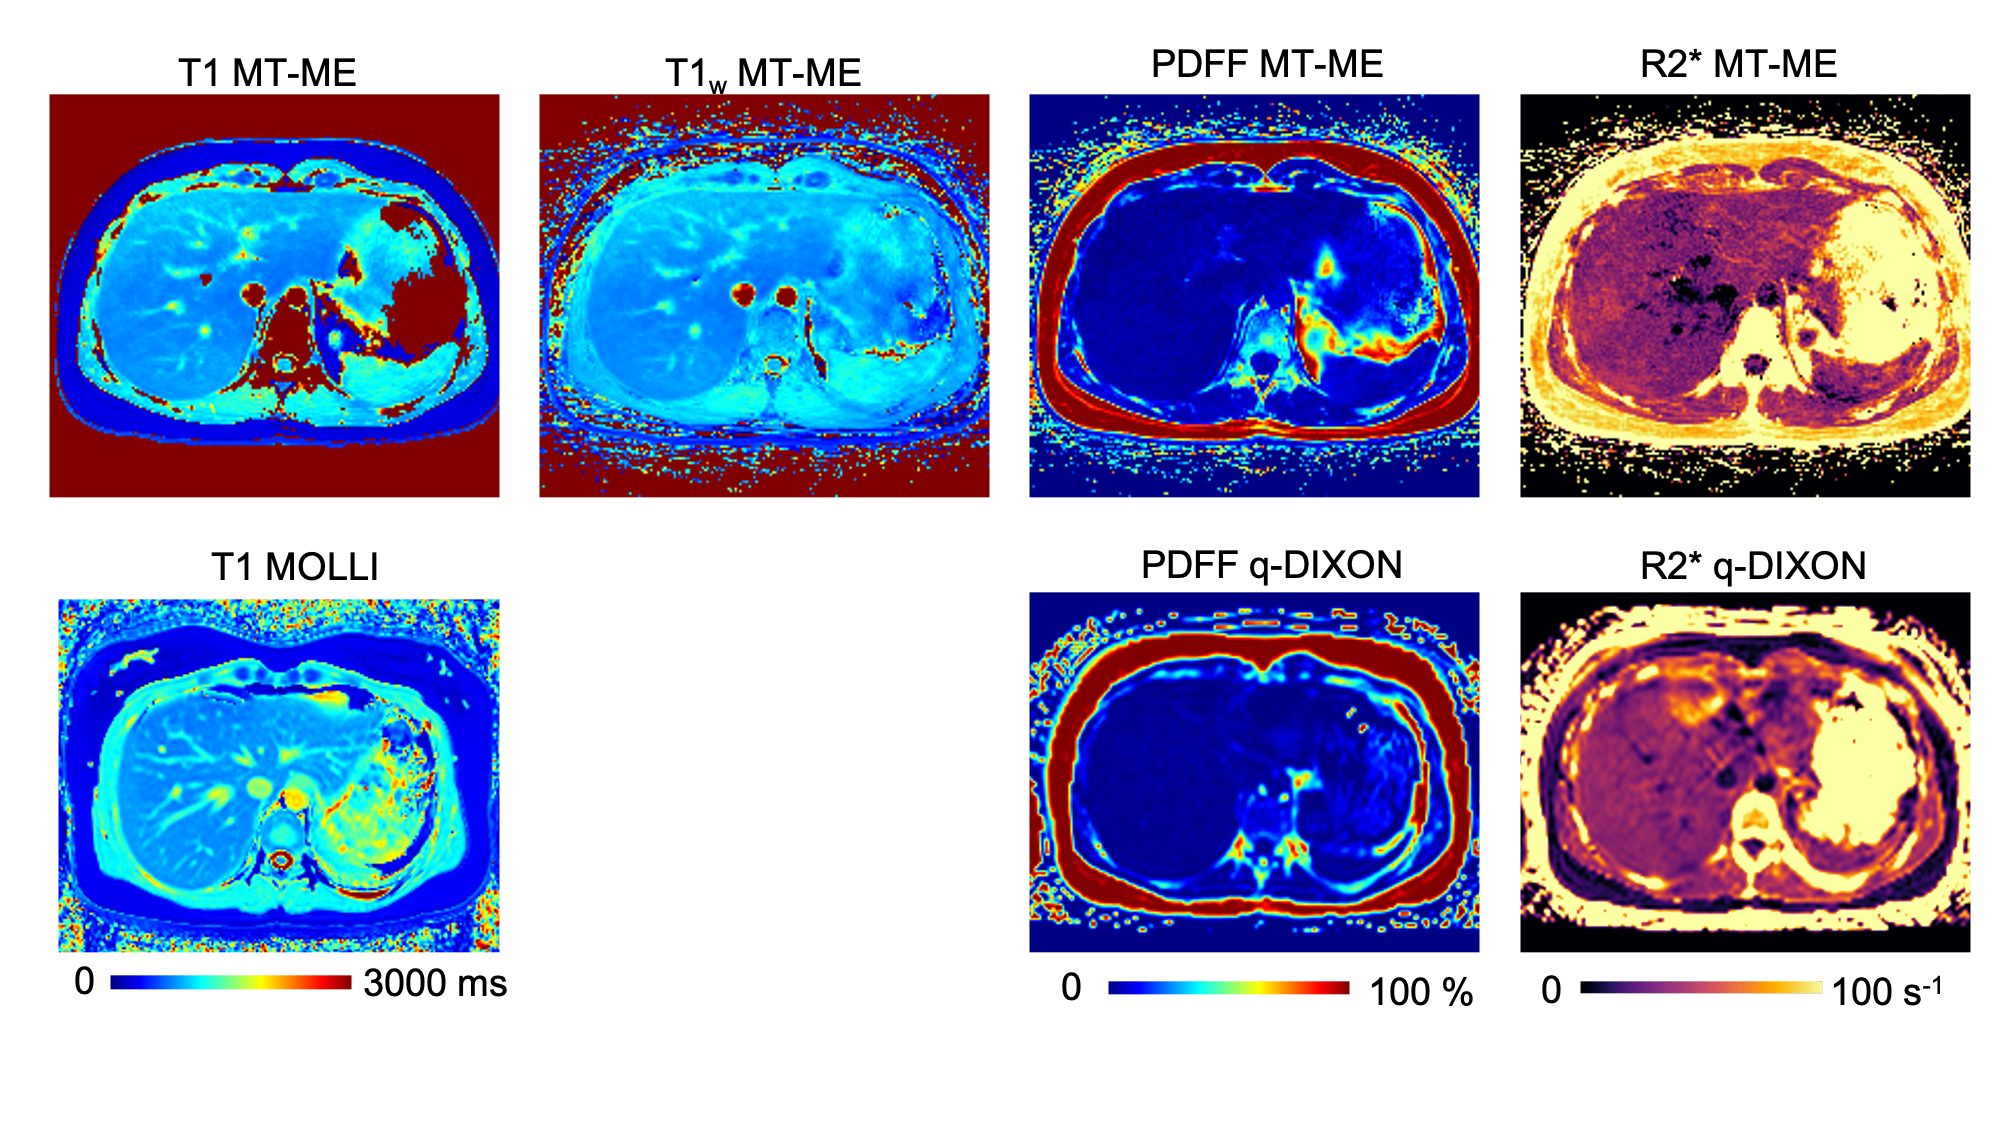
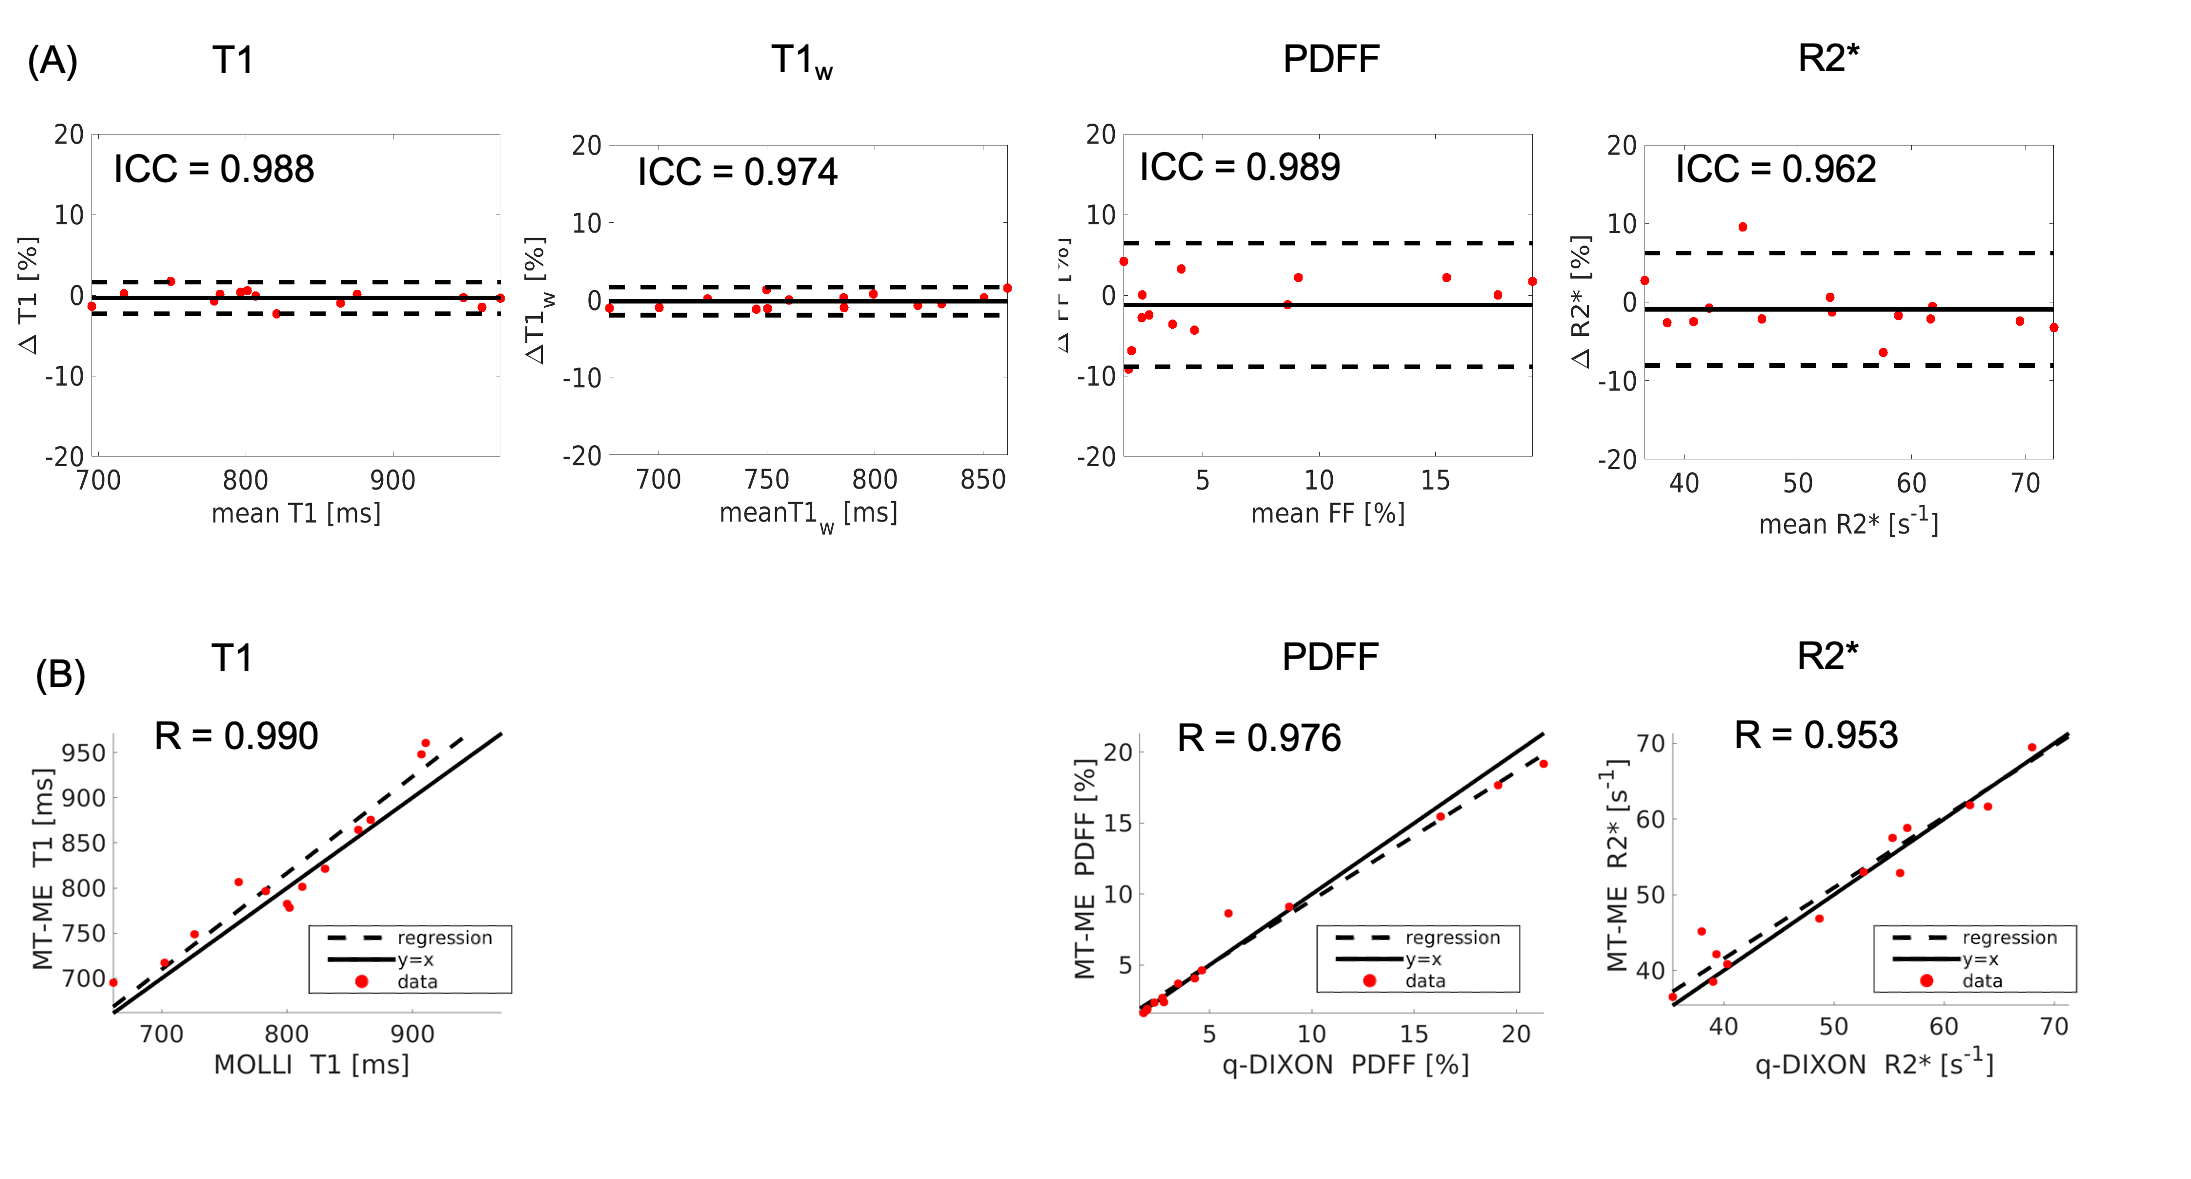
High-quality, co-registered multiparametric maps were generated using MT-ME for all cases. Figure 1 displays the T1, T1w, PDFF, and R2* estimation on the phantom. The ICCs of the four parameters between two repeat MT-ME scans were 0.967, 0.990, 0.997, and 0.983, respectively. The Pearson correlation coefficients (Rs) between MT-ME estimation and references were 0.971, 0.960, 0.998, and 0.986, respectively.Figure 2 illustrates example T1, T1w, PDFF, and R2* maps of a volunteer. The maps from MT-ME and references were in good agreement. Figure 3(A) displays the Bland-Altman plots for each parameter between two repeat MT-ME measurements for 14 volunteers. The ICCs were 0.988, 0.974, 0.989, and 0.962, respectively. Figure 3(B) shows the correlation of T1, PDFF, and R2* between MT-ME measurement and references. The Rs were 0.990, 0.976, and 0.953, respectively.
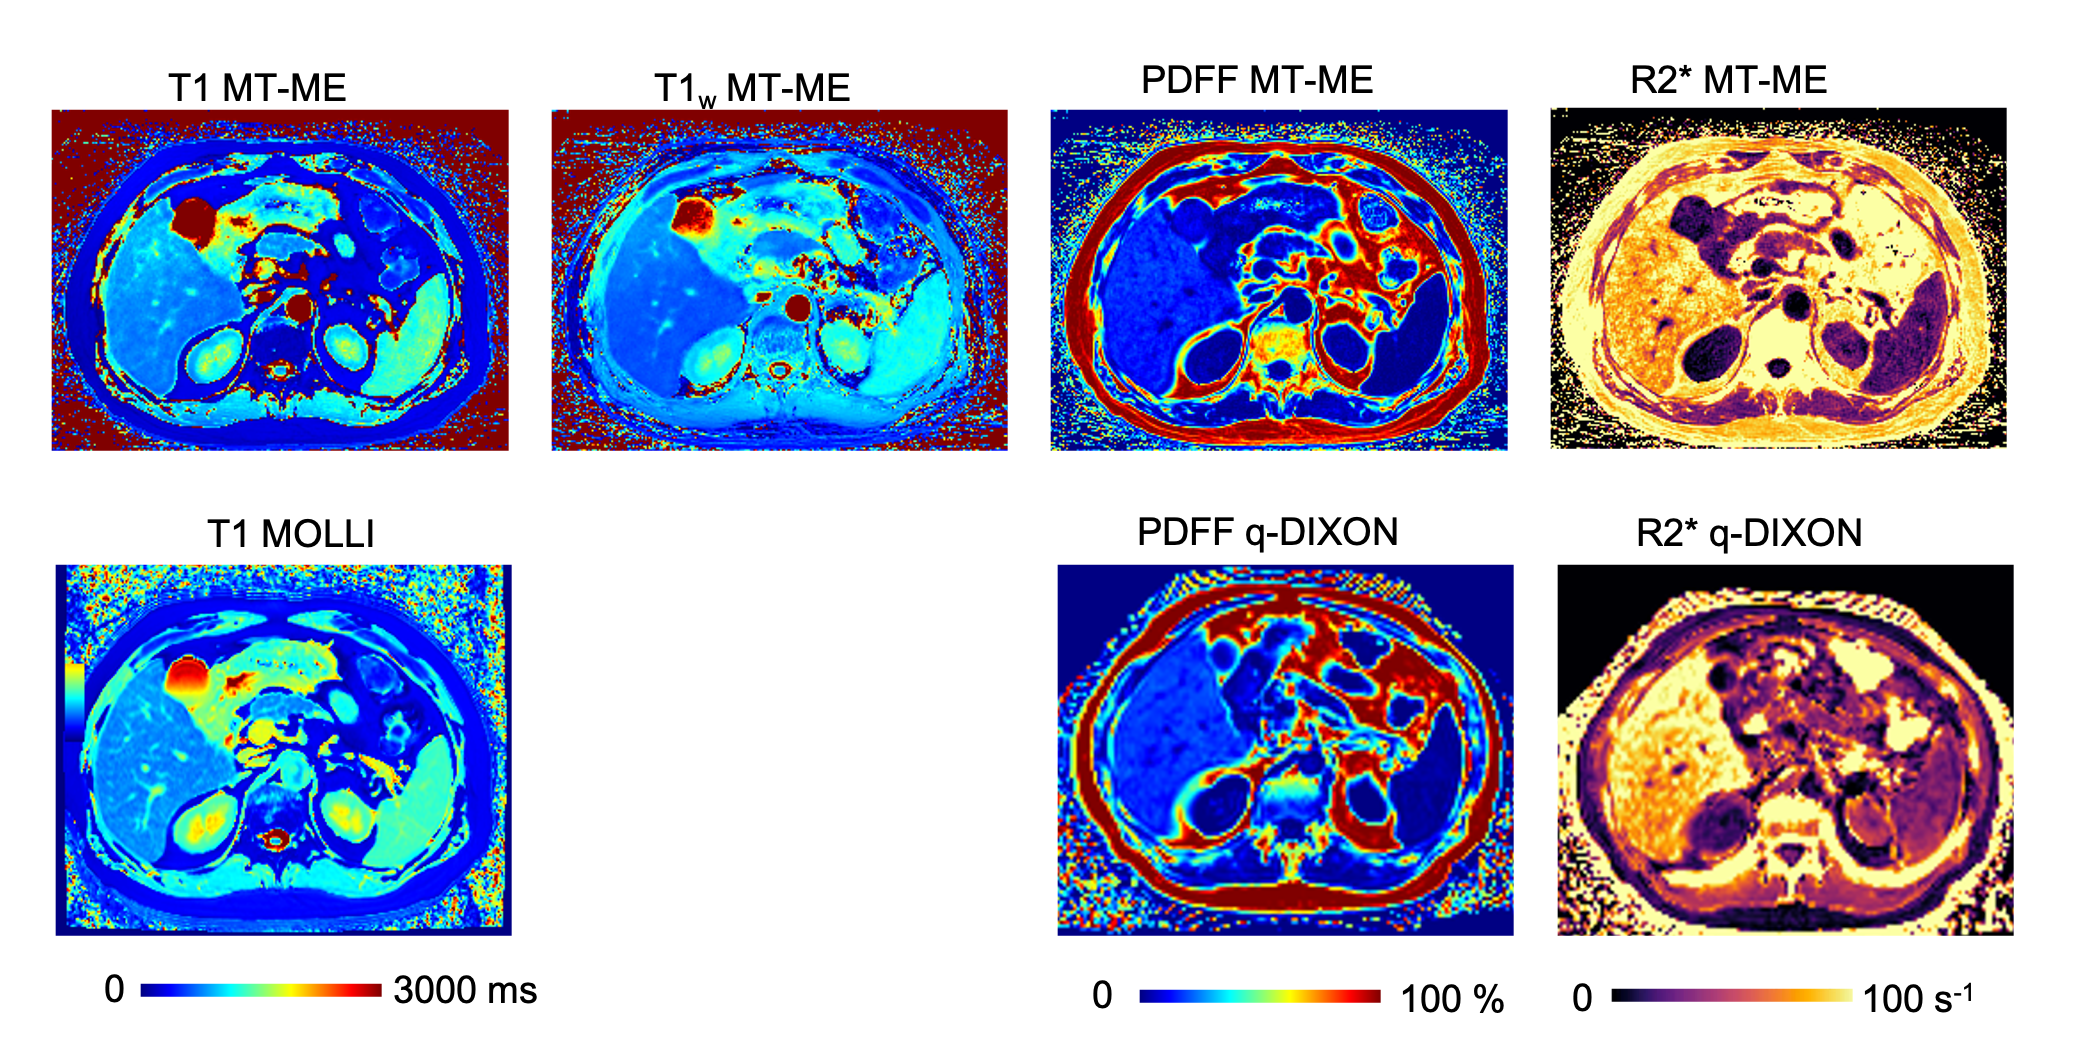
Figure 4 shows the multiparametric maps of the patient. There was good consistency between MT-ME and references.
Discussion and Conclusion
This work demonstrated the feasibility of the proposed MT-ME technique for free-breathing simultaneous mapping of T1, PDFF, and R2* with whole liver coverage. The quantitative parameters measured from MT-ME were repeatable and in good agreement with the reference methods.Acknowledgements
No acknowledgement found.References
1. Younossi Z, Anstee QM, Marietti M, et al. Global burden of NAFLD and NASH: trends, predictions, risk factors and prevention. Nat Rev Gastro Hepat. Jan 2018;15(1):11-20.
2. Hoffman DH, Ayoola A, Nickel D, Han F, Chandarana H, Shanbhogue KP. T1 mapping, T2 mapping and MR elastography of the liver for detection and staging of liver fibrosis. Abdom Radiol. Mar 2020;45(3):692-700.
3. Ble M, Procopet B, Miguel R, Hernandez-Gea V, Garcia-Pagan JC. Transjugular Liver Biopsy. Clin Liver Dis. Nov 2014;18(4):767
4. Banerjee R, Pavlides M, Tunnicliffe EM, et al. Multiparametric magnetic resonance for the non-invasive diagnosis of liver disease. J Hepatol. Jan 2014;60(1):69-77.
5. Alustiza Echeverria JM, Castiella A, Emparanza JI. Quantification of iron concentration in the liver by MRI. Insights Imaging. Apr 2012;3(2):173-80.
6. Hernando D, Levin YS, Sirlin CB, Reeder SB. Quantification of liver iron with MRI: state of the art and remaining challenges. J Magn Reson Imaging. Nov 2014;40(5):1003-21.
7. Zhong X, Nickel MD, Kannengiesser SA, Dale BM, Kiefer B, Bashir MR. Liver fat quantification using a multi-step adaptive fitting approach with multi-echo GRE imaging. Magn Reson Med. Nov 2014;72(5):1353-65.
8. Thompson RB, Chow K, Mager D, Pagano JJ, Grenier J. Simultaneous proton density fat-fraction and R-2* imaging with water-specific T-1 mapping (PROFIT1): application in liver. Magn Reson Med. Aug 4 2020
9. Luetkens JA, Klein S, Traber F, et al. Quantification of Liver Fibrosis at T1 and T2 Mapping with Extracellular Volume Fraction MRI: Preclinical Results. Radiology. Sep 2018;288(3):748-754.
10. Hoad CL, Palaniyappan N, Kaye P, et al. A study of T-1 relaxation time as a measure of liver fibrosis and the influence of confounding histological factors. Nmr in Biomedicine. Jun 2015;28(6):706-714.
11. Wang N, Christodoulou AG, Xie Y, Han Fei, Zhong X, Ma S, Bi X, Deshpande V, Li D. Three-Dimensional Free-breathing Whole-Liver Simultaneous T1, R2*, and Fat-Fraction Quantification Using MR Multitasking. In Proceedings of the Annual Meeting of ISMRM, Paris, France, 2020. Abstract 6996
12. Christodoulou AG, Shaw JL, Nguyen C, et al. Magnetic resonance multitasking for motion-resolved quantitative cardiovascular imaging. Nat Biomed Eng. 2018;2(4):215.
13. Wang N, Gaddam S, Wang L, et al. Six-dimensional quantitative DCE MR Multitasking of the entire abdomen: Method and application to pancreatic ductal adenocarcinoma. Magn Reson Med. Aug 2020;84(2):928-948.
14. Hernando D, Haldar JP, Sutton BP, Ma J, Kellman P, Liang ZP. Joint estimation of water/fat images and field inhomogeneity map. Magn Reson Med. Mar 2008;59(3):571-580.
15. Jaubert O, Arrieta C, Cruz G, et al. Multi-parametric liver tissue characterization using MR fingerprinting: Simultaneous T-1, T-2, T-2*, and fat fraction mapping. Mag Reson Med. May 13 2020
16. Messroghli DR, Radjenovic A, Kozerke S, Higgins DM, Sivananthan MU, Ridgway JP. Modified Look‐Locker inversion recovery (MOLLI) for high‐resolution T1 mapping of the heart. Magn Reson Med. 2004;52(1):141-146.
Figures