0608
A unsupervised machine learning approach for classification of white matter hyperintensity patterns applied to Systemic Lupus Erythematosus.1Clinical Science Lund / Diagnostic Radiology, Lund University, Lund, Sweden, 2Department of Radiology, Leiden University Medical Center, Leiden, Netherlands, 3Department of Medical Imaging and Physiology, Skåne University Hospital, Lund, Sweden, 4Clinical Memory Research Unit, Department of Clinical Sciences, Malmö, Lund University, Lund, Sweden, 5Department of Rheumatology, Lund University, Skåne University Hospital, Lund, Sweden, 6Department of Medical Radiation Physics, Lund University, Lund, Sweden, 7Russell H. Morgan Department of Radiology and Radiological Science, Johns Hopkins University School of Medicine, Baltimore, MD, United States, 8Department of Rheumatology, Leiden University Medical Center, Leiden, Netherlands, 9Department of Clinical Sciences/Centre for Imaging and Function, Skåne University Hospital, Lund, Sweden, 10Lund University BioImaging Center, Lund University, Lund, Sweden
Synopsis
White Matter Hyperintensities (WMH) are common clinical neuroimaging brain markers. However, WMH in Systemic Lupus Erythematosus (SLE) are non-specific. For this purpose, we developed and unsupervised machine learning approach based on individual WMH distribution to unveil hidden MRI phenotypes. Cluster analysis was performed on a two-site SLE dataset with significant different WMH burden and MRI acquisition protocols. The resulting MRI phenotypes show a clear lesion pattern on distinct WM tracts. This approach reduces the influence of the total WMH burden and MRI acquisition parameters and improves WMH characterization in SLE.
Introduction
White matter hyperintensities (WMH) are important neuroimaging and clinical markers, associated with brain damage and atrophy in many neurological diseases1. Categorisation of WMH in terms of their location is more associated with neuropsychological impairments compared to the overall number and volume of WMH in the brain2-4. To our knowledge, few studies were performed on characterization of MRI phenotypes purely based on the location5, possibly stemming from the heterogeneous character of WMH1 and different classification criteria according to type6, location and shape7. WMH in Systemic Lupus Erythematosus (SLE) are common manifestations in the brain without a clear specification. Standard lesion metrics do not provide a link to clinical symptoms or SLE patients with neuropsychiatric manifestations (NPSLE) or without (nonNPSLE)8,9.To better characterize the role of WMH in SLE, we developed an unsupervised machine learning approach which focuses on the individual lesion distribution over different WM tracts. The approach was tested on a heterogenous two-site SLE dataset.Methods
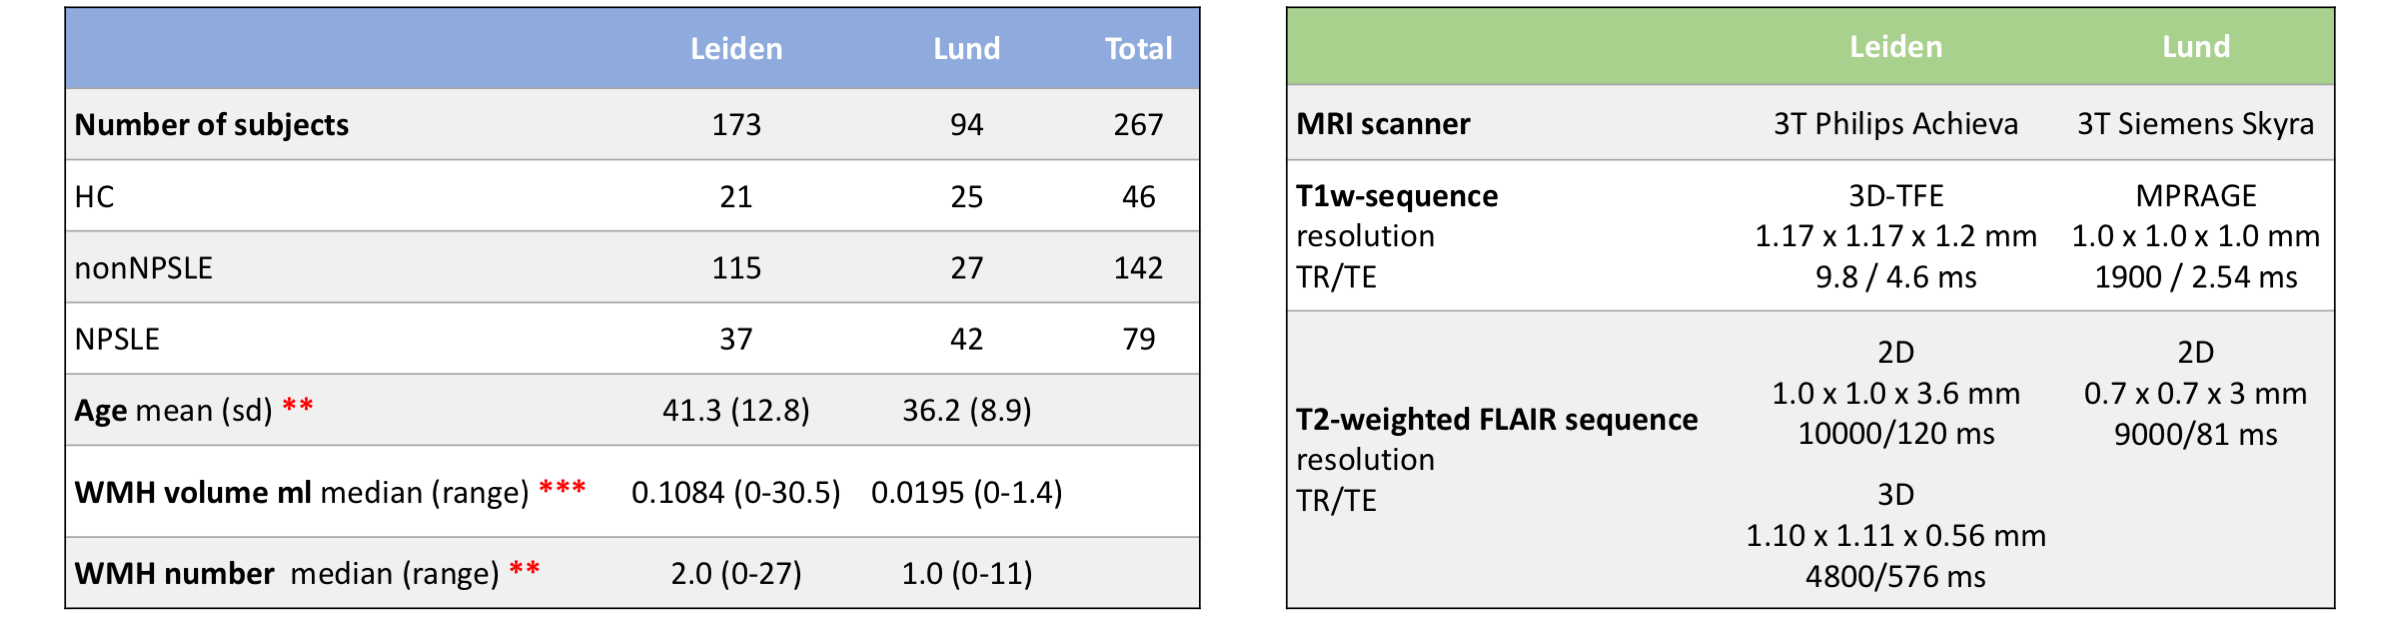
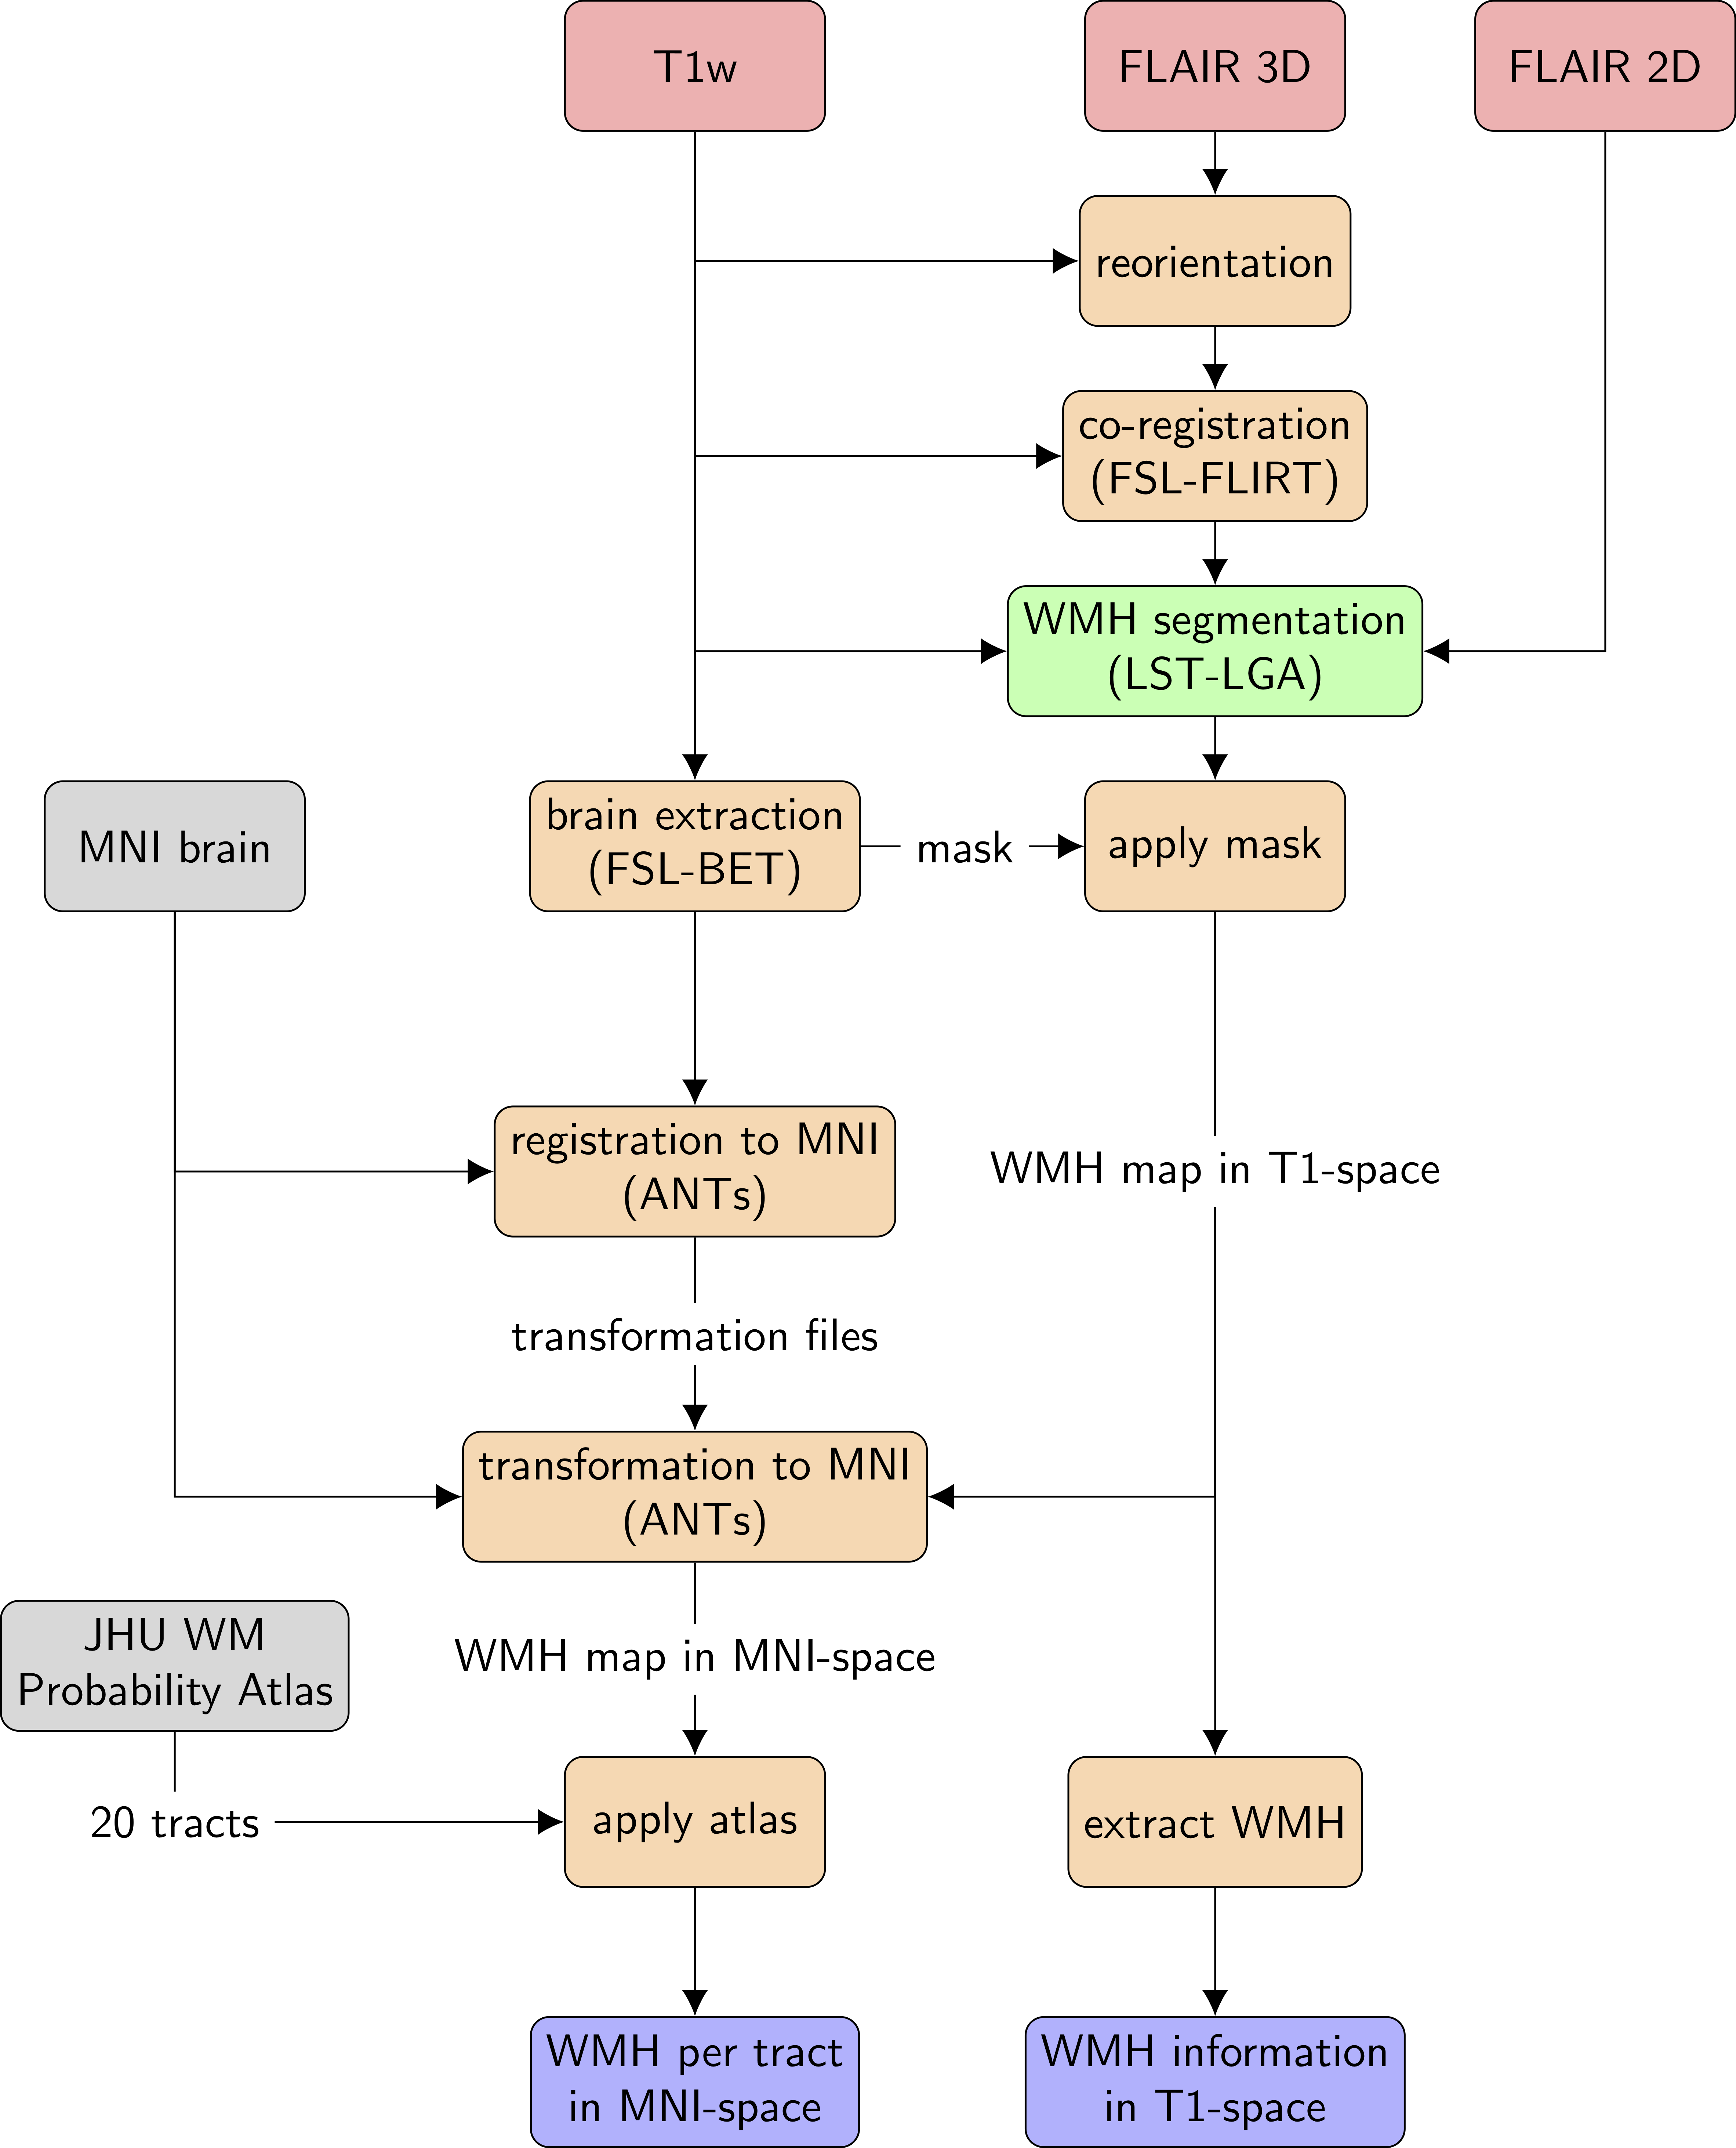
MRI data obtained from 267 subjects with SLE and healthy controls (HC) were included in this study (Table 1). Data were obtained from two sites: one cohort (Leiden, Netherlands) was scanned with a Philips Achieva 3T MRI scanner (Philips Medical, Best, The Netherlands), and included 152 SLE patients and 21 HC. The other cohort (Lund, Sweden) comprised 69 SLE patients and 25 HC, and examined on a Siemens Skyra 3T scanner (Siemens Healthineers, Erlangen, Germany). Both SLE cohorts comprise NPSLE as well as nonNPSLE patients.Preprocessing of image data prior to analysing with the segmentation algorithm was based on previous work10 and consisted of the following steps (Fig. 1): A lesion segmentation algorithm (LST-LGA11) was applied on T1-weighted 3D and T2-weighted FLAIR sequences. Information of the number of WMH and volume was extracted from the WMH maps. To quantitatively assign WMH volumes to specific WM tracts, lesion maps were masked by the Johns Hopkins University (JHU) WM tract probability atlas12 which consists of 20 WM tracts. The resulting WMH burden on each WM tract was L2-normalized in order to obtain an individual WMH pattern for each subject.Hierarchical clustering (Ward’s method) was applied on the normalized WMH pattern. HC and SLE patients without detectable WMH were not included in the cluster analysis, which was performed and evaluated using scikit-learn13. To test the robustness, clustering was performed within each cohort.Results
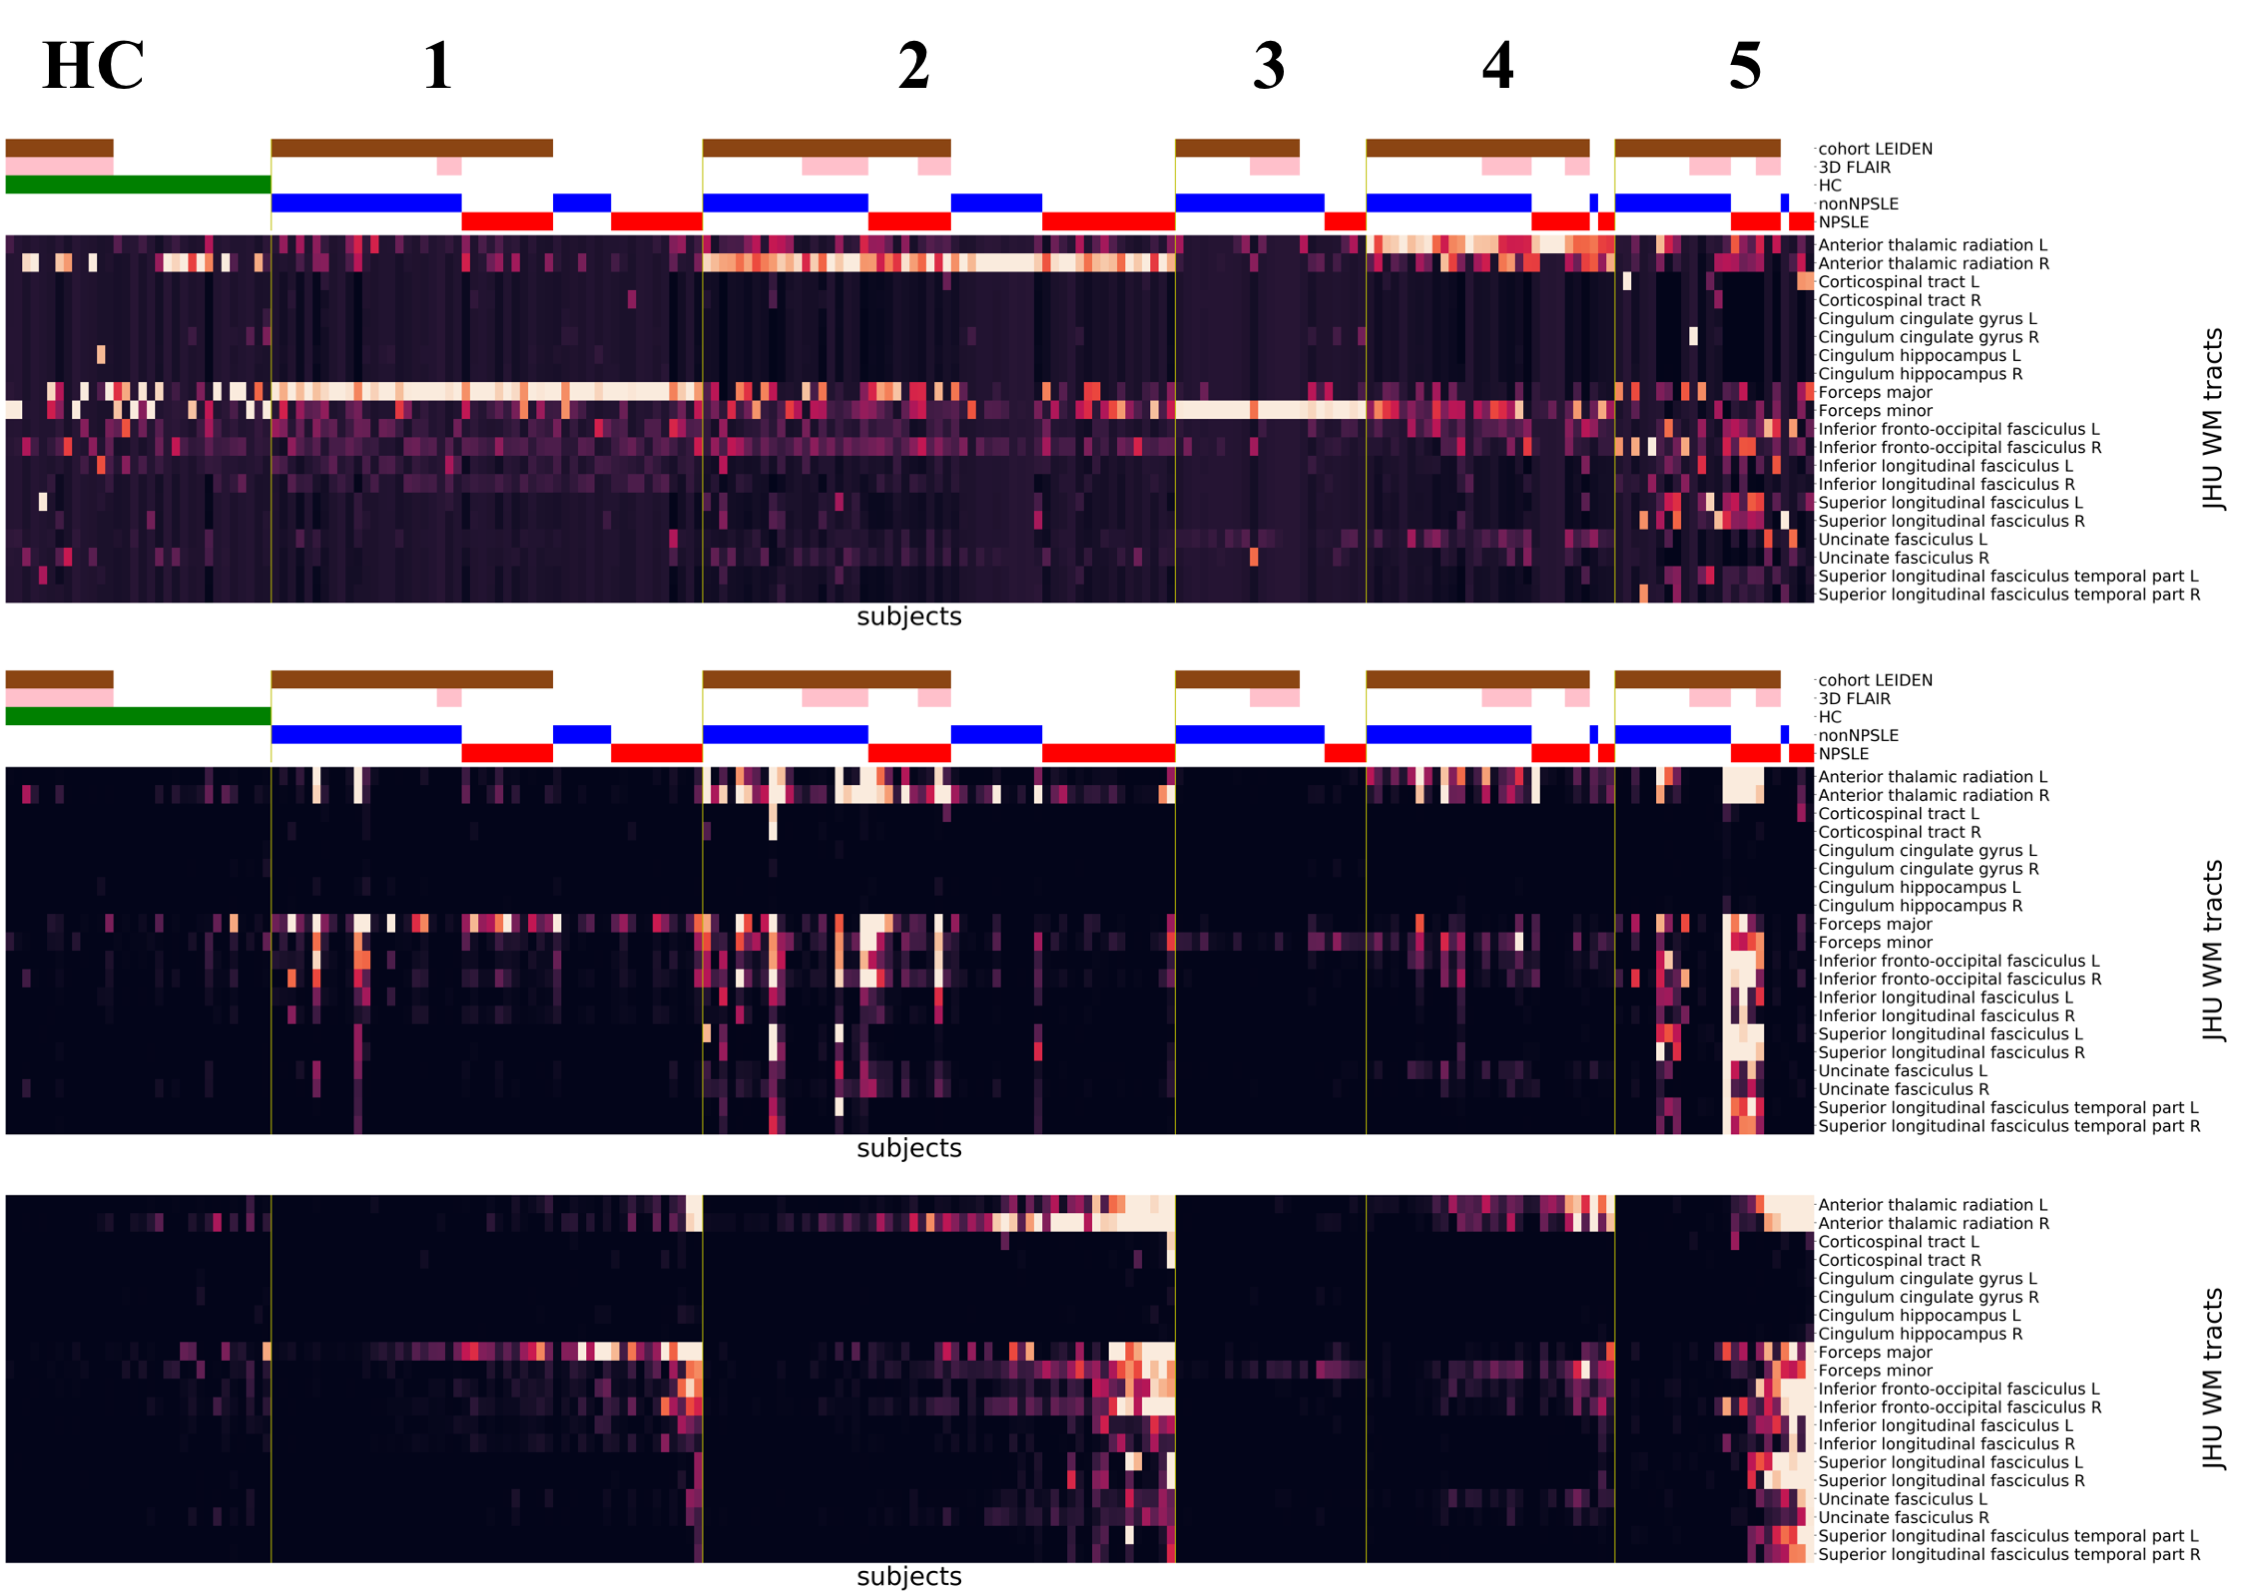
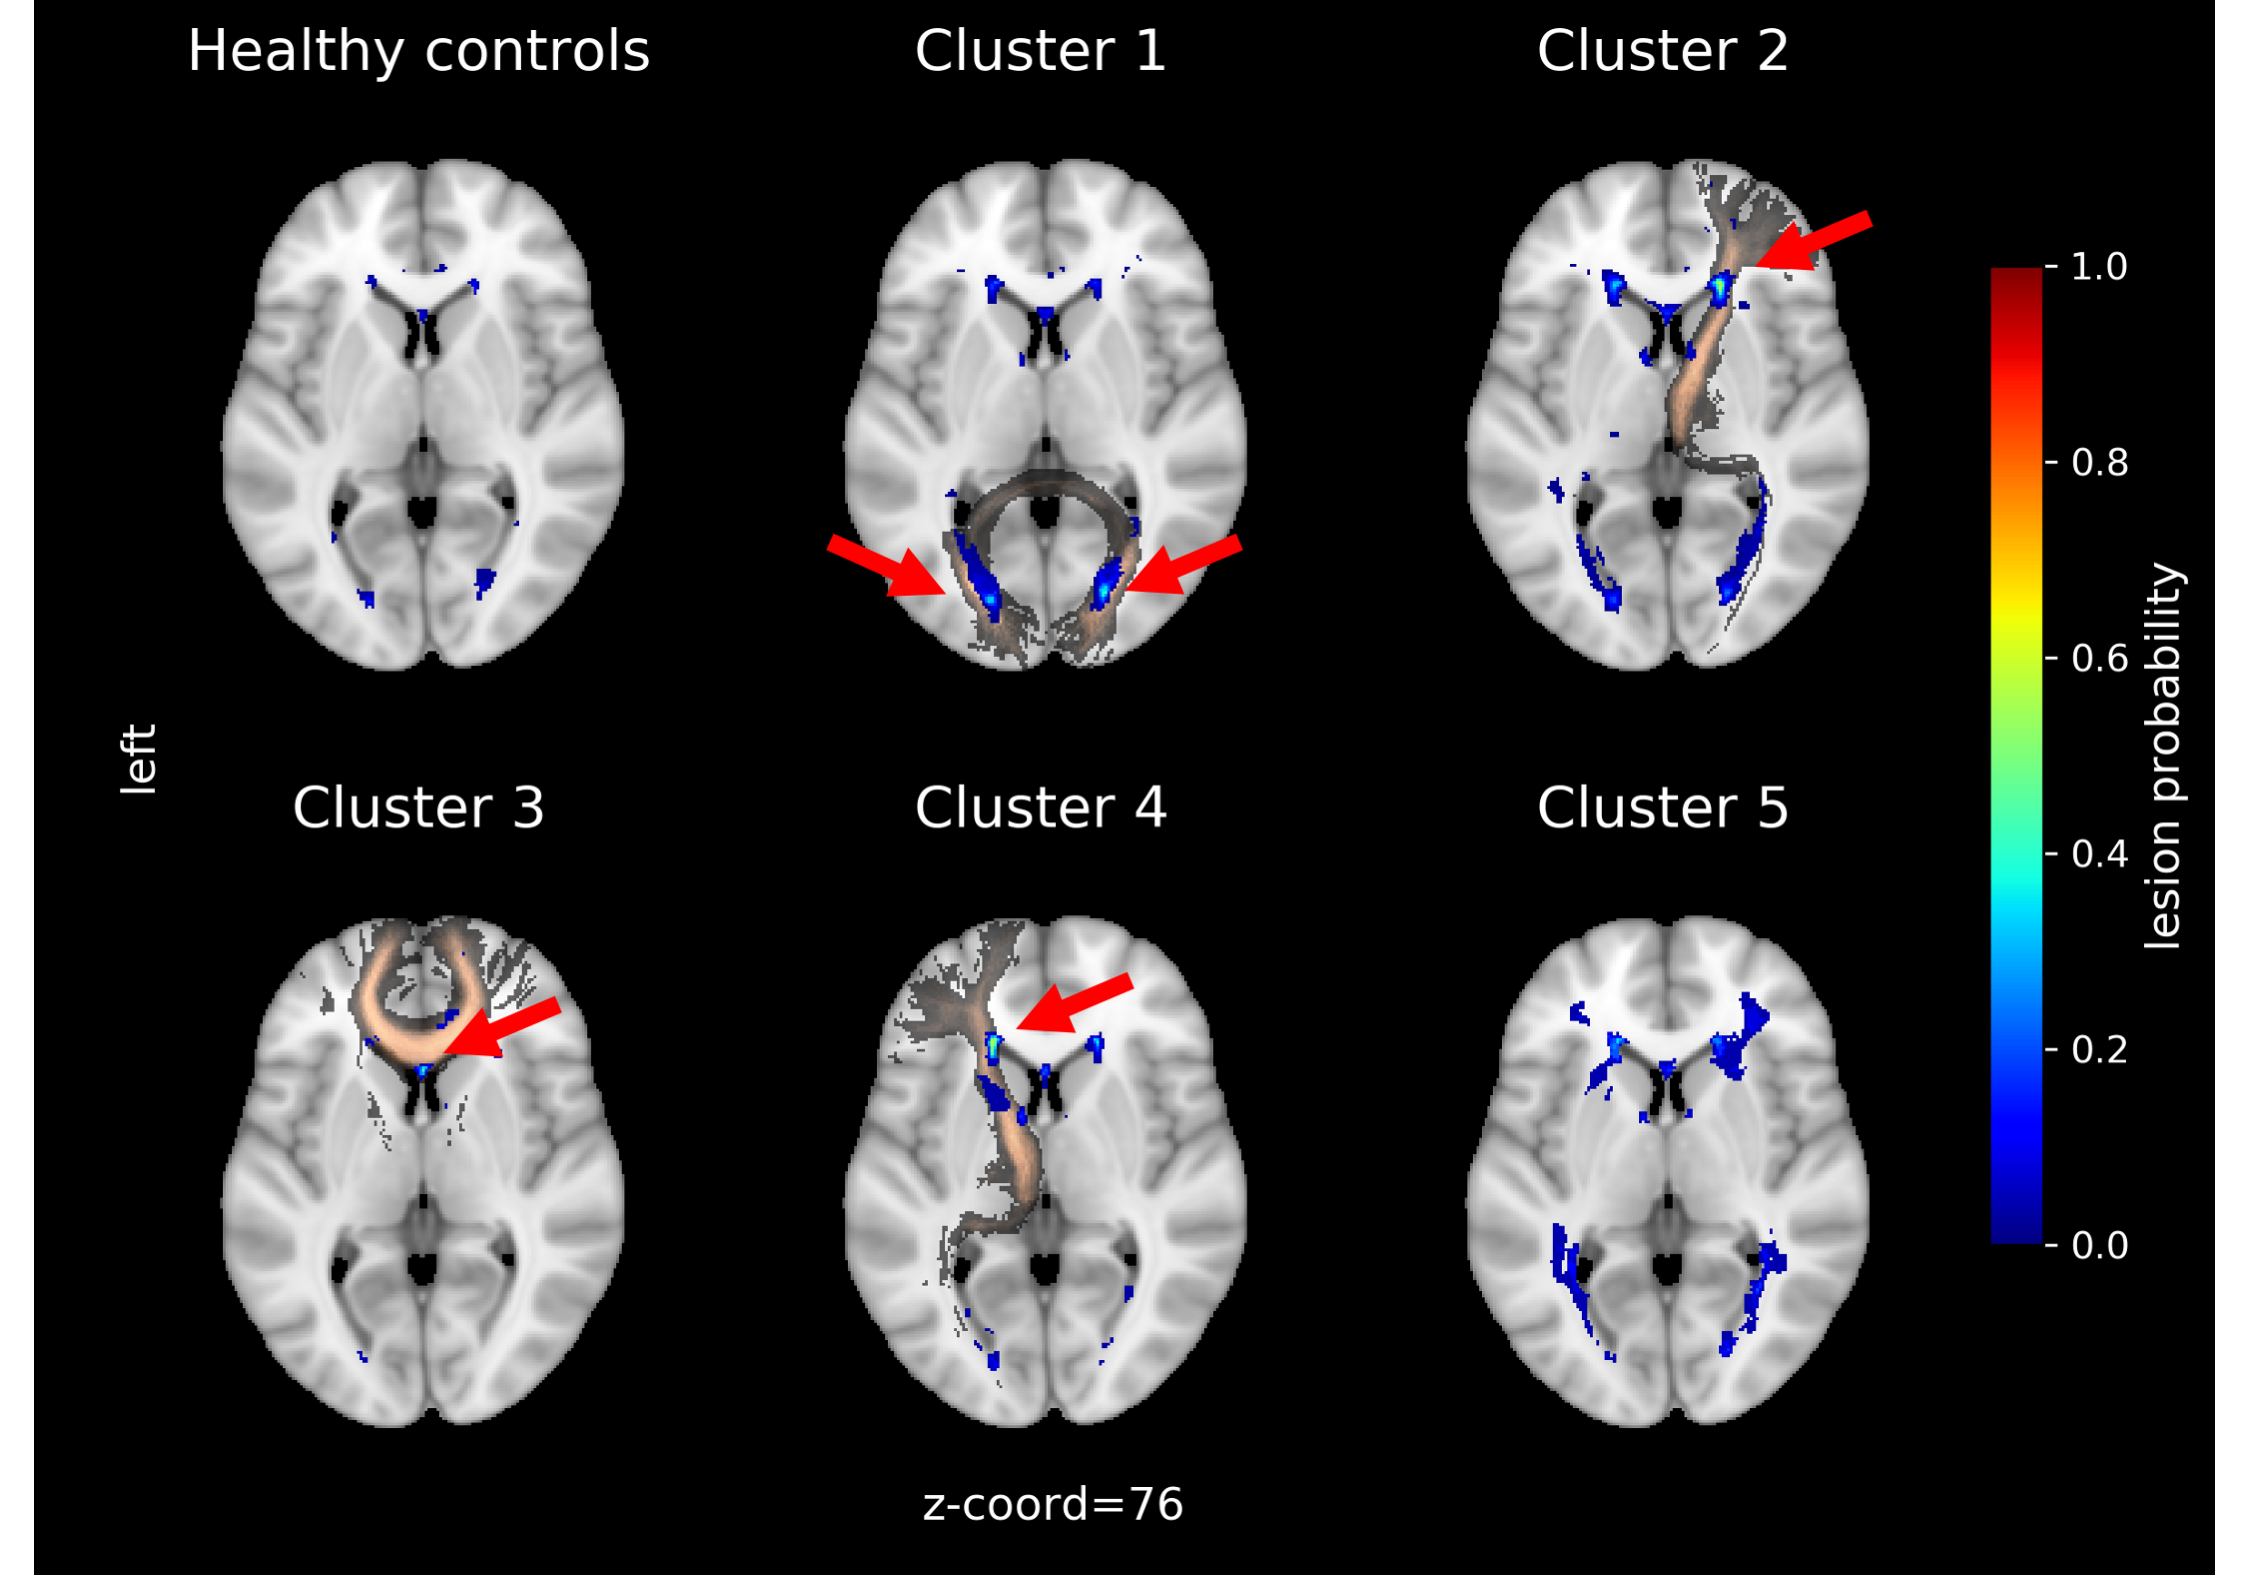
Table 1 (left) shows the demographic data for the two cohorts, and Table 1 (right) shows the site-specific MRI equipment and acquisition protocols. Subjects in the Leiden cohort were significantly older (p < .01) and showed significant higher number of WMH (p < .01) and WMH volume (p < .001). Each MRI phenotypes, or clusters, unveiled by the clustering analysis, show a clear WMH pattern (Fig. 2). Cluster 1 to 4 can be mainly assigned to: Forceps Major, right Anterior Thalamic Radiation, Forceps Minor and left Anterior Thalamic Radiation, respectively. Cluster 4 and 5 consist mainly of SLE patients from the first cohort. Cluster 5 is more heterogeneous in terms of location in WM tracts. HCs show also a heterogeneous lesion pattern over three WM tracts. The corresponding lesion distributions for each cluster and HC can be seen in the lesion frequency maps (Fig. 3). Separate clustering on each cohort show an overlap of 87 % and 93 % with the multisite clustering.Discussion
In this approach we identified clusters with a distinct WMH pattern which can be assigned to a specific WM tract. Although lesions in SLE are regarded as non-specific6, we found a consistent pattern in a two-site dataset. We could show that, while the total WMH burden is significantly different between our cohorts, clusters comprise subjects from both cohorts which share the same WMH pattern. Differences in MRI acquisition parameters between and within the cohorts played a minor role in the composition of our clusters.The observed pattern was also preserved when cluster analysis was performed within a cohort. Cluster analysis in combination with L2-normalization shifts the focus from the total lesion burden and allows extraction of phenotypes in term of afflicted WM tracts. Sorting within the clusters by the summed lesions reveals the range of severity for each phenotype (Fig. 2 bottom).This method is limited to the LST-LGA which is not developed for SLE lesions. However, in a future step we will compare and optimize different segmentation algorithms to our cohorts. Additionally, our unsupervised machine learning model can be combined with neuropsychiatric cognitive measures to provide a structured and nuanced disease staging. Resting-state fMRI data will elucidate how the WMHs impact functional connectivity14.Conclusion
We devised and used an unsupervised machine learning classification algorithm to study the spatial association of WMH with white matter tracts in a two-site cohort of SLE patients. The resulting clusters showed robust lesion patterns that were largely site independent. This approach can be useful to study the association between lesion location and NP symptoms in NPSLE and can be applied in additional diseases to assign patients by their individual WMH pattern to a certain MRI phenotype.Acknowledgements
The study was supported by funding by Regional Research founds (RegSkane 625631), SUS Foundation and donationsfunds (PSCS), Alfred Österlund foundation (PCS), Swedish Rheumatism Association R-56371 (PCS), King Gustaf V's 80-year foundation (FAI-2017-0341 and FAI-2019-0559) (PCS)References
1. Wardlaw JM, Smith EE, Biessels GJ, Cordonnier C. Fazekas F, Frayne R, … Dichgans M, Neuroimaging standards for research into small vessel disease and its contribution to ageing and neurodegeneration. The Lancet Neurology 2013; 12(8); 822-838
2. Preziosa P, Rocca MA, Pagani E, Stromillo ML, Enzinger C, Gallo A, Hulst HE, Atzori M, Pareto D, Riccitelli GC, Copetti M, De Stefano N, Fazekas F, Bisecco A, Barkhof F, Yousry TA, Arévalo MJ, Filippi M, MAGNIMS Study Group. Structural MRI correlates of cognitive impairment in patients with multiple sclerosis: A Multicenter Study. Hum Brain Mapp 2016; 37(4) ;1627-44
3. Meijer KA, Steenwijk MD, Douw L, Schoonheim MM, Geurts JJG. Long-range connections are more severely damaged and relevant for cognition in multiple sclerosis. Brain 2020; 143(1); 150-160
4. Taylor ANW, Kambeitz-Ilankovic L, Gesierich B, Simon-Vermot L, Franzmeier N, … Ewers M, Tract-specific white matter hyperintensities disrupt neural network function in Alzheimer’s disease. Alzheimer’s and Dementia 2017, 13(3), 225–235
5. Jaarsma-Coes MG, Ghaznawi R, Hendrikse J, Slump C, Witkamp TD, van der Graaf Y, Geerlings MI, de Bresser J, MRI phenotypes of the brain are related to future stroke and mortality in patients with manifest arterial disease: The SMART-MR study. Journal of Cerebral Blood Flow and Metabolism 2018; 40(2); 354-364
6. Griffanti L, Jenkinson M, Suri S, Zsoldos E, Mahmood A, Filippini N, … Zamboni G, Classification and characterization of periventricular and deep white matter hyperintensities on MRI: A study in older adults. NeuroImage 2018; 170; 174-181
7. De Bresser J, Kuijf HJ, Zaanen K, Viergever MA, Hendrikse J, Biessels GJ, … Zwanenburg J, White matter hyperintensity shape and location feature analysis on brain MRI; Proof of principle study in patients with diabetes. Scientific Reports 2018; 8; 1893
8. Hanly JG, Kozora E, Beyea SD, Birnbaum J, Nervous System Disease in Systemic Lupus Erythematosus: Current Status and Future Directions. Arthritis & Rheumatology 2019; 71(1):33-42
9. Magro-Checa C, Steup-Beekman GM, Huizinga TW, van Buchem MA and Ronen I, Laboratory and Neuroimaging Biomarkers in Neuropsychiatric Systemic Lupus Erythematosus: Where Do We Stand, Where To Go? Frontiers in Medicine 2018; 5:340
10. Rumetshofer T, Strandberg TO, Mannfolk P, Jönsen A, Nilsson M, Mårtensson J, Sundgren PM. Characterisation of white matter lesion patterns in Systemic Lupus Erythematosus by an unsupervised machine learning approach. Proceedings of ISMRM. Sydney, Australia. 2020
11. Schmidt P, Gaser C, Arsci M, Buck D, Förschler A, Berthele A, Hoshi M, Ilg R, Schmid VJ, Zimmer C, Hemmer B and Muehlau M, An automated tool for detection of FLAIR-hyperintense white-matter lesions in Multiple Sclerosis. Neuroimage 2012; 59(4):3774-3783
12. Hua K, Zhang J, Wakana S, Jiang H, Li X, Reich DS, Calabresi PA, Pekar JJ, van Zijl PCM, Mori S, Tract probability maps in stereotaxic spaces: Analyses of white matter anatomy and tract-specific quantification. NeuroImage 2008; 39(1); 336-347
13. Pedregosa F, Varoquaux G, Gramfort A, Michel V, Thirion B, Grisel O, Blondel M, Prettenhofer P, Weiss R, Dubourg V, Vanderplas J, Passos A, Cournapeau D, Brucher M, Perrot M, Duchesnay E, Scikit-learn: Machine Learning in Python; Journal of Machine Learning Research 2011; 12; 2825–2830
14. Bolandzadeh N, Davis JC, Tam R, Handy TC and Liu-Ambrose T, The association between cognitive function and white matter lesion location in older adults: A systematic review. BMC Neurology 2012; 12:126
Figures