0603
Deep Learning Segmentation of Lenticulostriate Arteries Using 3T and 7T 3D Black-Blood MRI1Siemens Medical Solutions USA, Inc., Los Angeles, CA, United States, 2University of Southern California, Los Angeles, CA, United States, 3Department of Radiology, The First Affiliated Hospital of University of South China, Hunan, China
Synopsis
Given the inaccessibility of cerebral small vessels to existing clinical in vivo imaging technologies, early cerebral microvascular morphological changes in small vessel disease (SVD) can be difficult to evaluate. In this study, we trained a deep learning (DL)-based algorithm with 3T and 7T black-blood images on two vendor platforms to automatically segment lenticulostriate arteries (LSAs) in the brain. Our results show that black-blood imaging in conjunction with DL is a promising approach to enable quantitative morphometric analysis in patients with cerebral SVD.
Purpose
The morphology of the lenticulostriate arteries (LSAs) can provide insight into the degenerative processes of small vessel disease (SVD); however, these vessels are often difficult to visualize and quantify in clinical MRI images. Recently, “black-blood” MRI techniques have been proposed to visualize LSAs with sub-millimeter spatial resolution using 3D turbo spin echo with variable flip angles (T1w-VFA-TSE) at clinical field strengths1. In this study, we developed and evaluated a deep learning (DL)-based algorithm, informed by both 3T and 7T images on two MRI vendor platforms for generality, to automatically segment the LSAs from the 3D T1w-VFA-TSE (black-blood) images acquired at 3T.Methods
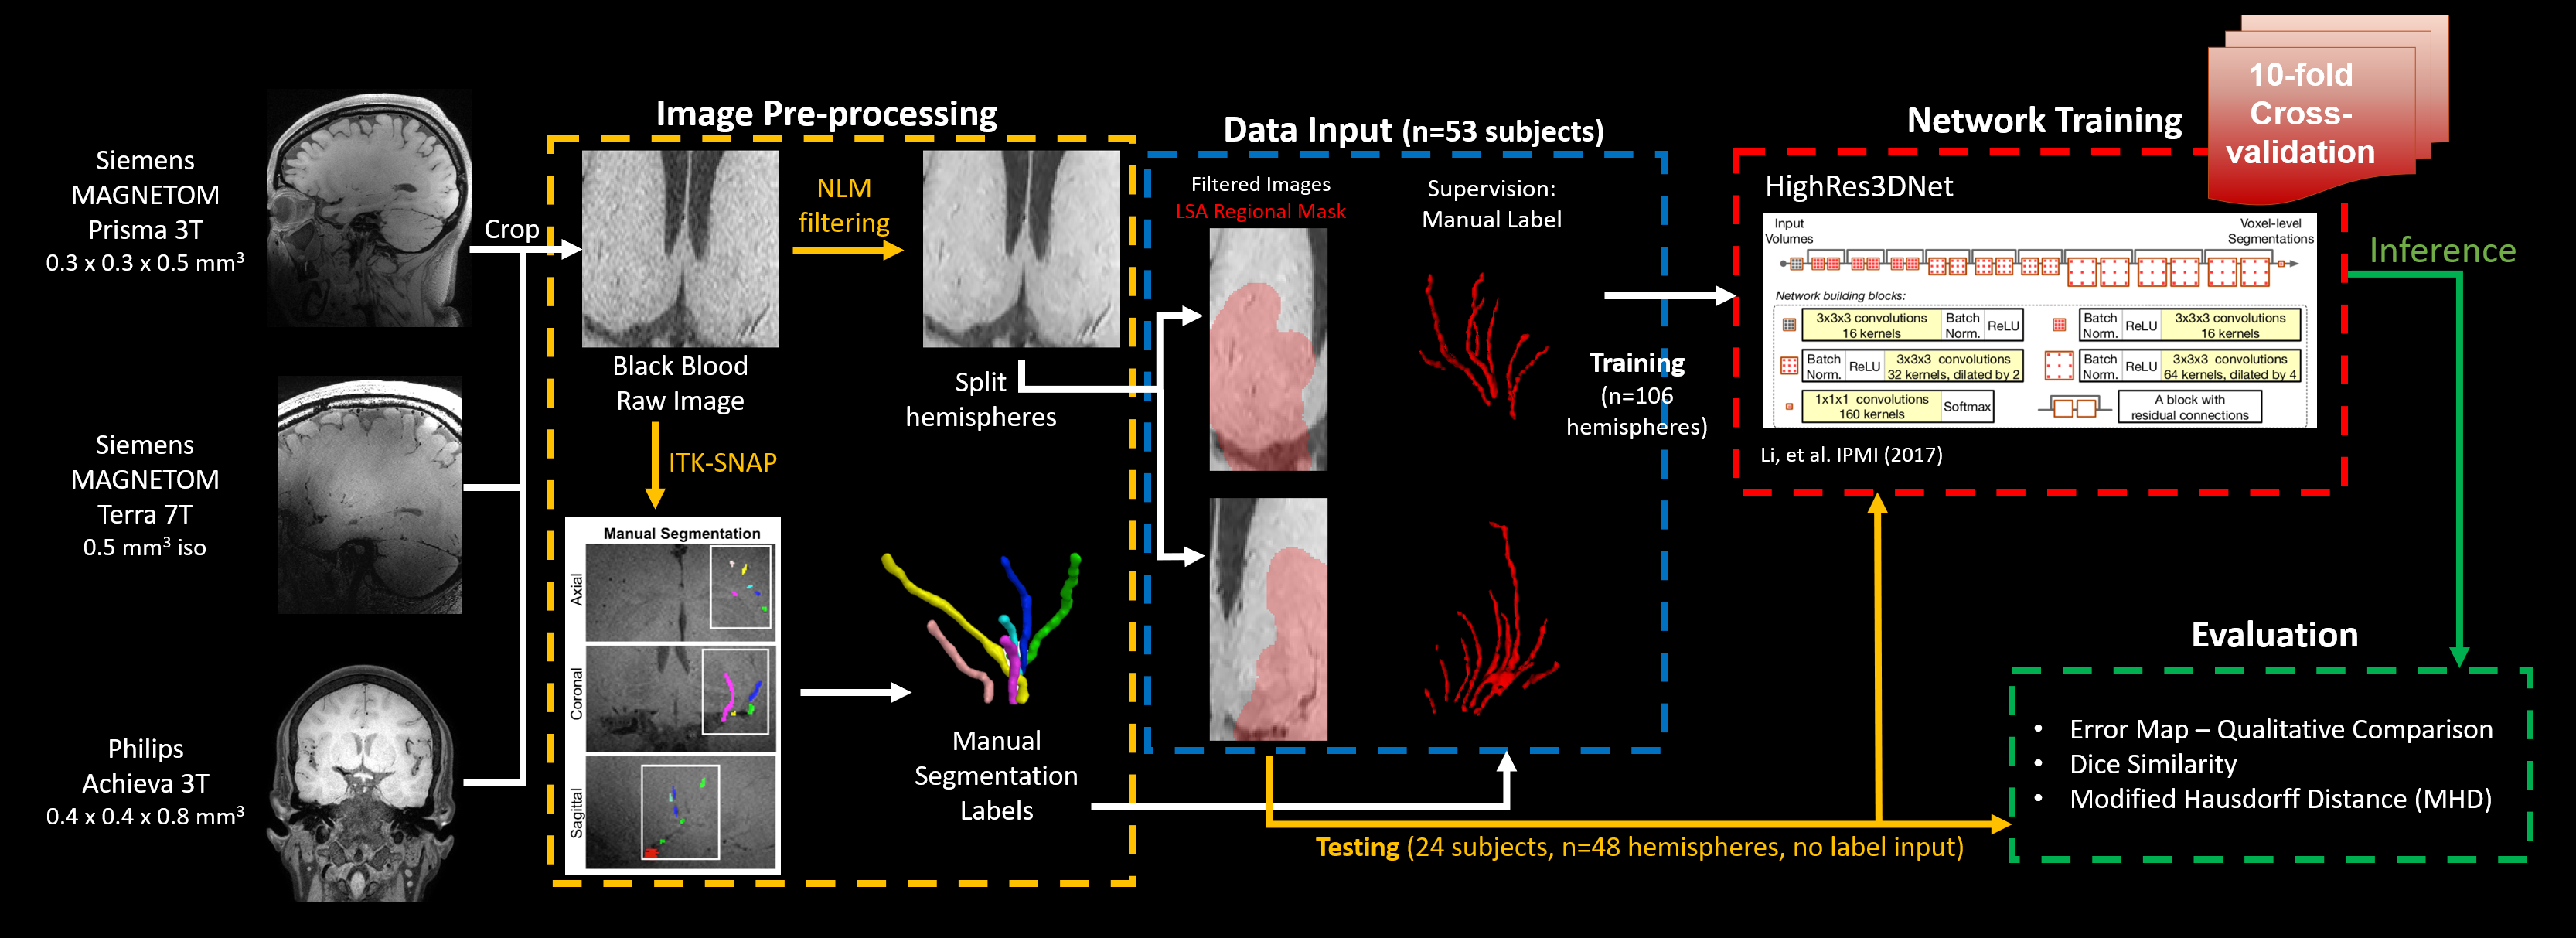
Figure 1 shows the flowchart of the experiment, including modules of pre-processing, data input, DL model architecture, and evaluation.Data Acquisition and Processing
Black-blood MRI images were collected from 77 participants (45 female, 52±18 years, age range [22,82]) following written informed consent. 28 images were acquired on a 3T MAGNETOM Prisma (Siemens Healthcare, Erlangen, Germany) with a 32-channel head coil, 17 images were acquired on a 7T MAGNETOM Terra (Siemens Healthcare, Erlangen, Germany) with a 1Tx/32Rx head coil (Nova Medical, Inc. Wilmington, MA, USA), and 32 images were acquired on a 3T Achieva (Philips Healthcare, Best, the Netherlands) with a standard 8-channel head/neck coil. On the Siemens platforms, the “black-blood” contrast was attained using an optimized T1w-VFA-TSE sequence1 with the following parameters for 3T: TR/TE=1000/12ms, turbo factor=44, matrix size=756x896, resolution=0.51x0.51x0.64mm3 interpolated to 0.3x0.3x0.5mm3, 160 sagittal slices, GRAPPA=2; TA=8:39min; and 7T: TR/TE=1200/13ms, turbo factor=40, matrix size=320x320, resolution=0.5 mm3 isotropic, 288 sagittal slices without slice oversampling, GRAPPA=3, TA=10:05 min. On the Philips platform, the T1w-VFA-TSE was acquired with the following parameters: TR/TE=500/19ms, ETL=24, matrix size=480x480, resolution=0.4x0.4x0.8mm3, 140 coronal slices, SENSE=2; TA=5min.
Three-dimensional manual segmentation of the LSAs was performed using the paintbrush tool in ITK-SNAP2. To prepare for input into the automated segmentation models, the raw images underwent several pre-processing steps. First, the images were normalized to the mean signal intensity of the Siemens 3T data, then denoised via non-local means filtering. The filtered images were cropped to a volume encompassing the LSAs and separated by left and right hemispheres to avoid the ventricular structures for a total of 154 image volumes. To improve the specificity of the training, an LSA regional mask was created by dilating all the manual segmentation labels and taking the common covered region. The dataset was divided into a training set with 53 subjects (106 volumes from 3T and 7T scanners) and a test set with 24 subjects (48 volumes from Philips 3T scanner).
Network Architecture and Training
The HighRes3DNet3 architecture with 20 layers and residual connections was adapted from and trained within the NiftyNet4 platform on 2 Nvidia GeForce GTX 1080 Ti GPUs5. Black-blood images from 3T and 7T and the LSA regional masks were used as input, and manual segmentation labels served as the supervision. 48x48x48 volumes (batch size=4) were randomly extracted from the 3D preprocessed images for training. Volume-level augmentation included rotation and random spatial rescaling. The training process was performed with 30,000 iterations, with the Dice loss function and Adam optimizer6 for computing graph gradients. Ten-fold cross-validation was used to address the limited dataset size.
Model Performance Assessment
The model performance was assessed for the training and test sets using Dice similarity and modified Hausdorff distance (MHD)7 in MATLAB (Mathworks, Natick, MA). The MHD is an object matching distance metric that is robust to outliers and indicates the distance between two segmentation results; thus, smaller values indicate better performance. The inference result of the training set was obtained by assembling the output of the ten-fold cross-validation. Since 10 models were built through the cross-validation, the consensus of the 10 outputs, which was generated by averaging the 10 probability maps of the 10 models and subsequently binarizing with threshold=0.5, was used for test set evaluation.
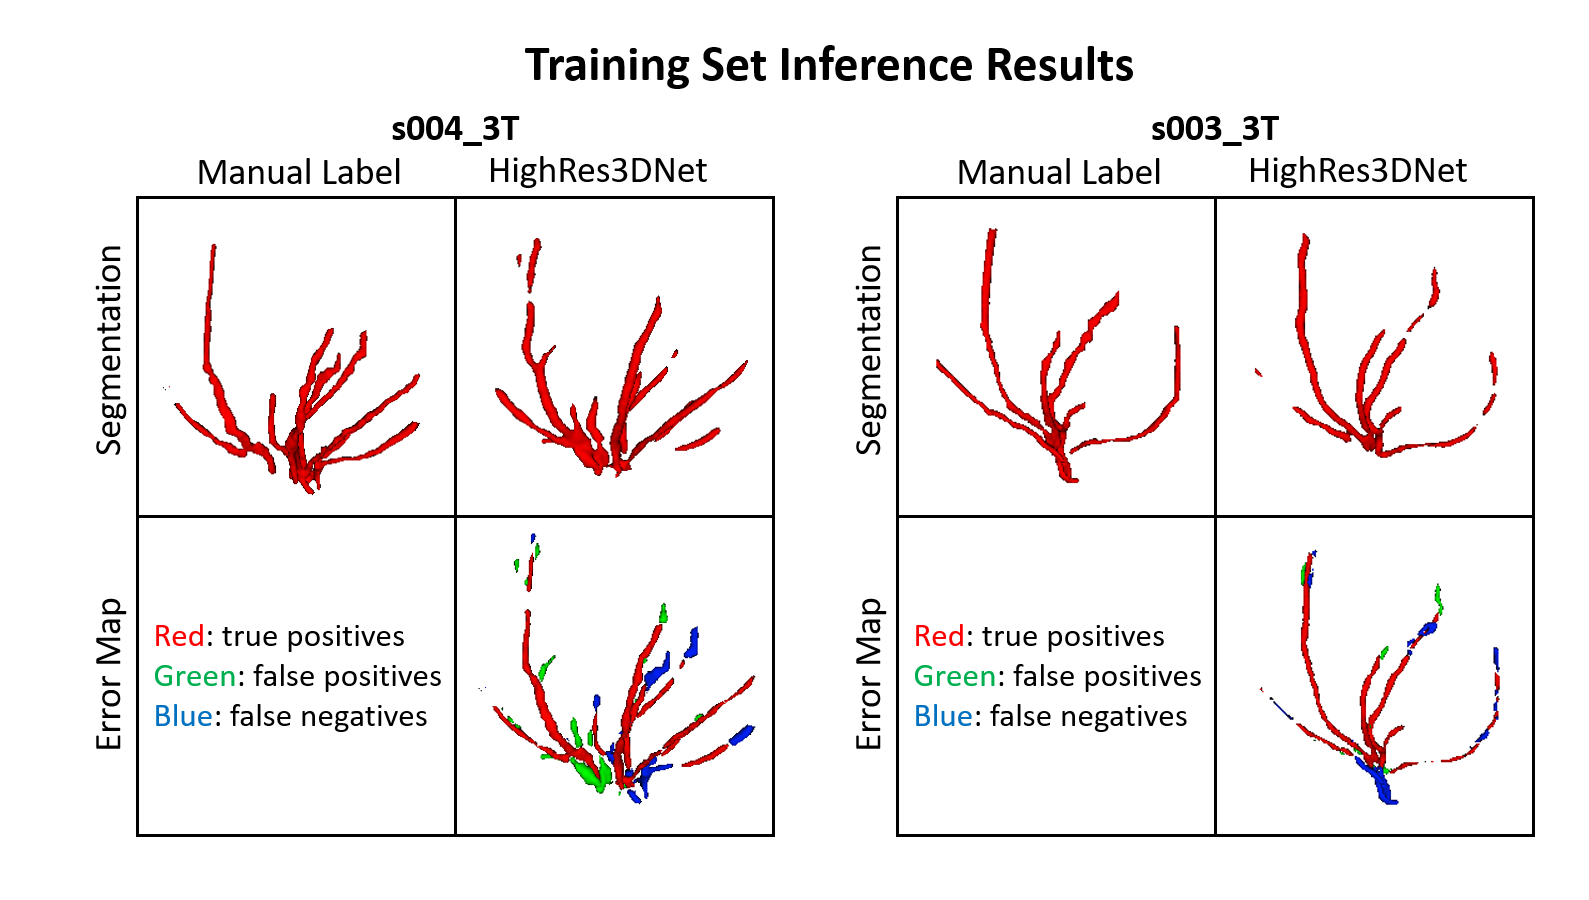
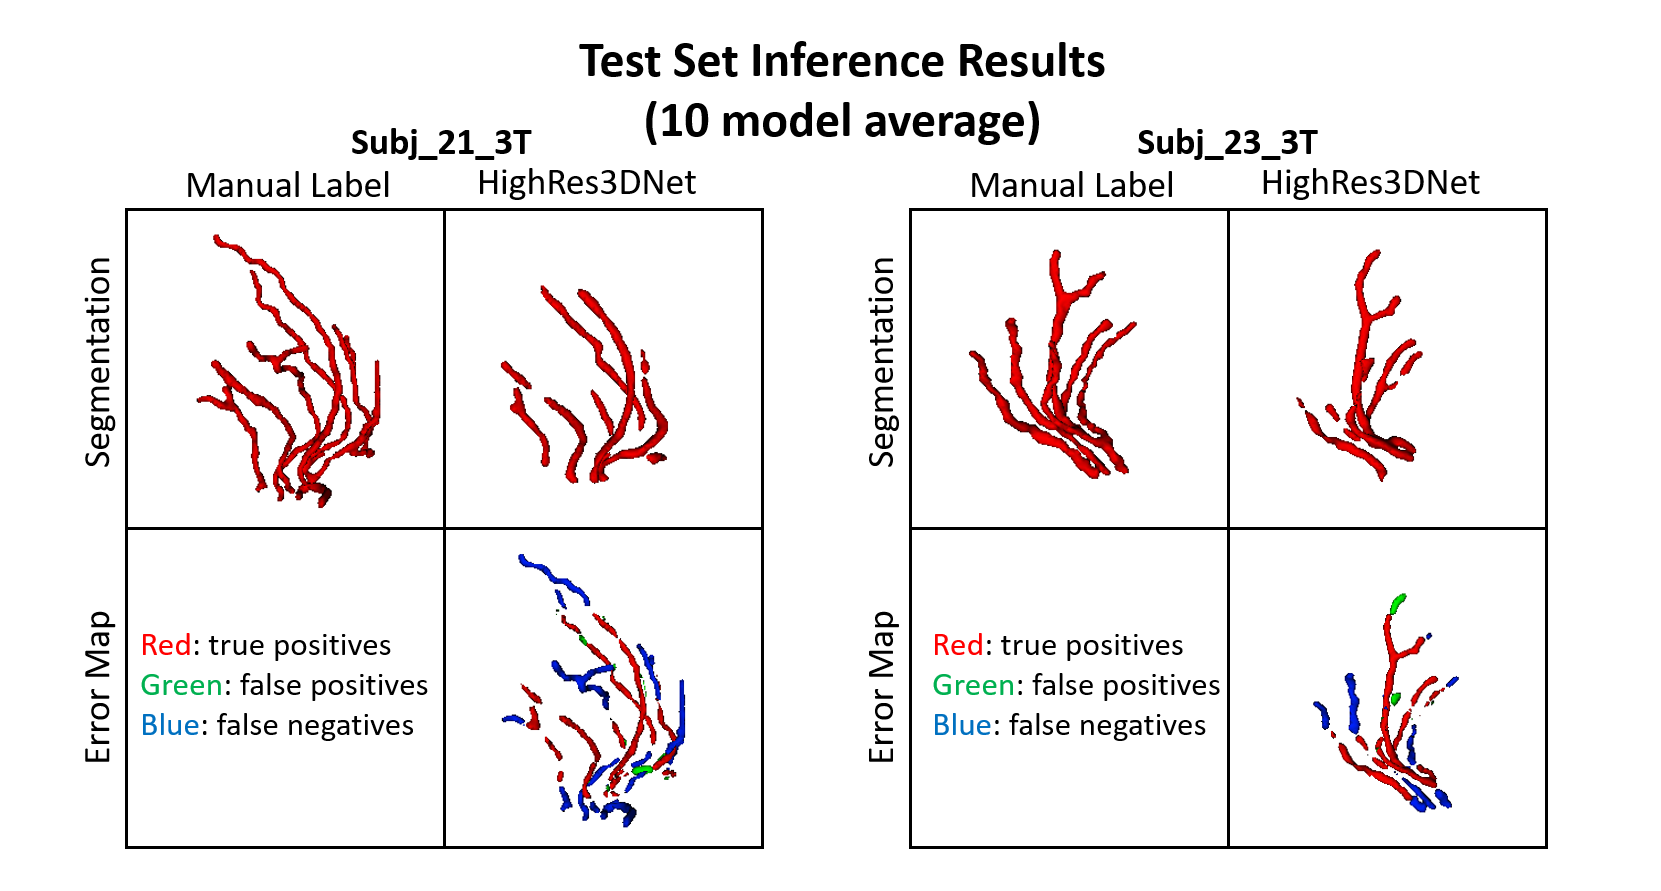
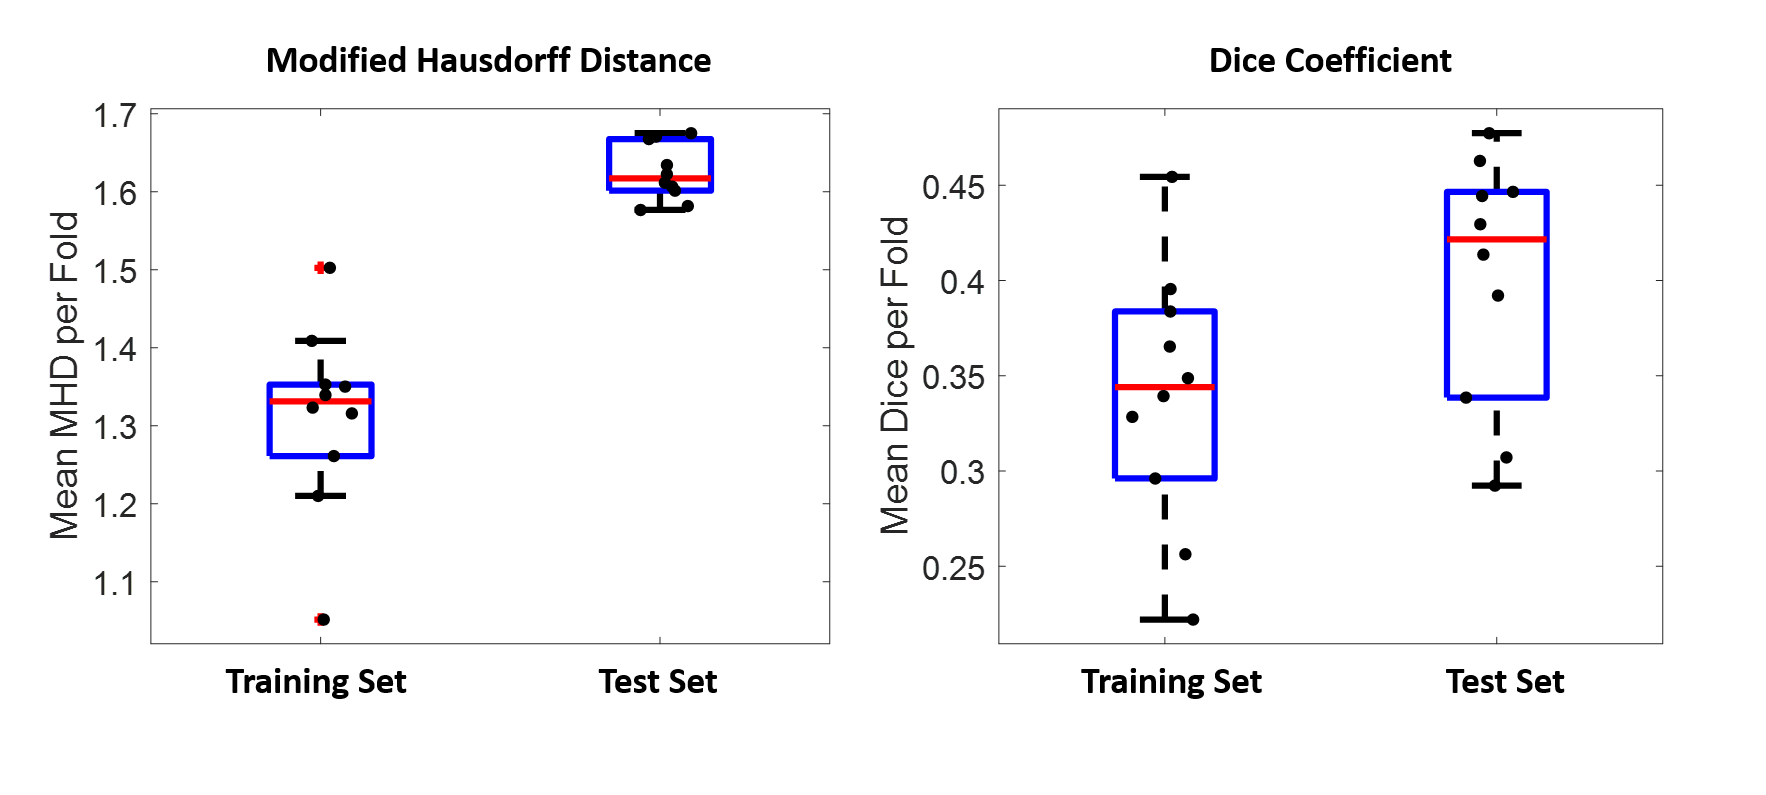
Results and Discussion
In Figures 2 and 3, examples of the 3D projections of the segmentation results are shown for representative subjects from the training and test sets, respectively. The MHD for the training and test sets was 1.31±0.12 and 1.62±0.04 voxels, respectively. The group average Dice coefficient was 0.34±0.07 and 0.4±0.03, respectively. Figure 4 shows boxplots of the metrics for HighRes3DNet for all 10 folds for the training and test sets. These metrics should be interpreted with caution because manual segmentation is still limited to human interpretation. By including in the network training images acquired at different field strengths with varied parameters and two vendor platforms, this DL-based model can be used generally for the application of vessel segmentation in most black-blood images. With further hyperparameter optimization and tuning, the HighRes3DNet model is a promising method for LSA segmentation in black-blood images.Conclusion
In this work, we present a deep learning framework for segmentation of the lenticulostriate arteries from 3D black-blood images. With the inclusion of data acquired at various field strengths, sites, and parameters in the training set, automated 3D segmentation of LSAs is feasible on varying acquisitions of black-blood images with reasonable performance. As it is much faster than the manual segmentation process, this segmentation algorithm can aid future quantitative morphometric analyses in patients with cerebral small vessel disease.Acknowledgements
This work was supported by National Institutes of Health grants UH2-NS100614, S10-OD025312, K25-AG056594 and P41-EB015922. This work was also supported by American Heart Association grant 16SDG29630013.References
1. Ma SJ, Sarabi MS, Yan L, et al. Characterization of lenticulostriate arteries with high resolution black-blood T1-weighted turbo spin echo with variable flip angles at 3 and 7 Tesla. Neuroimage 2019; 199: 184-93.
2. Yushkevich PA, Piven J, Hazlett HC, et al. User-guided 3D active contour segmentation of anatomical structures: Significantly improved efficiency and reliability. Neuroimage 2006; 31(3): 1116-28.
3. Li W, Wang G, Fidon L, Ourselin S, Cardoso MJ, Vercauteren T. On the Compactness, Efficiency, and Representation of 3D Convolutional Networks: Brain Parcellation as a Pretext Task; 2017.
4. Gibson E, Li W, Sudre C, et al. NiftyNet: a deep-learning platform for medical imaging. Computer Methods and Programs in Biomedicine 2018; 158: 113-22.
5. Ma SJ, Sharifi Sarabi M, Wang K, et al. Deep Learning Segmentation of Lenticulostriate Arteries on 3D Black Blood MRI. Proc Intl Soc Mag Reson Med 2020; 28: 1305.
6. Kingma D, Ba J. Adam: A Method for Stochastic Optimization. International Conference on Learning Representations 2014.
7. Dubuisson M, Jain AK. A modified Hausdorff distance for object matching. Proceedings of 12th International Conference on Pattern Recognition; 1994 9-13 Oct. 1994; 1994. p. 566-8 vol.1.
Figures