0602
Classification of Pediatric Posterior Fossa Tumors using Convolutional Neural Network and Tabular Data1Sagol Brain Institute, Tel Aviv Sourasky Medical Center, Tel Aviv, Israel, 2Sackler Faculty of Medicine, Tel Aviv University, Tel Aviv, Israel, 3Sagol School of Neuroscience, Tel Aviv University, Tel Aviv, Israel, 4The Iby and Aladar Fleischman Faculty of Engineering, Tel Aviv University, Tel Aviv, Israel, 5Department of Pediatric Neurosurgery, Tel Aviv Sourasky Medical Center, Tel Aviv, Israel, 6The Gilbert Israeli Neurofibromatosis Center, Tel Aviv University, Tel Aviv, Israel, 7The Gilbert Israeli Neurofibromatosis Center, Tel Aviv Sourasky Medical Center, Tel Aviv, Israel, 8Division of Radiology, Tel Aviv Sourasky Medical Center, Tel Aviv, Israel
Synopsis
A fused architecture contrived of 2 neural networks, pre-trained ResNet-50 CNN and tabular based network is proposed for the classification of Posterior fossa tumors (PFT) types. The study included data for 158 MRI of healthy controls and pediatric patients with PFT. The input data were T1WI+C, FLAIR and diffusion MRI, and tabular data (subject's age). The best classification results obtained by the fused CNN + tubular data architecture and based on diffusion images, achieved cross-validation accuracy of validation=0.88±0.04, test=0.87±0.02. Overall, the proposed architecture achieved a ~16% improvement in accuracy for the test data compared to CNN method for this dataset.
Introduction
Posterior Fossa Tumors (PFT) are the most common solid tumors that develop in children 1. Patient age at diagnosis and MRI characteristics can help in differentiation of PFT types (Pilocytic Astrocytoma, Medulloblastoma and Ependymoma) 2,3. However currently, diagnosis can only be obtained based on histopathological examination. The aim of this study was to classify PFT types using deep learning architecture which integrates MRI data and patient age.Methods
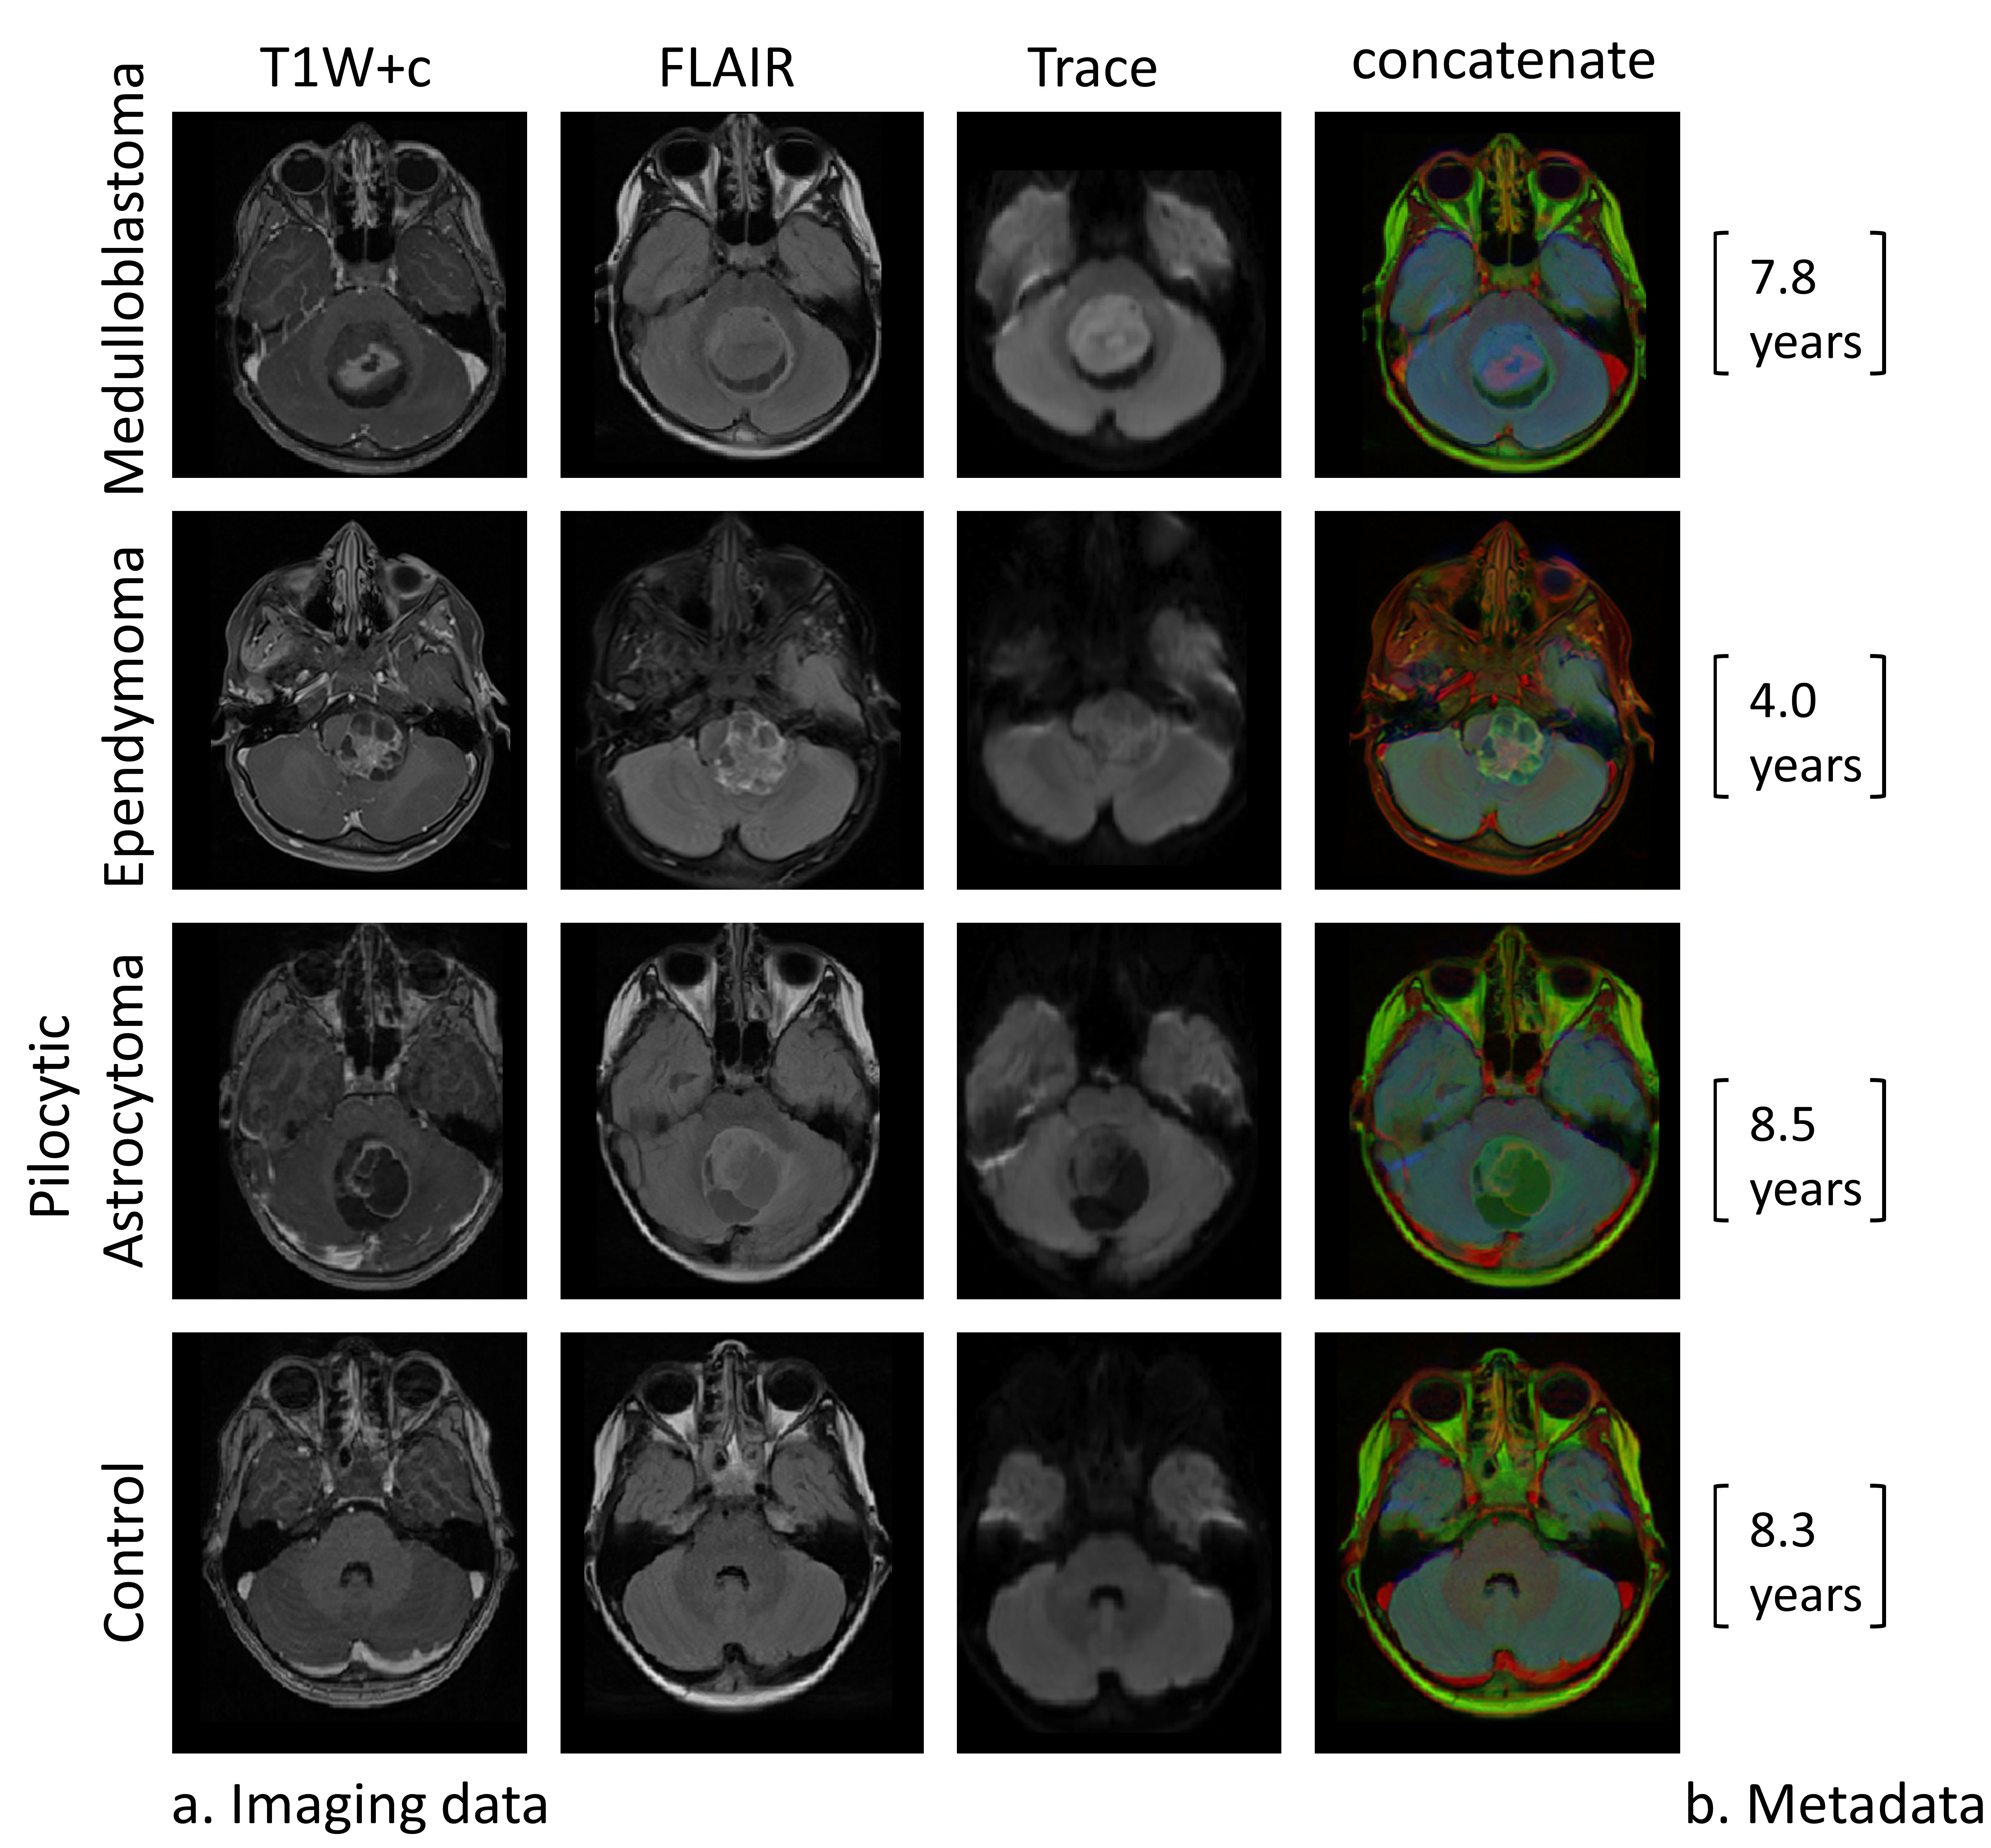
Dataset: Included 157 MRI scans (22 from healthy subjects, and 136 from patients with PFT). MRI data included post contrast T1WI+c, FLAIR and diffusion weighted (Trace) images (Figure 1).Data Preprocessing: Included image coregistration, bias field correction, background removal and image cropping (brain region delineation), image resizing to 256X256, end extraction of the subject's age from the DICOM header.
Data annotation and splitting: Manual tagging of the central tumor slice in patients, and the slice number located in the center of the posterior fossa (in healthy participants) was performed and a total of five slices were automatically extracted (tagged 2 slices) for each case. The entire dataset was split into 85% training and validation and 15% testing datasets. The training and validation dataset was split into 80% training and 20% validation in a five-fold cross-validation manner.
Data augmentation: Included right-left flipping, rotation, zooming and random brightness changes. For the tabular data, the augmented age was sampled from a distribution similar to the distribution of each class in the original dataset.
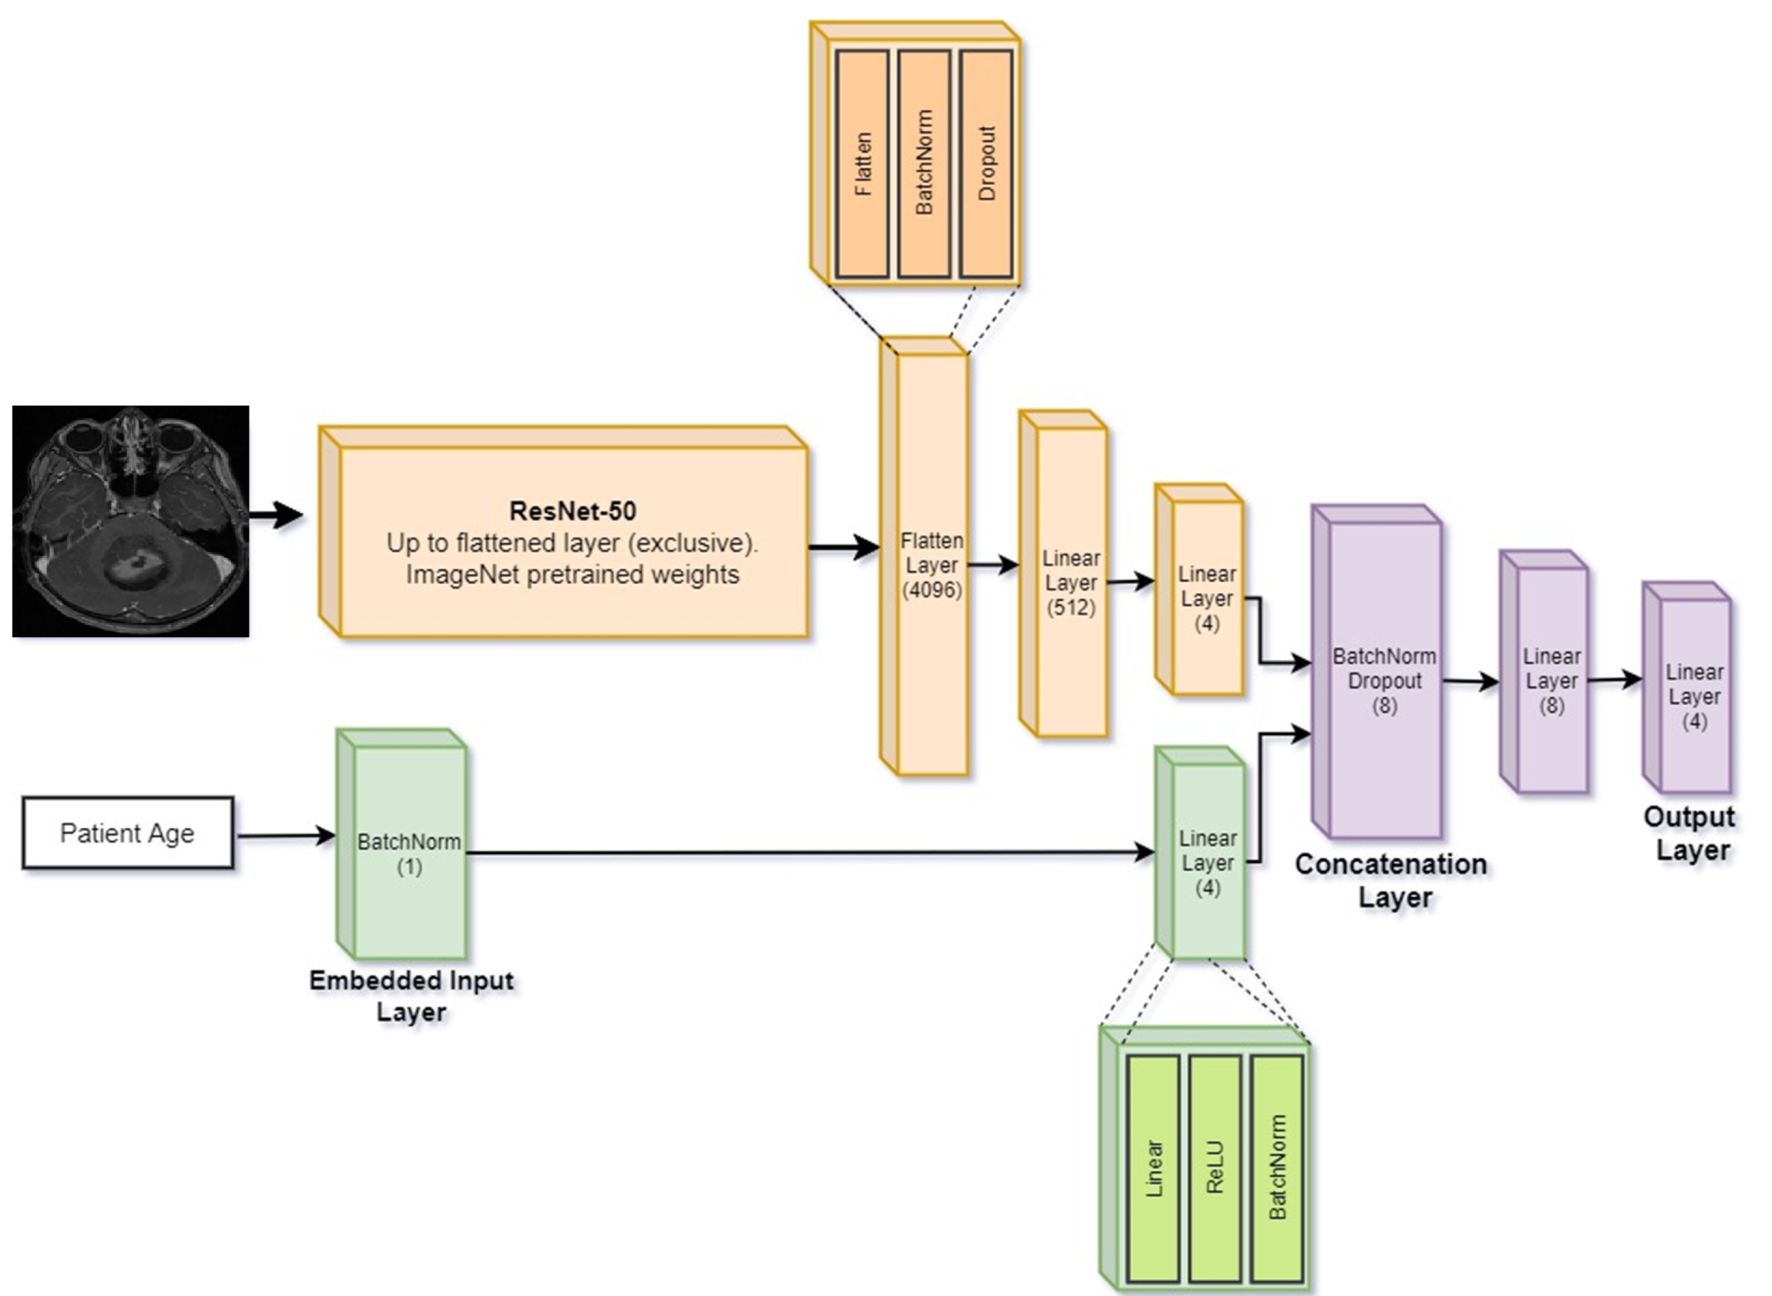
Network training: Input data included T1W+c, FLAIR and diffusion Trace images, and normalized subject's age. Classification performance were tested based on three neural networks architectures: (1) Tabular architecture based on 4 with 1 input node for age, followed by batch normalization and 4 nodes in the hidden layer, and Cross Entropy loss function, (2) CNN architecture based on 2D ResNet50 5, and (3) Fused CNN + tubular architecture: An integrated architecture was used, which received tabular information in the input layer along with images (Figure 2). The architecture is comprised of 2 neural networks: CNN and the tabular network. The CNN is identical to ResNet50's architecture up until the linear layer, and the tabular network consists of batch-norm embedding layer followed by a 4 node linear layer.
Post processing: Was performed at the subject level and for the test data only. For a given set of 2D images with predictions, which belong to a given patient, adjacent slices were clustered and classification was determined through majority voting between the cluster slices.
Evaluation of classification results: Was performed on the validation and test datasets, and for each one of the 5-folds, using accuracy, precision, recall and F1 score. Classification results were evaluated for the following experiments: (1) Tabular architecture, (2) CNN architecture for each one of the four input datasets (T1W+c, FLAIR, diffusion and concatenated image of the three contrasts), (3) Fused CNN + tubular architecture for the best input imaging configuration. For visual explanations, Gradient-weighted Class Activation Mapping (Grad-CAM) 6 was used.
Results
Classification results1) Tabular architecture: classification based on age only achieved poor result of mean accuracy = 0.42±0.08, however the relatively high recall score obtained for the Ependymoma (0.70±0.27) compared with the other groups (0.15-0.63), indicates its potential contribution for groups classification.
2) CNN architecture: The best classification results were obtained using diffusion (Trace) images only with overall accuracy of 0.86±0.02 for the validation and 0.75±0.04 for the test data.
3) Fused CNN + tubular architecture: The proposed architecture achieved the highest performance with improvement of 16% in accuracy compared to CNN architecture for this dataset. With overall accuracy of 0.88±0.04 for the validation and 0.87±0.02 for the test datasets. The similar performance obtained for the validation and test datasets demonstrate the high generalizability of the model. The proposed architecture also achieved substantial improvement in the Ependymoma precision score compared with the CNN only (validation= 0.90±0.15 vs. 0.52±0.19, test= 0.16±0.15 vs. 0.70±0.19).
Visual model explanation
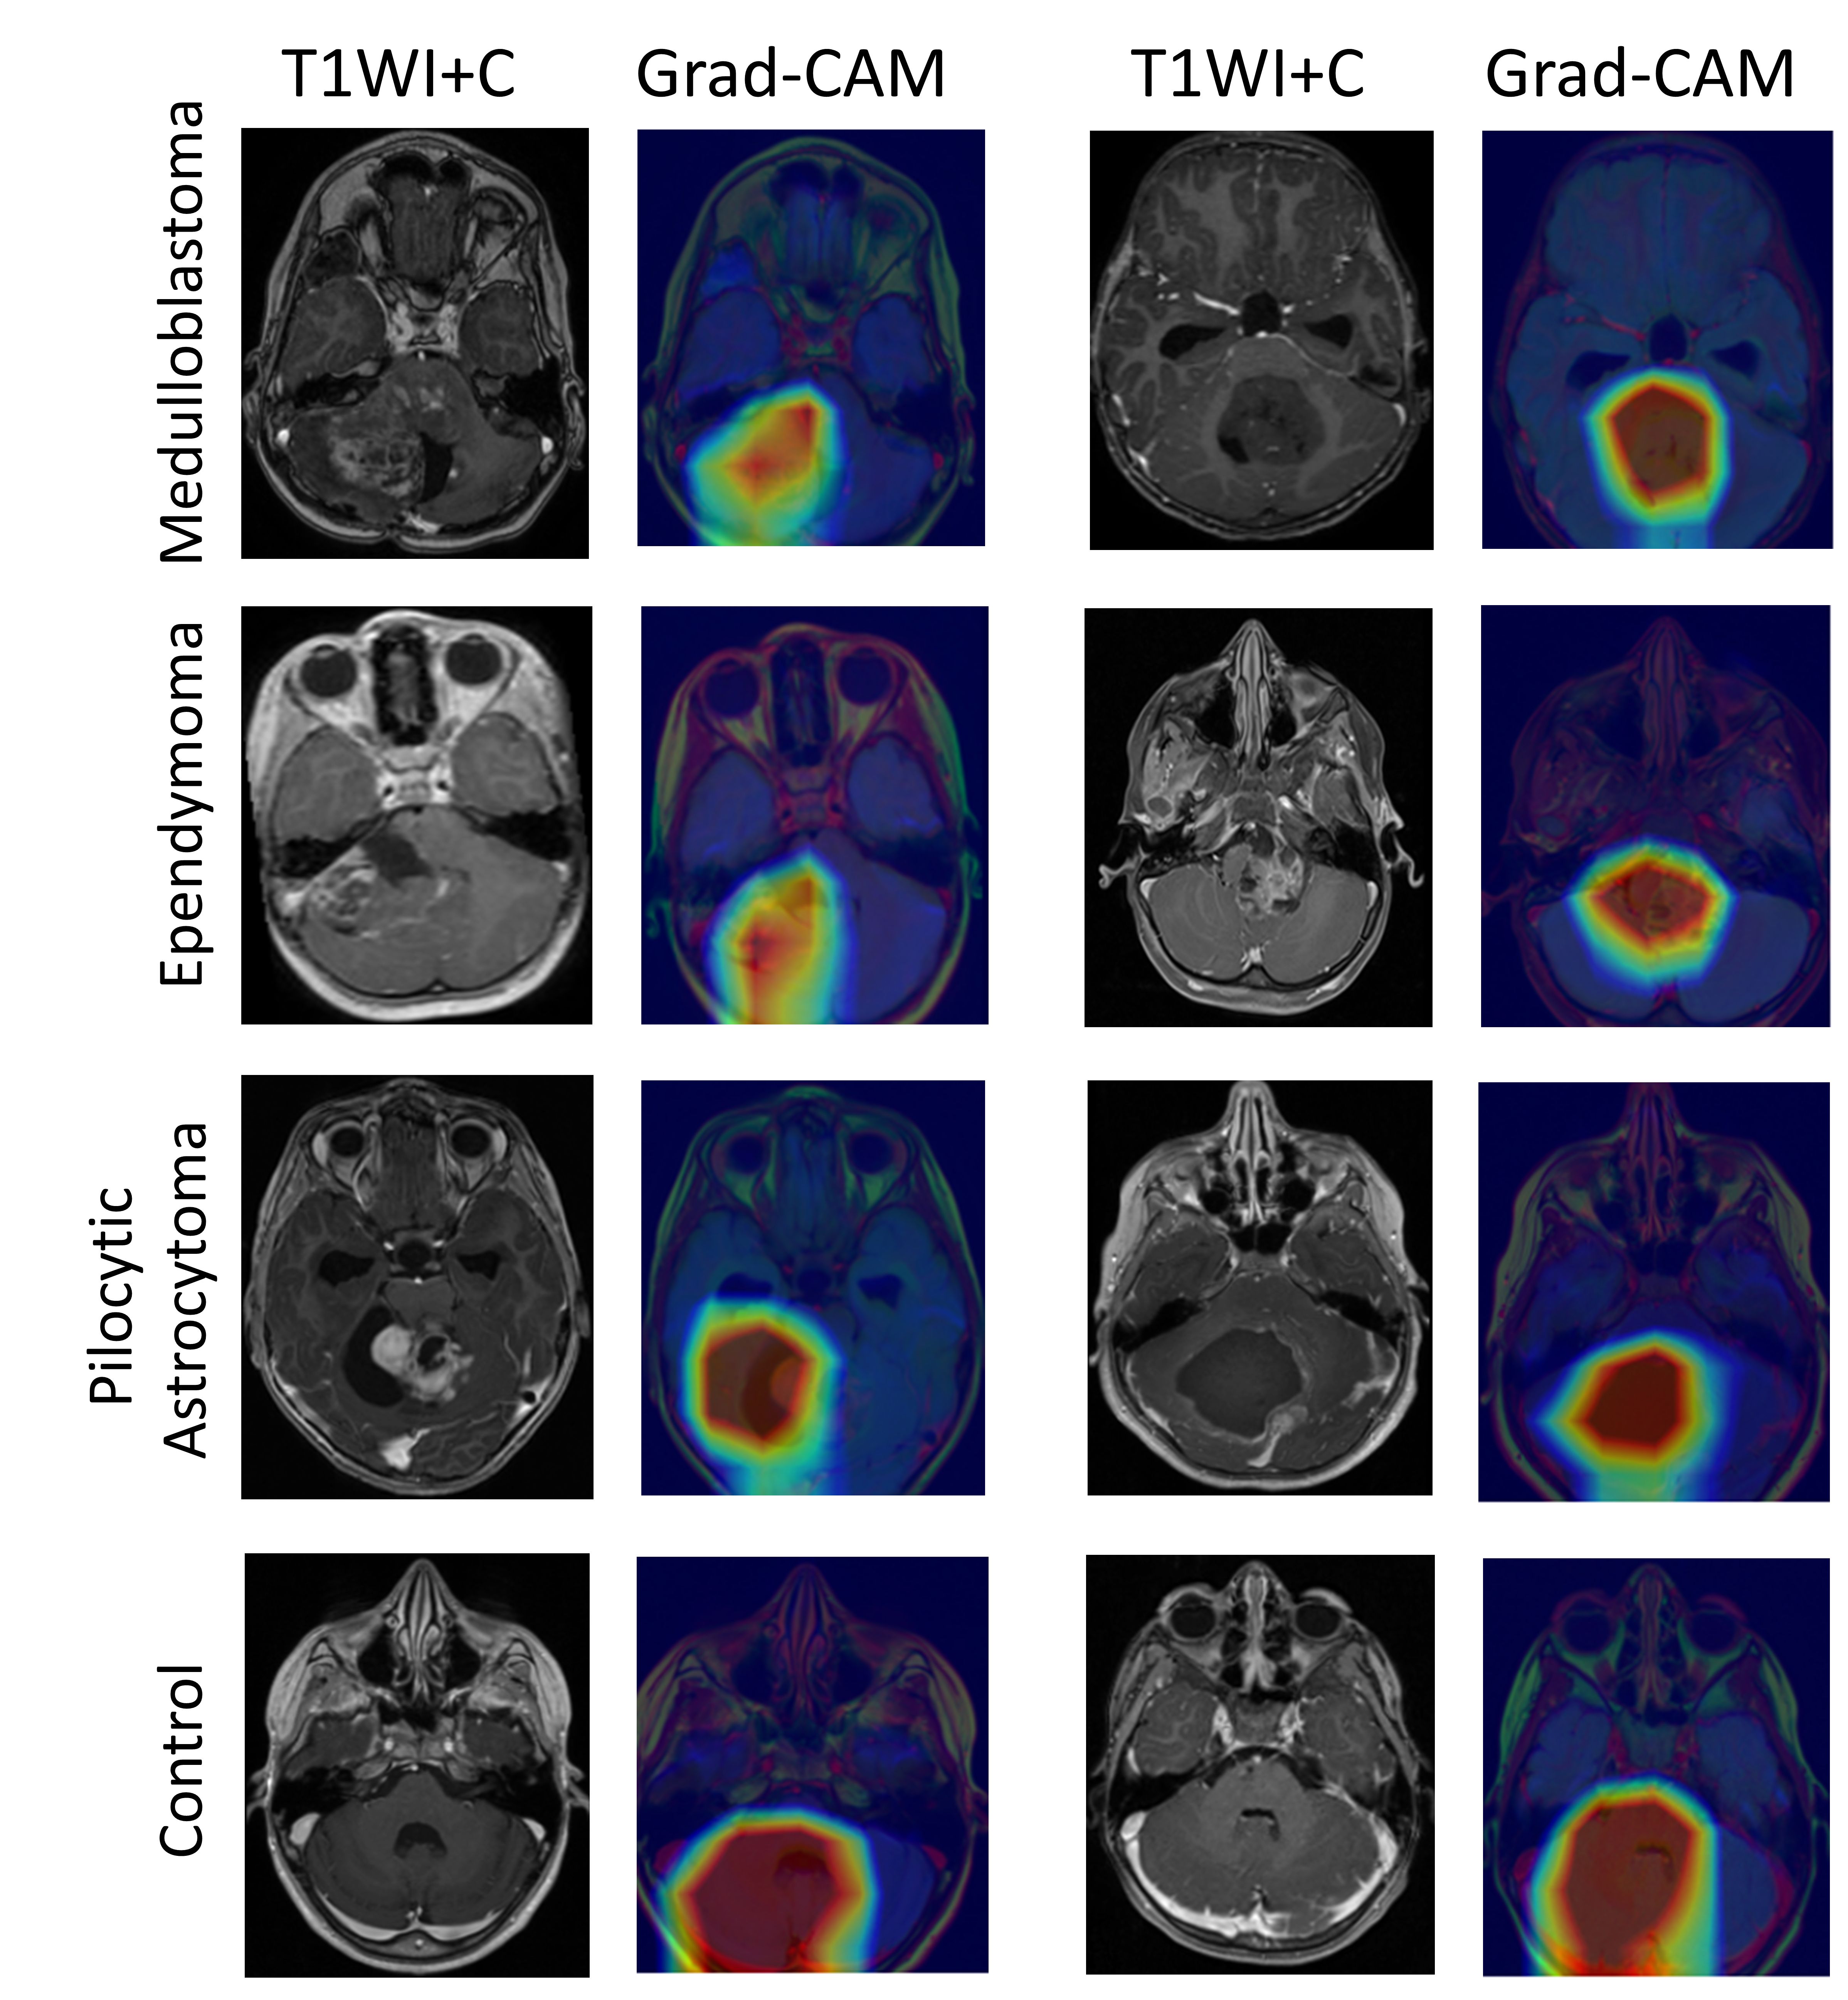
Figure 3 presents interpretation of the ResNet50 model based on Grad-CAM. All classes are activated at the posterior fossa region, for the three patient groups, the peak activation, i.e. pixels that are important for the model's classification decision, located at the tumoral area, while for the healthy (non-tumor) cases class a stronger, and more diffuse activation is shown, centered in the posterior fossa area. This result demonstrates that while the network received a 2D cross-sectional image of the entire brain, it learned to identify the area of interest and to establish the classification model based on the pathology related features.
Conclusion
In this study we proposed the used of fused CNN and tabular data architecture for the classification of pediatric PFT based on MRI data. The proposed architecture outperformed the performance of CNN alone. With current availability of medical imaging along with patients' metadata such as lab tests and different signal recording modalities, such an approach can be utilized to personalize clinical decision making and to improve patient care.Acknowledgements
No acknowledgement found.References
1. K. S. V. Prasad, D. Ravi, V. Pallikonda, and B. V. S. Raman, "Clinicopathological study of pediatric posterior fossa tumors," Journal of pediatric neurosciences, vol. 12, p. 245, 2017.
2. T. A. Huisman, "Posterior Fossa tumors in children: differential diagnosis and advanced imaging techniques," The neuroradiology journal, vol. 20, pp. 449-460, 2007.
3. T. E. Merchant, I. F. Pollack, and J. S. Loeffler, "Brain tumors across the age spectrum: biology, therapy, and late effects," in Seminars in radiation oncology, 2010, pp. 58-66.
4. W. S. McCulloch and W. Pitts, "A logical calculus of the ideas immanent in nervous activity," The bulletin of mathematical biophysics, vol. 5, pp. 115-133, 1943.
5. K. He, X. Zhang, S. Ren, and J. Sun, "Deep residual learning for image recognition," in Proceedings of the IEEE conference on computer vision and pattern recognition, 2016, pp. 770-778.
6. R. R. Selvaraju, M. Cogswell, A. Das, R. Vedantam, D. Parikh, and D. Batra, "Grad-cam: Visual explanations from deep networks via gradient-based localization," in Proceedings of the IEEE international conference on computer vision, 2017, pp. 618-626.
Figures