0597
Intensity Based Visualization of Pulmonary Function Using Time to Peak and Full Width at Half Max Biomarkers on Ultrashort Echo Time (UTE) MRI1Department of Computer Science, University of California, Berkeley, Berkeley, CA, United States, 2Department of Bioengineering, University of California, Berkeley - University of California, San Francisco, San Francisco, CA, United States, 3Department of Electrical Engineering and Computer Sciences, University of California, Berkeley, Berkeley, CA, United States, 4Department of Radiology and Biomedical Imaging, University of California, San Francisco, San Francisco, CA, United States
Synopsis
The visualization of respiratory inhalation-exhalation cycles are applied to pulmonary MR images. Using 3D UTE phase resolved MR Images, respiratory phases were reconstructed from free breathing images. Applying signal intensity based methods, biomarker metrics such as time to signal intensity peak (TTP) or full width at half maximum (FWHM) intensity are extracted from the image. The resulting visualizations depict localized respiratory function to help clinicians understand the rate and velocity at which lung tissue expands from full inspiration to full expiration.
Introduction
Current clinical pulmonary function tests include spirometry, which measures the amount and/or speed of air that can be inhaled and exhaled1. However, these tests cannot measure the pulmonary function of the left or right lung independently, only the total amount or speed of air inhaled and exhaled by both lungs. This motivates a localized approach, through signal intensity based biomarkers. 1H(proton) based imaging is an emerging candidate for pulmonary MR imaging as it provides both structural and functional characteristics in respiratory phase-resolved free breathing pulmonary MRI2. Advancements in phase-resolved MRI facilitates the separation of pulmonary respiratory cycles into distinct phases between inspiration and expiration3. In this study, the feasibility of time to peak (TTP) and full width half max (FWHM) to provide regional quantitative metrics regarding pulmonary function will be evaluated.Methods
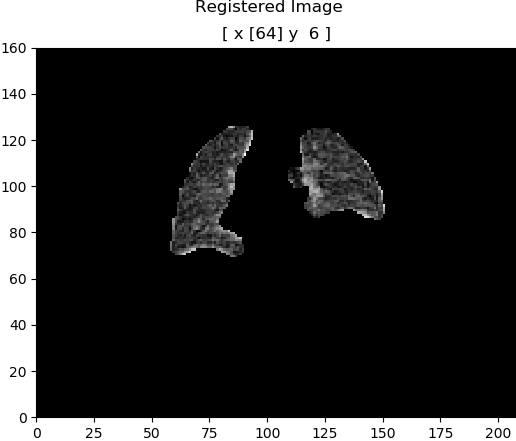
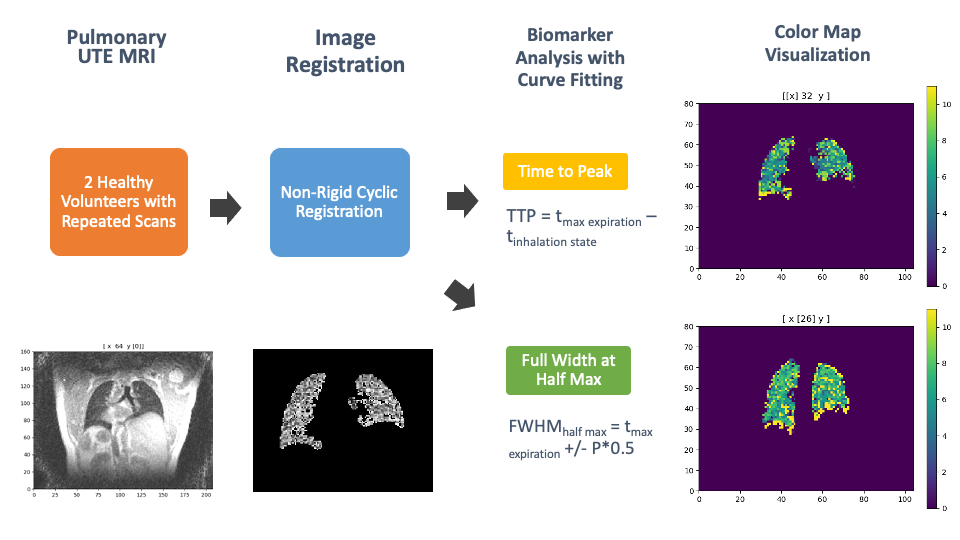
As shown in Figure 3, two healthy volunteers were recruited in this study to assess their pulmonary function in a free breathing exercise. Images were then acquired on a 3T MR750 clinical scanner (GE Healthcare, Waukesha, WI) with an 8-channel phased-array coil using 3D radial UTE sequences4. Each volunteer was scanned twice to verify the reproducibility of the biomarker metrics. From this data, self-navigating, phase-resolved reconstruction5 was applied to segment respiratory motion into twelve distinct phases. The non-rigid cyclic registration algorithm6 registered the respiratory states to the end expiratory state. A lung mask was then generated with the ANTsPyNet package7 with a morphology closing diameter of 3 voxels. The lung mask was then utilized to extract the 3D pulmonary image from the rest of the tissue. Since signal intensity values of pulmonary tissue varies with expansion and contraction between phases, we analyze signal intensities through a voxel-based approach. An image convolution was applied to generate voxels and reduce noise artifacts in the image. A fourth degree polynomial curve fitting model was applied to smooth intensity values in the respiratory phase direction. For calculating the TTP biomarker, the vertical position of the maximum signal intensity value correlated with the expiratory state is calculated. The difference between the maximum expiratory state and the inspiratory state constitutes TTP, defined as TTP = $$$t_{max\ expiration} - t_{inhalation\ state}$$$, where t is time in phase state. For the FWHM biomarker, the distance between two points where the function reaches half of its maximum value is calculated. Taking the difference between these two points yields the biomarker, FWHM = $$$ h_{half\ max,right} – h_{half\ max,left}$$$ where $$$h_{half\ max} = t_{max\ expiration} \pm P * 0.5$$$ and P is the peak’s prominence. A sample of the biomarker metric curve across the phase dimension of the image is provided in Figure 4 for time to peak and full width at half max, respectively.Results
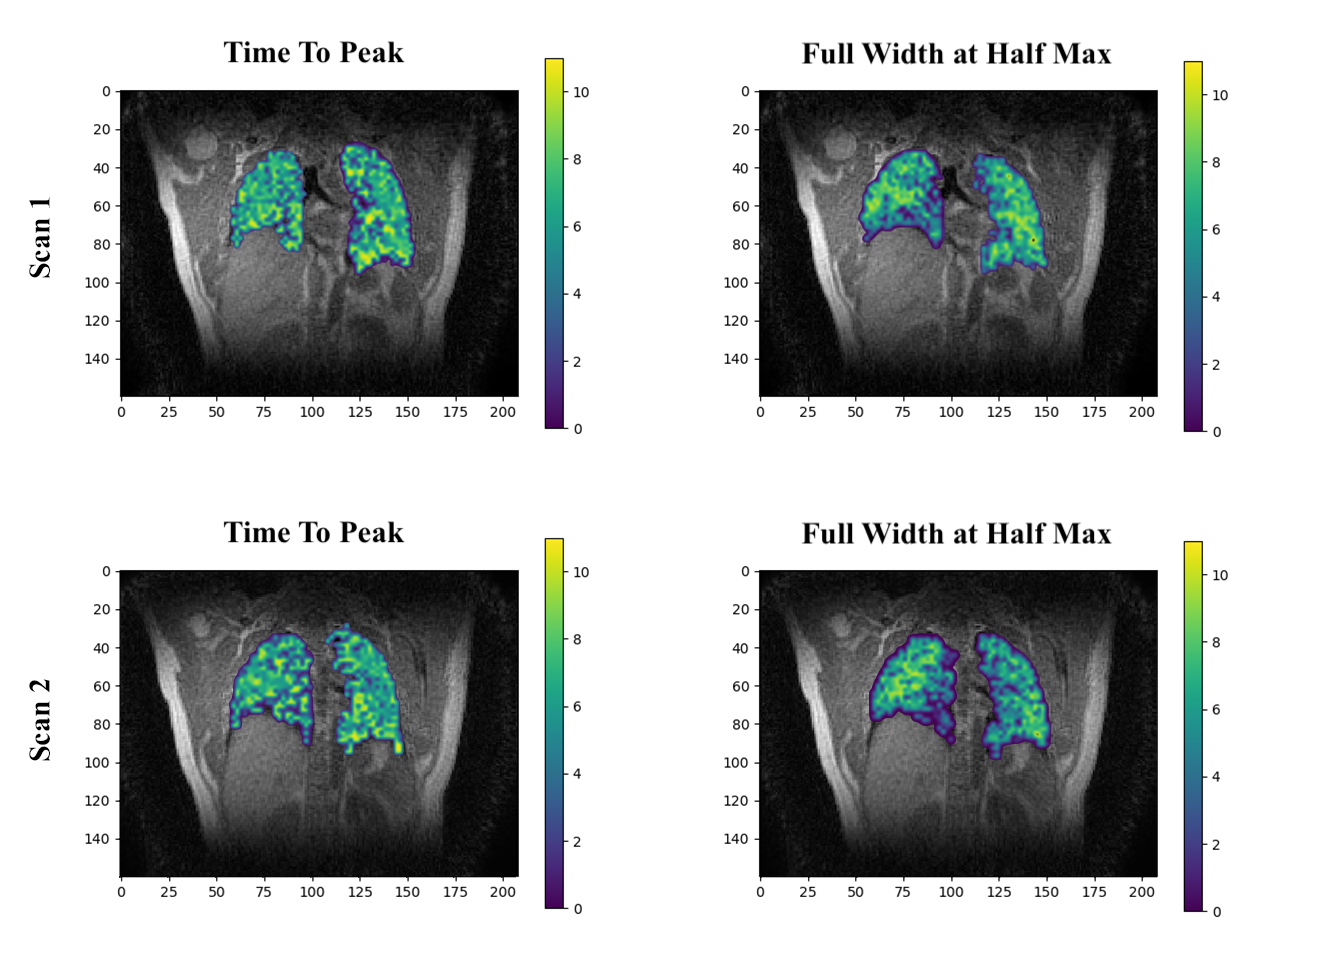
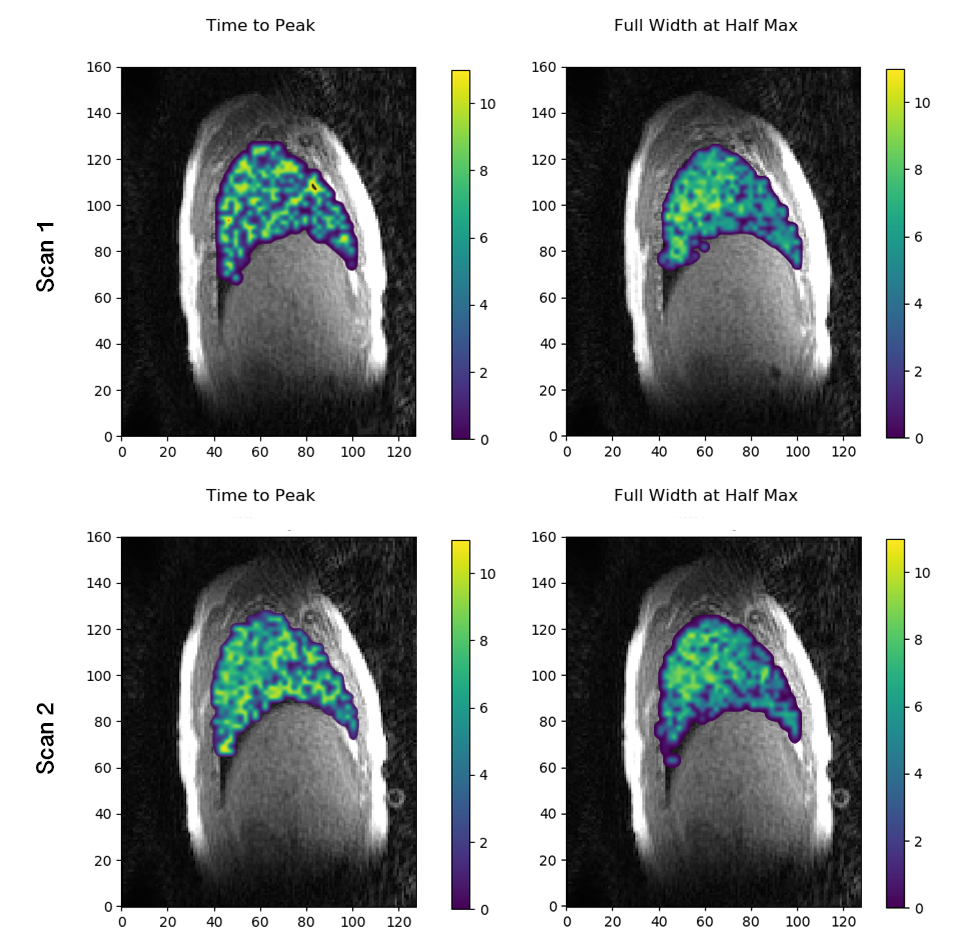
Each image below depicts two healthy volunteers with the TTP and FWHM biomarker, with a coronal plane slice in Figure 1 and a sagittal place slice in Figure 2. The images were reconstructed to twelve distinct phases, with zero and eleven corresponding to inhalation and five corresponding to exhalation. For the TTP biomarker, a value of five is to be expected as the fifth phase corresponds to exhalation, representing the highest signal intensity value. A value greater or less than five would indicate abnormal respiratory behavior. For the FWHM biomarker, a value of six is expected, as it would capture the phases before and after full exhalation. The results in Figure 1 and Figure 2 match the predicted results of homogeneous ventilation throughout the lungs in these healthy subjects. Furthermore, repeated scans of each healthy volunteer confirmed the reproducibility of the biomarker metrics. There was minimal deviation of the biomarker metrics between the repeated scans of each volunteer as shown in Figures 1-2.Conclusion
This study shows the feasibility of utilizing intensity based biomarkers to provide quantitative insight into regional pulmonary function. The TTP biomarker likely reflects the rate at which lung tissue expands from the full inspiration to full expiration phase. The FWHM biomarker depicts the velocity of the tissue expansion from inspiration to expiration, as it describes the width of the signal intensity peak. Further studies of patients with cystic fibrosis or chronic obstructive pulmonary disease (COPD) can determine the efficacy of these results.Acknowledgements
No acknowledgement found.References
1. Ranu H, Wilde M, Madden B. Pulmonary function tests. Ulster Med J. 2011;80(2):84-90.
2. Biederer J, Beer M, Hirsch W, et al. MRI of the lung (2/3). Why... when ... how? Insights Imaging 2012;3:355–371 doi: 10.1007/s13244-011-0146-8.
3. Jiang W, Ong F, Johnson KM, et al. Motion robust high resolution 3D free-breathing pulmonary MRI using dynamic 3D image self-navigator. Magn. Reson. Med. 2018;79:2954– 2967 doi: 10.1002/mrm.26958.
4. Johnson KM, Fain SB, Schiebler ML, Nagle S. Optimized 3D ultrashort echo time pulmonary MRI. Magn. Reson. Med. 2013;70:1241–1250 doi: 10.1002/mrm.24570.
5. Fei Tan, Xucheng Zhu, and Peder E. Z. Larson. Dynamic 3D Ventilation Maps with Phase- Resolved Ultrashort Echo Time (UTE) MRI. ISMRM 2020 Proceedings, 2298
6. Metz CT, Klein S, Schaap M, van Walsum T, Niessen WJ. Nonrigid registration of dynamic medical imaging data using nD + t B-splines and a groupwise optimization approach. Med Image Anal. 2011;15(2):238-249. doi:10.1016/j.media.2010.10.003
7. Tustison, N J., Cook, P A., et al. ANTsX: A dynamic ecosystem for quantitative biological and medical imaging. MedRxiv, Cold Spring Harbor Laboratory Press, 2020.10.19.20215392, doi: 10.1101/2020.10.19.20215392.
Figures
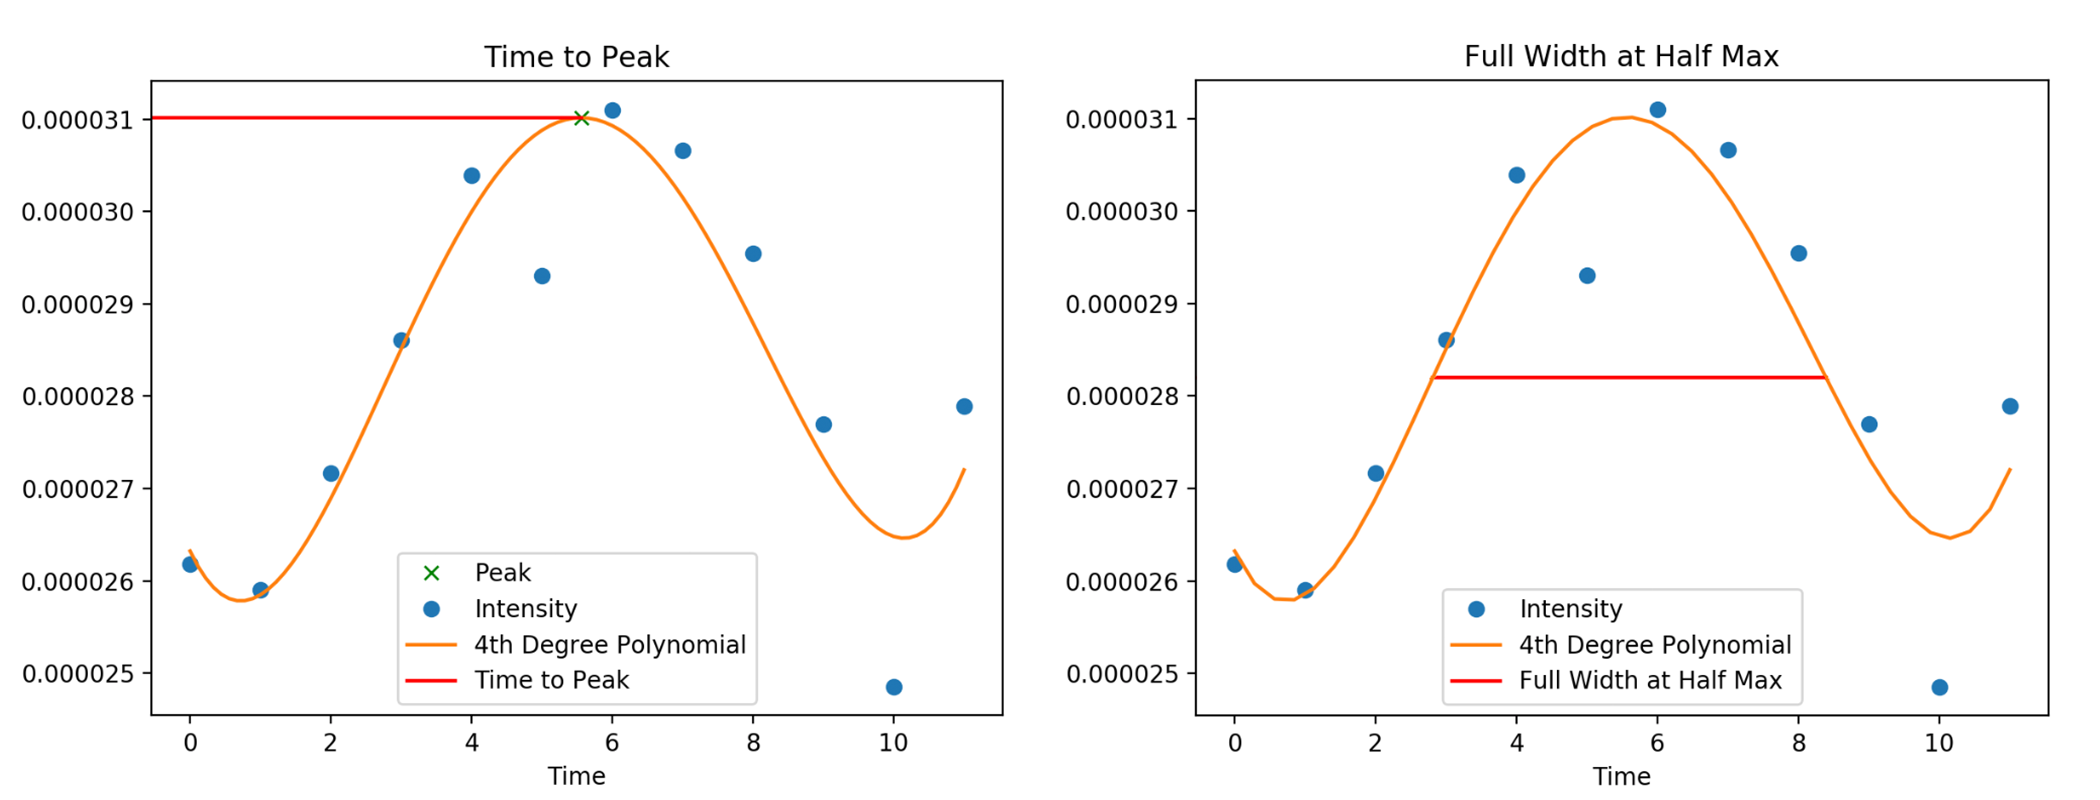
A sample of the Time to Peak (TTP) and Full Width at Half Max (FWHM) biomarker metric on the left and right, respectively. Each point represents an intensity value observation across the phase dimension of the image. The intensity values peak at the exhalation phase (phase 5), representing the highest signal intensity value. Phases 0 and 11 correspond to inhalation, with the lowest signal intensity values. Here, a TTP metric of 5.4 and FWHM of 5.8 is observed.