0595
One-year follow-up of functional lung MRI in children with cystic fibrosis1Division of Pediatric Respiratory Medicine, Department of Pediatrics,, Inselspital, Bern University Hospital, University of Bern, Switzerland, Bern, Switzerland, 2Division of Radiological Physics, Department of Radiology, University of Basel Hospital Basel, Basel, Switzerland, Basel, Switzerland, 3Department of Biomedical Engineering, University of Basel, Basel, Switzerland, Basel, Switzerland
Synopsis
Matrix Pencil MRI in cystic fibrosis is a sensitive and promising technique to monitor progression of lung disease, and is especially well-suited for children. In this work, we investigate the agreement between changes in functional lung MRI and in lung function tests during a 1-year follow-up period. We demonstrate the benefit of imaging to interpret changes in lung function correctly.
Introduction
Cystic fibrosis (CF) patients face limited life expectancy due to progressive lung disease. Therefore, monitoring lung function is essential to reduce morbidity and mortality. Advances in treatment have improved survival and require new and sensitive outcome measures for detection of mild changes. The Lung clearance index (LCI) is a lung function test for sensitive monitoring of ventilation inhomogeneity, but lacks spatial information. Specialized proton based MR techniques for functional lung imaging, such as matrix pencil (MP) MRI (1, 2), PREFUL (3) and SENCEFUL (4), have recently shown promising results in detecting local ventilation and perfusion deficits in patients with CF (5). To date, longitudinal follow-up with functional MRI was only investigated with hyperpolarized gas MRI and is lacking for MP-MRI (6, 7). Our aim was to evaluate changes in functional lung MRI and lung function after 12 months follow up in pediatric patients with CF.Methods
This ongoing study includes data from 31 children with CF and was approved by local ethics committee. After baseline visit (=t0) patients were measured again 12 (± 4) months later (=t1). Patients were in stable clinical conditions at examination. FEV1 and LCI were measured from spirometry and N2 multiple breath washout, respectively. Lung function was performed and quality controlled according to guidelines. MR Data Functional imaging with MP-MRI (1) scans, consisted of time-resolved 2D coronal acquisitions using ultra-fast steady state free precession during 50 seconds of free breathing at 1.5T (8). After specific deformable image registration (9) a neural network is employed on the base image for lung parenchyma segmentation (10). Subsequently, a Matrix-Pencil algorithm computes perfusion- and ventilation-weighted maps of the lung (11). The ventilation defect percentage (VDP) and perfusion defect percentage (QDP) are defined as ventilation and perfusion signal lower than 75% of the lung median values. Data Analysis Primary outcomes were VDP, QDP, LCI and FEV1 and the change between t0 and t1 (delta). First, we investigated if t0 and t1 systematically differ with paired t-test. Then, we calculated the delta for each outcome and assessed the correlation between them. For correlation, we used spearman correlation coefficients. For statistical calculations, we used Stata™ (StataCorp. 2015, Release 15. College Station, TX: StataCorp LP).Results
MRI was successfully acquired in all 31 patients. Baseline LCI was complete in 26 subjects, from whom 24 achieved good-quality LCI at follow-up. Similar with spirometry, 26 measurements had good-quality baseline, from whom 25 had complete data at follow-up. Overall, 21 Patients had complete MRI, LCI and FEV1 data. Mean age at baseline (±SD, range) was 10.6 years (±3.6; 3.6-17.7). Mean follow-up time was 13.1 months (±2.4; 9.2-17.3). At baseline, the percentage of abnormal test results were 27% for FEV1, 73% for LCI, 36% for VDP and 45% for QDP, respectively. At follow-up, it was 28% for FEV1, 86% for LCI, 42% for VDP and 61% for QDP. There was a tendency towards worsening between baseline and follow-up for all outcome measures, but this was not statistically significant (Figure 1). Figure 2 and 3 show the correlation for delta-VDP with delta-LCI and delta-FEV1, respectively. The delta-VDP was correlated moderately to delta-LCI with r:0.47, p<0.05 and delta-FEV1 with r:-0.63, p<0.01. Delta-QDP was correlated moderately to delta-LCI (r:0.37, p=0.1), delta-FEV1 (r:-0.33, p=0.13) and strongly to delta-VDP (r:0.76, p<0.001). Delta-LCI was correlated weakly to delta-FEV1 (r:-0.27, p=0.24). Two exemplary cases where changes in VDP and changes in LCI were not congruent are shown in Figure 4.Discussion
The changes in lung function over one year are mild and homogeneous, and best depicted by LCI and MP-MRI outcomes. In the majority of patients, changes in MP-MRI and lung function are congruent. However, there are few patients with incongruent changes (see figure 4). In these cases, functional imaging helps to understand and interpret lung function changes.Acknowledgements
No acknowledgement found.References
1. Nyilas S, Bauman G, Pusterla O, Ramsey K, Singer F, Stranzinger E, et al. Ventilation and perfusion assessed by functional MRI in children with CF: reproducibility in comparison to lung function. Journal of cystic fibrosis : official journal of the European Cystic Fibrosis Society. 2018.
2. Nyilas S, Bauman G, Sommer G, Stranzinger E, Pusterla O, Frey U, et al. Novel magnetic resonance technique for functional imaging of cystic fibrosis lung disease. The European respiratory journal. 2017;50(6).
3. Voskrebenzev A, Gutberlet M, Klimes F, Kaireit TF, Schonfeld C, Rotarmel A, et al. Feasibility of quantitative regional ventilation and perfusion mapping with phase-resolved functional lung (PREFUL) MRI in healthy volunteers and COPD, CTEPH, and CF patients. Magnetic resonance in medicine. 2018;79(4):2306-14.
4. Veldhoen S, Weng AM, Knapp J, Kunz AS, Stab D, Wirth C, et al. Self-gated Non-Contrast-enhanced Functional Lung MR Imaging for Quantitative Ventilation Assessment in Patients with Cystic Fibrosis. Radiology. 2017;283(1):242-51.
5. Guo F, Capaldi DPI, McCormack DG, Fenster A, Parraga G. A framework for Fourier-decomposition free-breathing pulmonary (1) H MRI ventilation measurements. Magnetic resonance in medicine. 2018.
6. Smith L, Marshall H, Aldag I, Horn F, Collier G, Hughes D, et al. Longitudinal Assessment of Children with Mild Cystic Fibrosis Using Hyperpolarized Gas Lung Magnetic Resonance Imaging and Lung Clearance Index. American journal of respiratory and critical care medicine. 2018;197(3):397-400. 7. Smith LJ, Horsley A, Bray J, Hughes PJC, Biancardi A, Norquay G, et al. The assessment of short and long term changes in lung function in CF using <sup>129</sup>Xe MRI. European Respiratory Journal. 2020:2000441.
8. Bieri O. Ultra-fast steady state free precession and its application to in vivo (1)H morphological and functional lung imaging at 1.5 tesla. Magnetic resonance in medicine. 2013;70(3):657-63.
9. Sandkühler R, Jud C, Pezold S, Cattin PC, editors. Adaptive Graph Diffusion Regularisation for Discontinuity Preserving Image Registration. 8th International Workshop on Biomedical Image Registration (WBIR); 2018: Springer International Publishing.
10. Willers C, Bauman G, Andermatt S, Santini F, Sandkühler R, Ramsey KA, et al. The impact of segmentation on whole-lung functional MRI quantification: Repeatability and reproducibility from multiple human observers and an artificial neural network. Magnetic resonance in medicine. 2021;85(2):1079-92.
11. Bauman G, Bieri O. Matrix pencil decomposition of time-resolved proton MRI for robust and improved assessment of pulmonary ventilation and perfusion. Magnetic resonance in medicine. 2017;77(1):336-42.
Figures
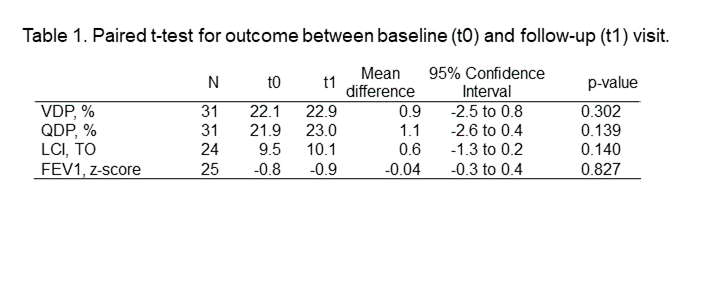
Table 1. Paired t-test for outcome between baseline (t0) and follow-up (t1) visit.
Note. – VDP: ventilation defect percentage; LCI: Lung clearance index; FEV1: forced expiratory volume in one secon
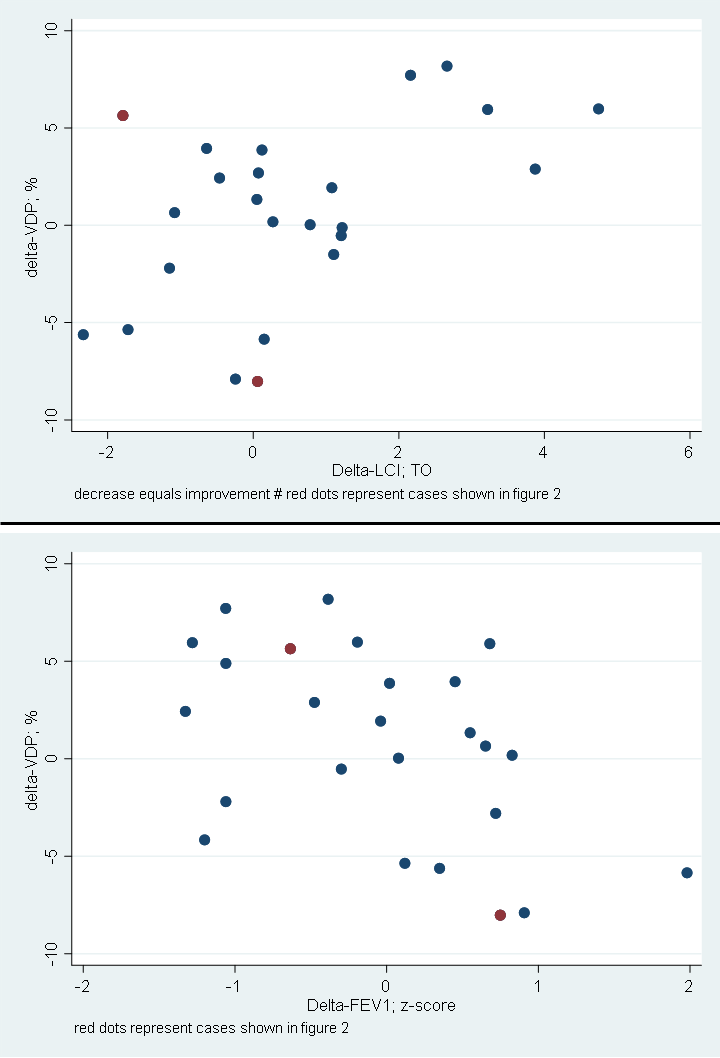
Figure 2. Scatter plot of delta-VDP with delta-LCI (top) and delta-FEV1 (bottom). An overall good correlation is visible, despite a few outliers. Two of these outliers (marked in red) are demonstrated in Figure 3.
Note. – VDP: ventilation defect percentage; LCI: Lung clearance index; FEV1: forced expiratory volume in one second
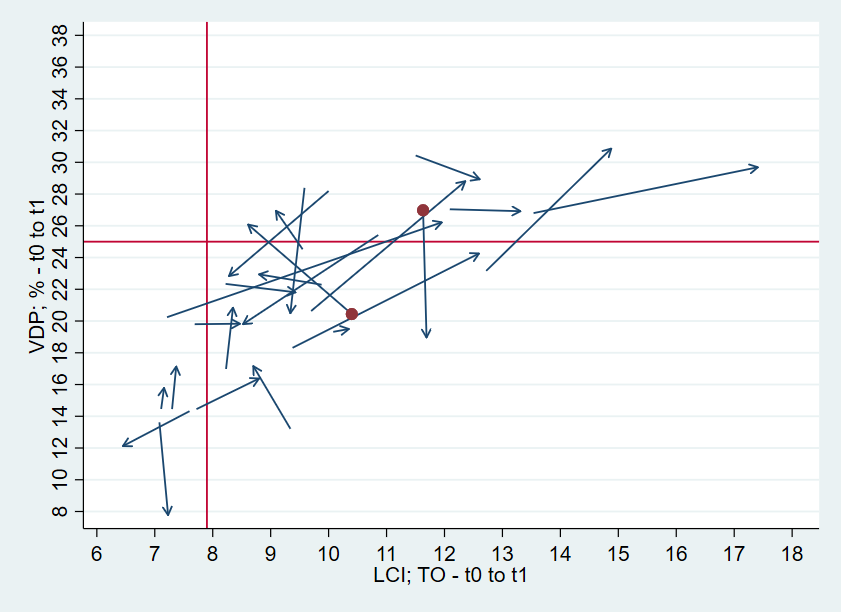
Figure 3. Arrow plot of baseline LCI (x-axis) and VDP (y-axis) to follow-up LCI and VDP. Redline marks the upper limit of normality. The arrow points from baseline to follow-up. Overall good agreement in the delta-VDP and delta-LCI is visible. Two outliers are marked as red dots and are shown in figure 4.
Note. – VDP: ventilation defect percentage; LCI: Lung clearance index
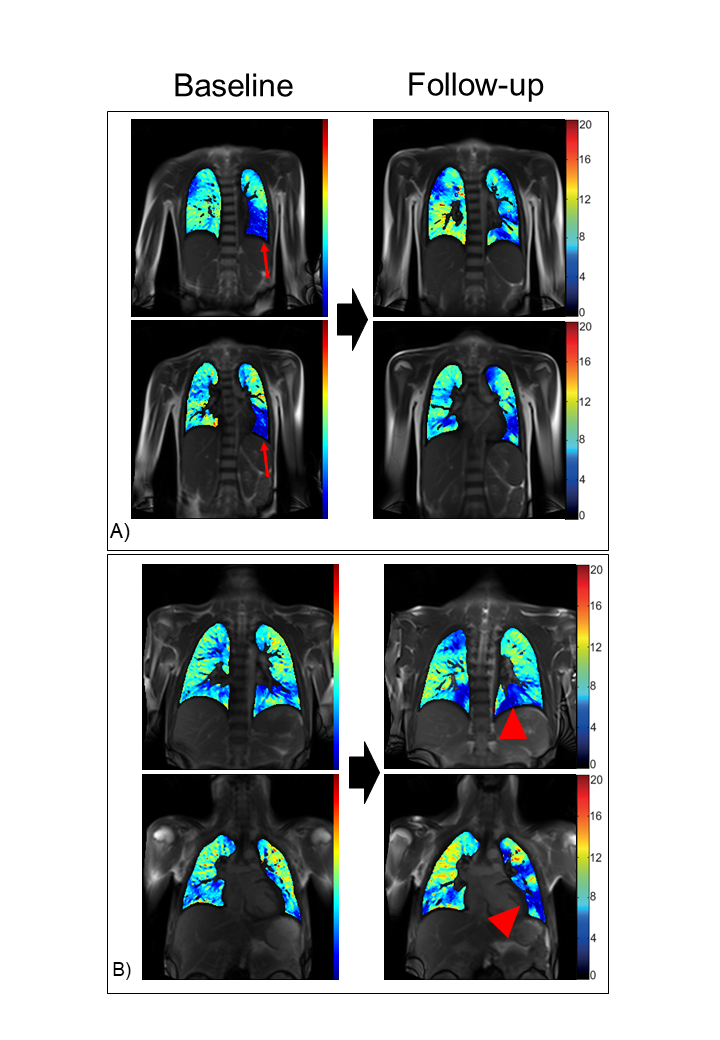
Figure 4. Case examples with impeded correlation between Delta-VDP and Delta-LCI. (See red dots in figure 2 and 3)
A) At baseline a large ventilation defect, due to mucus plugging is visible (red arrow). At 14 months follow-up, the VDP has reduced, but LCI stayed stable. Baseline (delta) FEV1: -1.7 (+0.9), LCI: 9.6 (-0.2), VDP: 28.4% (-7.9).
B) At follow-up, an increased VDP is visible (red arrowhead). The LCI decreased (improved). Due to possibly more mucus plugging the LCI is “blind” to closed lung areas. Baseline (delta) FEV1, z-score: -0.1 (-0.7), LCI: 10.4 (-1.8), VDP: 20.4% (+5.6).