0594
M0 and T1 mapping for differentiation of perfusion defects in patients with CTEPH and CTED.1Infection Immunity and Cardiovascular Disease, University of Sheffield, Sheffield, United Kingdom, 2Sheffield Pulmonary Vascular Disease Unit, Sheffield, United Kingdom
Synopsis
Identifying the cause of lung perfusion defects is vital for chronic thromboembolic pulmonary hypertension (CTEPH) or chronic thromboembolic disease (CTED) diagnosis. 30 patients with suspected CTEPH underwent Look-Locker M0 and T1 mapping, 16/30 were diagnosed with CTEPH or CTED. Co-registered peak perfusion maps were used to identify perfusion defects. T1 was significantly lower in perfusion defects in all patients. Patients with CTEPH or CTED had significantly lower M0 in non-perfused lung, whereas control patients did not have significantly differences between perfused and non-perfused lung. Lung M0 maps may allow differentiation of perfusion defects in patients with CTEPH/CTED from other patients.
Introduction
Chronic thromboembolic disease (CTED) occurs when the pulmonary arteries are blocked by scar tissue which forms around a pulmonary embolism. This often leads to elevated pulmonary arterial pressure, causing chronic thromboembolic pulmonary hypertension (CTEPH). Diagnosis of CTED or CTEPH (CTEPH/CTED) requires visualisation of lung ventilation and perfusion, typically performed using scintigraphy, however MR imaging is increasingly being explored as an alternative[2, 3].Lung T1 is sensitive to lung perfusion and lung tissue[1, 4] and has been shown to correlate with disease severity and lung perfusion deficits in COPD[5], lung perfusion defect score in cystic fibrosis[4].
The calculation of T1 maps also produces maps of equilibrium magnetisation (M0), where M0 is proportional to proton density and magnetic field strength. Including M0 maps into analysis may increase specificity of T1 maps by providing a measure that is sensitive to lung density.
The aim of this work is to evaluate whether lung T1 and M0 can identify reduced lung perfusion and differentiate perfusion defects in patients with CTEPH/CTED from perfusion defects in patients without CTEPH/CTED.
Methods
30 patients with suspected CTEPH underwent 1.5T MRI (HDx scanner, GE Healthcare) using an 8-channel cardiac coil in supine position. Patients received the following diagnoses: CTEPH/CTED: 16/30; PH due to lung disease (COPD): 3/30; pulmonary arterial hypertension (PAH): 2/30; no pulmonary hypertension or CTED diagnosis: 9/30.T1 and M0 maps were acquired using 5 coronal 2D Look-Locker inversion recovery slices[6, 7] positioned through the descending aorta. Images were averaged over the 5 acquisitions to increase the image SNR. Acquisition parameters: repetition time (TR): 3.2 ms; TE: 0.9 ms; flip angle: 7°; phase × frequency: 64×128; slice thickness: 15 mm; pixel bandwidth: 244.14 kHz; FOV: 440 mm2; overall acquisition time = 7s.
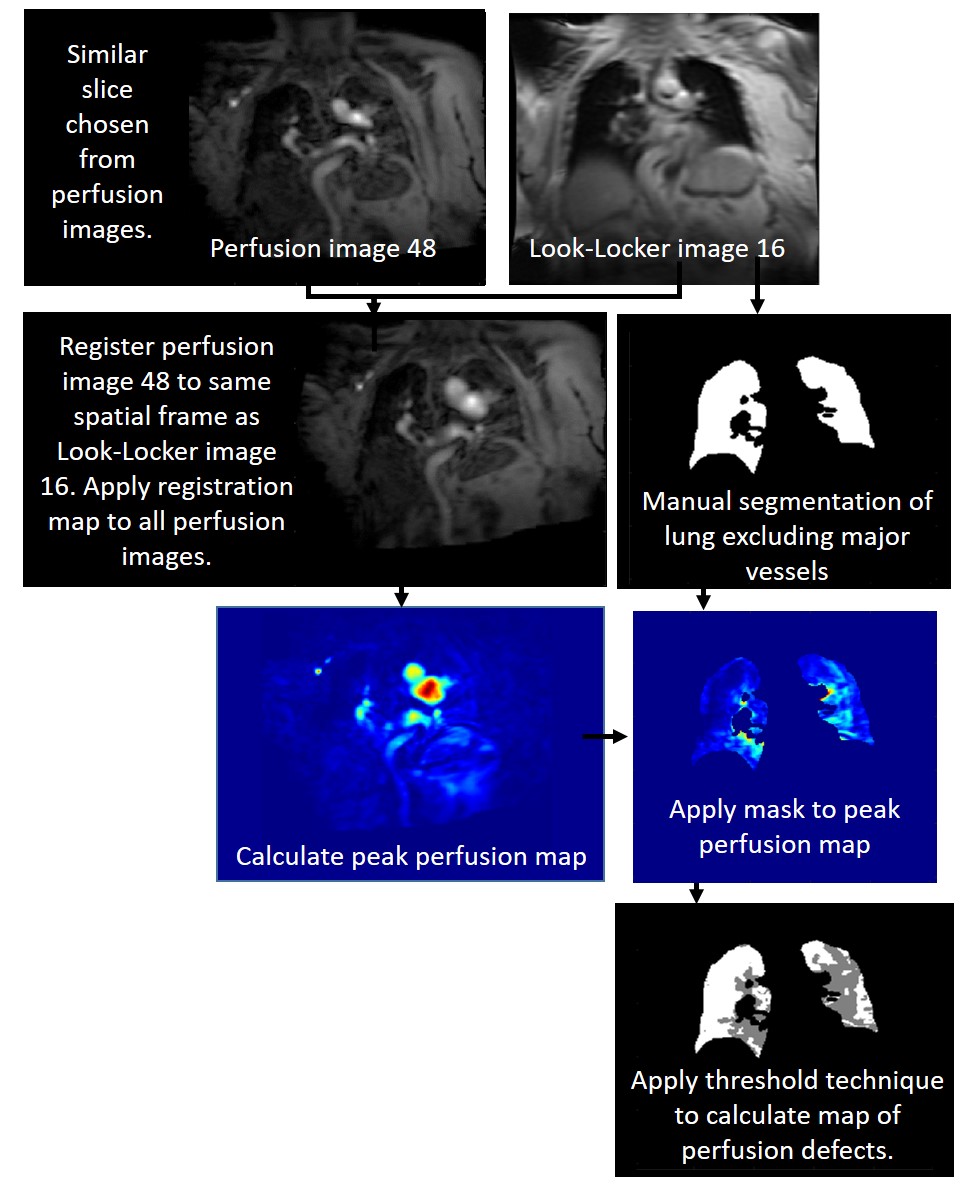
3D DCE perfusion images were acquired after the administration of 0.05ml/kg of Gadolinium-DTPA (Gadovist) at a rate of 4ml per second. Acquisition parameters were: TR: 2.1ms; TE: 0.7ms; FA 30°; phase x frequency: 120x80; slice thickness: 10mm; FOV: 480mm2; phases: 48; temporal resolution: ~0.5s. Peak perfusion maps were produced from the maximum signal for each pixel.
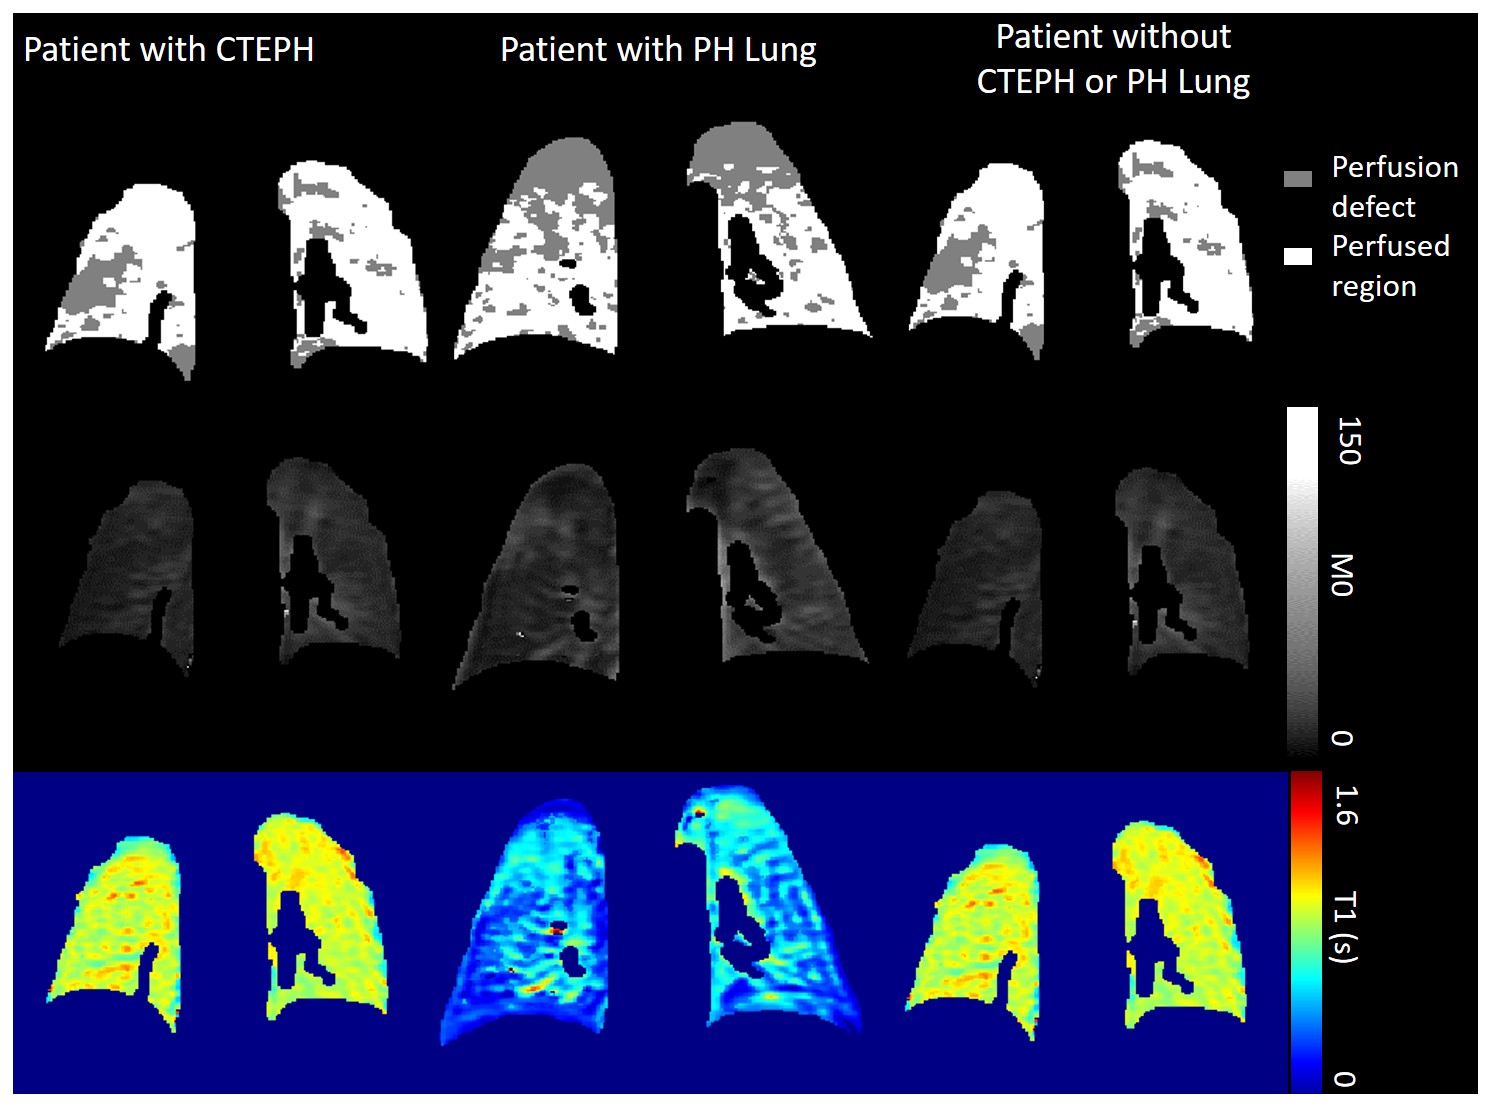
Perfusion images were registered to the Look-Locker images using deformable image transformations (Figure 1)[8]. Images were visually inspected to ensure good registration was achieved. Peak perfusion maps were automatically segmented into perfused and non-perfused areas using a global image threshold using Otsu’s method. Perfused region and non-perfused region segmentations were applied to the calculated lung T1 and M0 maps (Figure 2) and median T1 and M0 was calculated. Lung pixels whose maximum signal was below mean noise+1.5 standard deviations were excluded from all calculations.
For analysis, patients were grouped into patients with CTEPH/CTED and controls (patients without a CTEPH/CTED diagnosis). A secondary analysis was performed with patients with PH lung separated into a third patient group. Median lung T1 and M0 in perfused and non-perfused regions were compared using a paired t-test in patients with CTEPH/ CTED, and controls. Differences in variables between patient groups were calculated using either an independent samples t-test or a one-way ANOVA.
Results
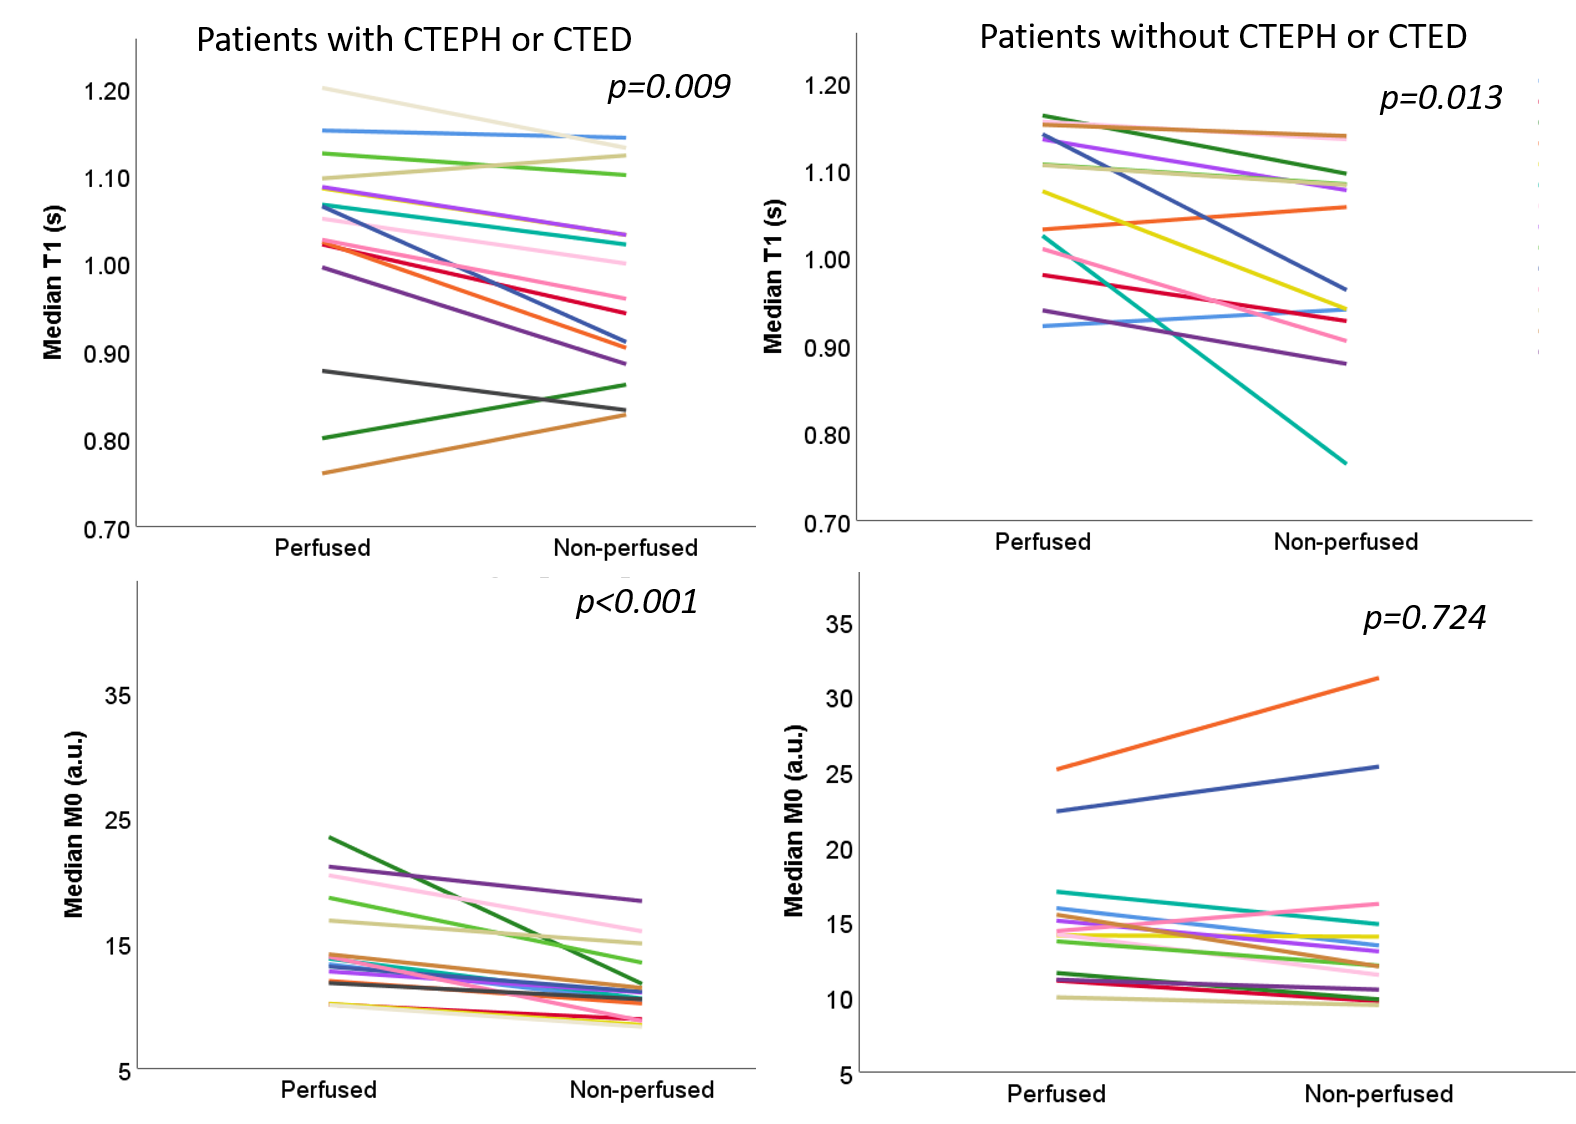
The percentage of the lung classified as perfused was not significantly different between patients with CTEPH/CTED and controls (p=0.060). In patients with CTEPH/CTED and controls T1 was significantly lower in non-perfused regions than perfused regions (p=0.009 and p=0.007 respectively). M0 was significantly lower in patients with CTEPH or CTED in non-perfused regions (p<0.001), whereas in controls there was no significant difference in M0 (p=0.425) (Figure 3).∆M0 (M0perfused – M0non-perfused) was significantly higher in patients with CTEPH or CTED than controls (CTEPH/CTED: ∆M0 = 3.2±2.6 a.u; controls: ∆M0 = 0.6 ±2.6 a.u., p=0.010). ∆T1 was not significantly different between patient groups (p=0.390). There were no other significant differences between patients with CTEPH/CTED and controls.
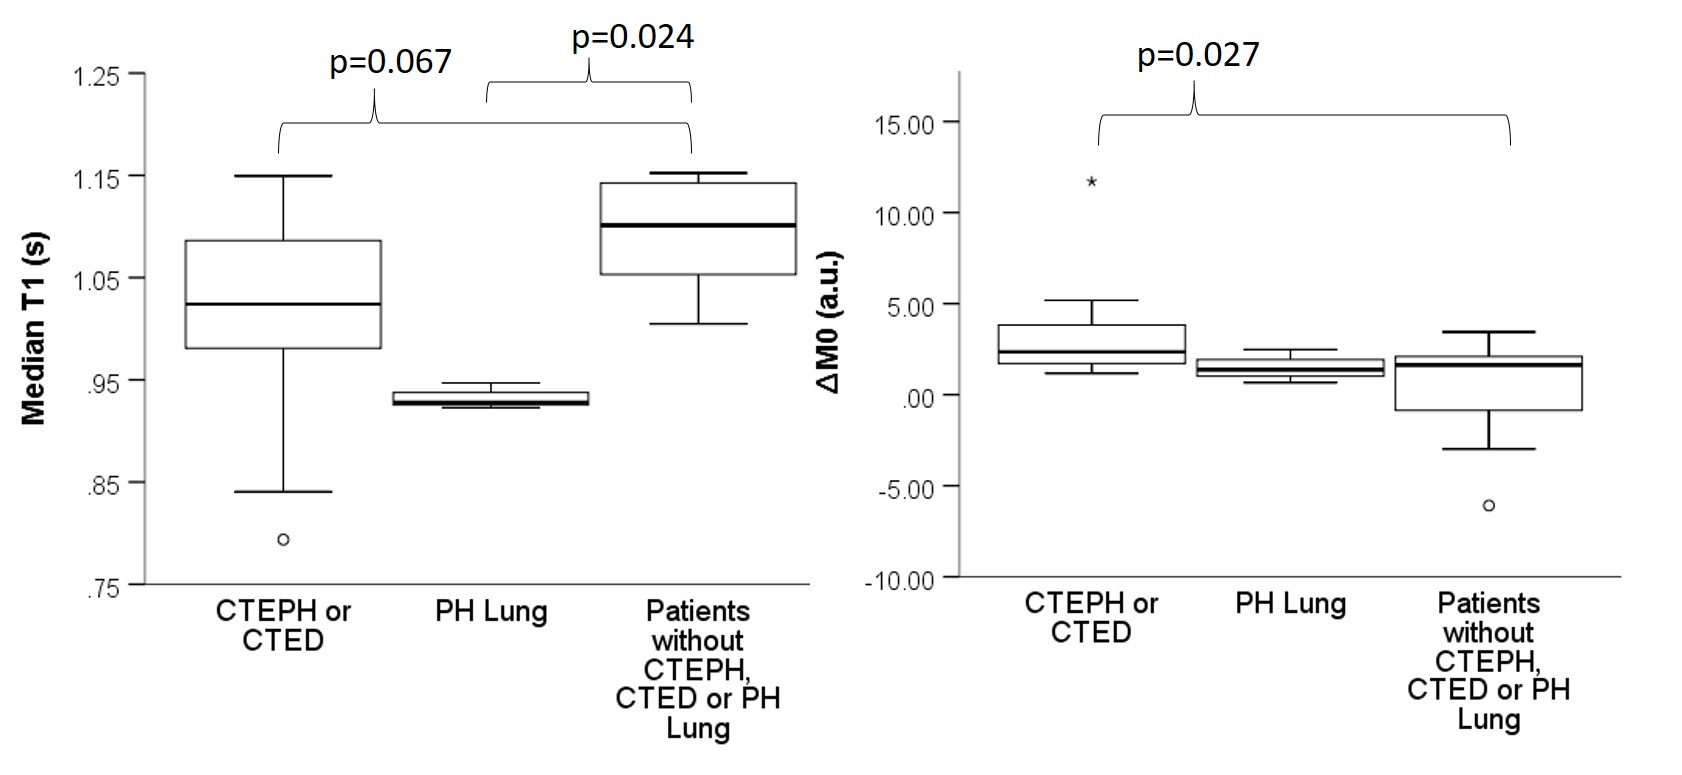
When patients with PH lung were considered as a separate patient group, median lung T1 was significantly lower in patients with PH-lung than in controls (p=0.024) (figure 4). Mean M0 was not significantly different between patient groups. Patients with CTEPH/CTED had significantly higher ∆M0 than patients without CTEPH/CTED.
For all patients, the percentage of the lung that was found to be perfused (% perfused) correlated positively with median lung M0 (r=0.616, p<0.001). Median lung T1 did not correlate with % perfused (r=0.296, p=-0.112) or median M0 (r=0.095, p=0.618).
Discussion
In patients with CTEPH/CTED M0 significantly decreased in poorly perfused areas whereas in controls M0 was not significantly different in poorly perfused areas. The acquisition of M0 maps during an MRI exam may help differentiate perfusion defects due to CTEPH/CTED from perfusion defects due to other conditions.Lung T1 and M0 maps may assist in differentiating patients with CTEPH/CTED from patients with perfusion defects due to other conditions. Low M0 in perfusion defects may indicated CTEPH/CTED, whereas low lung T1 across the lung may indicate lung disease.
Conclusion
Patient M0 and T1 maps provide complimentary information about lung pathology. Perfusion defects in patients with CTEPH/CTED had decreased M0, whereas controls had no significant differences in M0 between perfused and non-perfused regions. Low M0 in regions of poor perfusion may indicated CTEPH or CTED. Low T1 across the lung may indicate PH-lung.Acknowledgements
This work was supported by MRC grant MR/M008894/1 and Wellcome Trust grant: 205188/Z/16/Z. The views expressed in this work are those of the author(s) and not necessarily those of the NHS, or the Department of Health.References
1. Triphan, S.M., et al., Echo time dependence of observed T1 in the human lung. J Magn Reson Imaging, 2015. 42(3): p. 610-6.
2. Johns, C.S., et al., Lung Perfusion: MRI vs. SPECT for Screening in Suspected Chronic Thromboembolic Pulmonary Hypertension. Journal of Magnetic Resonance Imaging, 2017. 46(6): p. 1693-1697.
3. Lasch, F., et al., Comparison of MRI and VQ-SPECT as a Screening Test for Patients With Suspected CTEPH: CHANGE-MRI Study Design and Rationale. Front Cardiovasc Med, 2020. 7: p. 51. 4. Triphan, S.M.F., et al., Echo Time-Dependence of Observed Lung T1 in Patients With Cystic Fibrosis and Correlation With Clinical Metrics. J Magn Reson Imaging, 2020: p. e27271.
5. Jobst, B.J., et al., Functional lung MRI in chronic obstructive pulmonary disease: comparison of T1 mapping, oxygen-enhanced T1 mapping and dynamic contrast enhanced perfusion. PLoS One, 2015. 10(3): p. e0121520.
6. Jakob, P.M., et al., Rapid quantitative lung (1)H T(1) mapping. Journal of Magnetic Resonance Imaging, 2001. 14(6): p. 795-9.
7. Look, D.C.a.L., D. R., Time Saving in Measurement of NMR and EPR Relaxation Times. Review of Scientific Instruments 1970. 41(250).
8. Barber, D.C. and D.R. Hose, Automatic segmentation of medical images using image registration: diagnostic and simulation applications. J Med Eng Technol, 2005. 29(2): p. 53-63.
Figures