0592
Monitoring Patients with Endobronchial Valve Interventions Using a Multifaceted Hyperpolarized Xenon Lung Function Assessment1University of Pennsylvania, Philadelphia, PA, United States, 2Radiology, University of Pennsylvania, Philadelphia, PA, United States
Synopsis
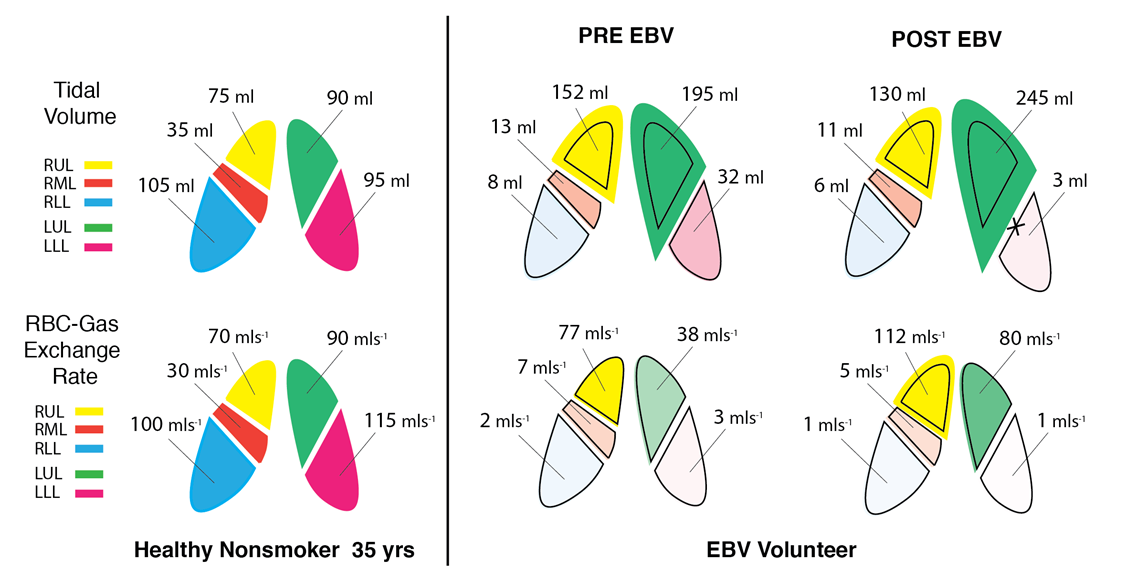
Here, we present an approach for comprehensively assessing the lung’s response to an intervention. Using our multi-breath approach during tidal breathing, we evaluated whether after a Treatment with Zephyr Endobronchial Valves, ventilation is successfully redistributed to the healthier lung, and whether this shift in ventilation can effectively improve gas exchange in non-targeted lobes. We showed gas exchange was more than doubled in the upper left lobe, exceeding the modest ventilation increase observed after occlusion of the LL lobe, likely indicating dramatically improved Q. Notably, right lung function was also improved, perhaps due to normalized breathing mechanics.
Introduction
Approximately 65 million people suffer from chronic obstructive pulmonary disease (COPD) worldwide, with more than 4 million of these dying each year1. Preventing and treating COPD must therefore be a top priority in global health sector decision-making. Treatment with Zephyr Endobronchial Valves (Zephyr EBV, Pulmonx), in which small duckbill-shaped valves are inserted into the distal airways of the lung to occlude an emphysematous target lobe, is one FDA-approved COPD therapy which shows promise2. Here, we present an approach for comprehensively assessing the lung’s response to EBV insertion. Using our multi-breath approach during tidal breathing, we can evaluate whether ventilation is successfully redistributed to the healthier lung, and whether this shift in ventilation can effectively improve gas exchange in non-targeted lobes.Methods
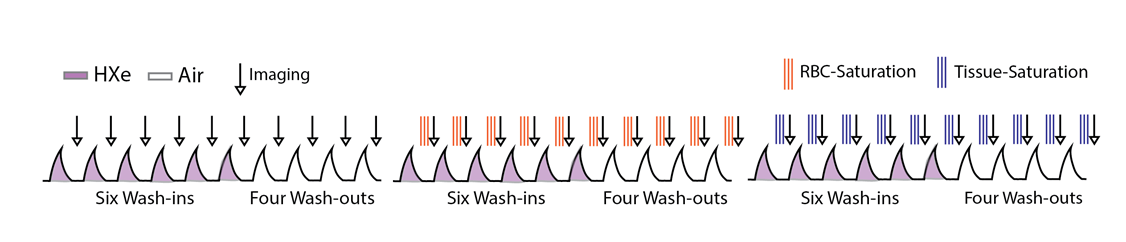
We have previously introduced a multi-breath imaging scheme in which subjects inhale/exhale freely while HP gas is injected into a breathing line3. Figure 1 shows a schematic of this protocol: subjects breathe freely through a mouthpiece, while an additional constant amount (50-100 mL) of HP-Xe (wash-in) or air (wash-out) is injected into the line right before inhalation. The scheme consists of 6 ad libitum normoxic wash-in breaths of hyperpolarized gas (129Xe:O2:N2 ~1:2:7) followed by 4 washout breaths of room air. In this study, a GRAPPA-accelerated image was performed at each exhale, triggered by the subject’s breathing pattern. 87%-enriched Xe gas was polarized by a commercial device (XeBox-E10; Xemed,LLC) that provided gas polarizations of ~40%. Subjects were imaged in a whole body 1.5-T MRI system (Siemens MAGNETOM) using a flexible 8-channel chest coil (Stark Contrast). We employed a 2D multi-slice GRE image set with 6 × ~25mm coronal slices adjusted to cover the whole lung with a 20% inter-slice gap: MS=6×64×48, FOV=40×30cm2, α≈6°, TR/TE=7.0/3.3ms. The ten-breath wash-in/washout series was then repeated five more times with additional series encoding gas dissolution and uptake. The problem of imaging very small dissolved xenon signals can be alleviated using the Xenon polarization Transfer Contrast (XTC) technique, which we implement by applying saturation pulses to selectively destroy the signal fractions fRBC and ftissue in the chosen compartment at each end-exhale, as shown. The series were further analyzed according to a model of voxel-wise per-breath gas replacement:V0,EE = FRC , Vi,EI = Vi-1,EE + Ii × (TV/TV) , Vi,EI - Ei (TV/TV)
S0 = 0, Si = (Si-1 + TV × S∞) × Vi,EE / Vi,EI × fRF × fO2 × fRBC × ftissue (eq.1)
On the first line, FRC and TV are fit parameters describing the average regional gas volume and the average change during breathing, respectively; Vi,EE/EI track that region’s volumes as volumes Ii and Ei are inhaled and exhaled, and TV refers to the average inhaled or exhaled volume during the study, as measured using pneumotach flowmeters. The second line describes the evolution of signal as a volume, TV, containing additional signal TV × S∞, is inhaled, the fraction Vi,EE/ Vi,EI of signal is lost via exhalation, and independently measured factors fRF and fO2diminish signal between breaths through RF-induced and collisional O2-induced relaxation mechanisms. fRBC and ftissue account for the fraction of signal lost by applying RF to the hemoglobin-bound and tissue/plasma-dissolved resonances, respectively. The fit to the complete time series is then used to determine local FRC and TV, the voxel’s gas volumes, and factors dependent gas exchange, fRBC and ftissue. We then define the gas exchange rate in terms of the rate at which these inverted spins re-enter the gas phase during the time, TR, between saturation pulses:
χ = (3/4) × (1-fRBC)1/N × (FRC / TR) (eq.2)
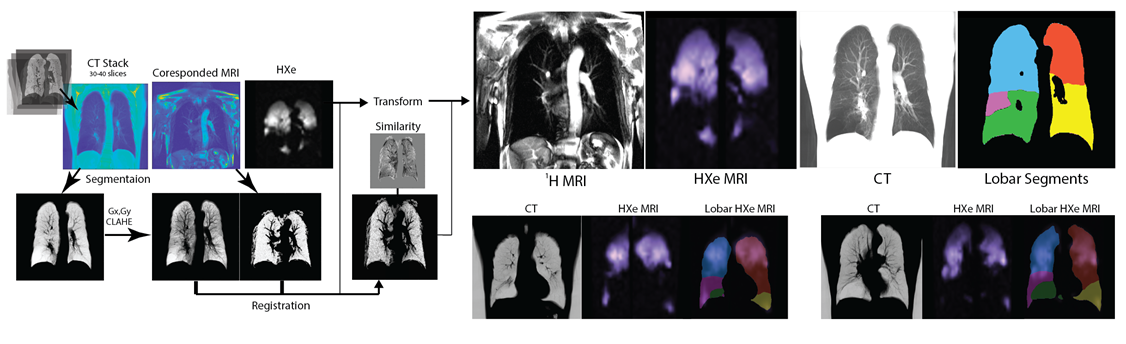
All HXe images were co-registered with an affine transformation and then added together to produce a lung atlas. The lobar estimation was derived using a general-purpose registration framework summarized in Figure 2. Briefly, all pre-post images were registered to the common reference frame derived from the HRCT EE image acquired closest in time. For HXe, anatomical 1H MRI to CT-MR registration is used first; lobar EE CT segmentation is then applied to all warped images to yield lobar totals of χ, TV and FRC.
Results
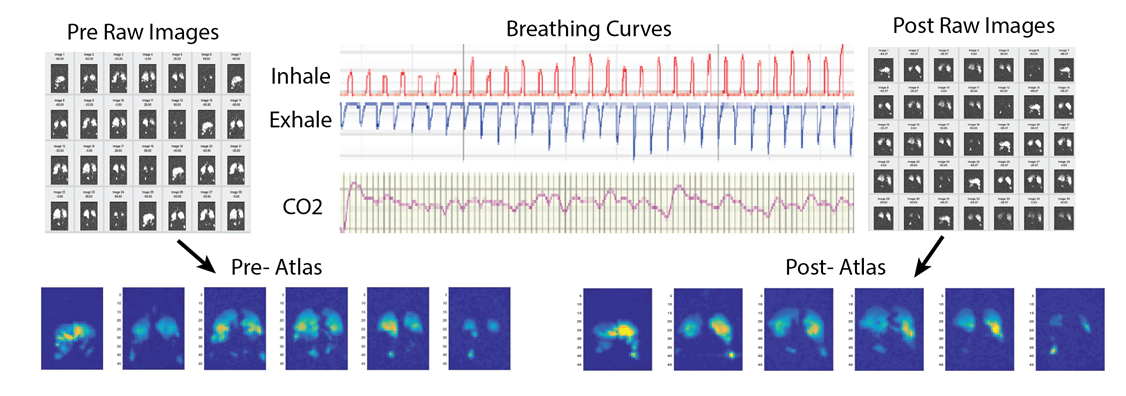
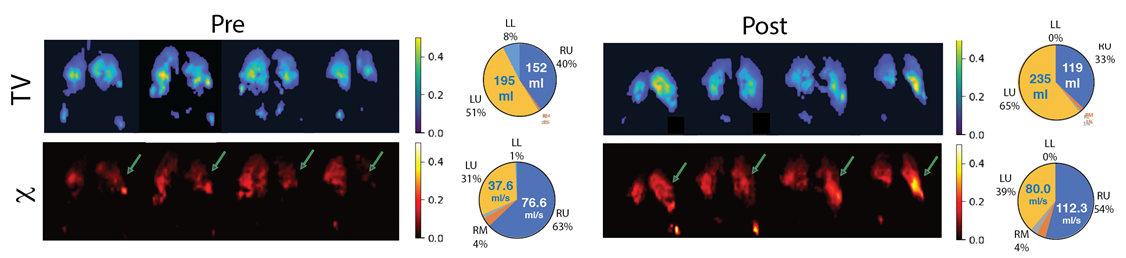
Figure 3 shows the breathing curves, exhaled CO2 and a subset of images produced at end-exhale using 2.5L of HP Xenon over 60 breaths. Figure 4 shows maps, and Figure 5 shows graphic representation of TV and χ in an EBV recipient pre- and post-intervention (also in comparison with a healthy subject). The images show a distinctive pattern of near-normal gas exchange between the alveolar gas and capillary blood in the dorsal and right ventral lung, with reduced exchange in the central lung. In this case, gas exchange was more than doubled in the upper left lobe (arrows), exceeding the modest ventilation increase observed after occlusion of the LL lobe, likely indicating dramatically improved Q. Notably, right lung function was also improved, perhaps due to normalized breathing mechanics. Currently, we have imaged three subjects in this study.Conclusion
The goal of this ongoing study is to gain a fundamental, quantitative understanding of EBV intervention’s functional success and correlate this with subjective quality of life gains. Thus far, we have demonstrated obvious functional improvement in one subject who has completed both pre-and-post-intervention imaging sessions.Acknowledgements
No acknowledgement found.References
[1] May, S.M. and Li, J.T., 2015, January. Burden of chronic obstructive pulmonary disease: healthcare costs and beyond. In Allergy and asthma proceedings (Vol. 36, No. 1, p. 4). OceanSide Publications.
[2] Pizarro, C., Ahmadzadehfar, H., Essler, M., Tuleta, I., Fimmers, R., Nickenig, G. and Skowasch, D., 2015. Effect of endobronchial valve therapy on pulmonary perfusion and ventilation distribution. PloS one, 10(3), p.e0118976.
[3] Hamedani, H., Kdlecek, S., Baron, R.,
Ruppert, K., Xin, Y., Amzajerdian, F., Loza, L., Pourfathi, M., Duncan,
I., Achekzai, T.S. and Siddiqui, S., 2020. Measuring Ventilation with
Hyperpolarized Gas During Normal Breathing. In D110. NEW INSIGHTS FROM ADVANCED IMAGING (pp. A7904-A7904). American Thoracic Society.
Figures