0590
19F-MRI of inhaled perfluoropropane in patients with asthma and patients with COPD pre- and post-bronchodilator therapy
Mary A. Neal1, Benjamin J. Pippard1,2, Ian Forrest3, Rod A. Lawson4, Holly F. Fisher5, John N. S. Matthews5, Kieren G. Hollingsworth1,2, A. John Simpson1, Jim M. Wild6, and Peter E. Thelwall1,2
1Translational and Clinical Research Institute, Newcastle University, Newcastle upon Tyne, United Kingdom, 2Newcastle Magnetic Resonance Centre, Newcastle University, Newcastle upon Tyne, United Kingdom, 3Respiratory Medicine, Newcastle upon Tyne Hospitals NHS Foundation Trust, Newcastle upon Tyne, United Kingdom, 4Respiratory Medicine, Sheffield Teaching Hospitals NHS Foundation Trust, Sheffield, United Kingdom, 5Population Health Sciences Institute, Newcastle University, Newcastle upon Tyne, United Kingdom, 6POLARIS, Department of IICD, University of Sheffield, Sheffield, United Kingdom
1Translational and Clinical Research Institute, Newcastle University, Newcastle upon Tyne, United Kingdom, 2Newcastle Magnetic Resonance Centre, Newcastle University, Newcastle upon Tyne, United Kingdom, 3Respiratory Medicine, Newcastle upon Tyne Hospitals NHS Foundation Trust, Newcastle upon Tyne, United Kingdom, 4Respiratory Medicine, Sheffield Teaching Hospitals NHS Foundation Trust, Sheffield, United Kingdom, 5Population Health Sciences Institute, Newcastle University, Newcastle upon Tyne, United Kingdom, 6POLARIS, Department of IICD, University of Sheffield, Sheffield, United Kingdom
Synopsis
19F-MRI of inhaled perfluoropropane can be used for assessment of pulmonary ventilation. Static breath hold 19F-MR images were acquired pre- and post-bronchodilator following inhalation of a perfluoropropane/oxygen gas mixture in patients with asthma and patients with chronic obstructive pulmonary disease (COPD). Percentage ventilated lung volume (%VV) was calculated from each of the 19F-MR images. %VV was significantly reduced in both patient groups, and between pre- and post-bronchodilator acquisitions in the asthmatic patient group. A strong positive correlation between %VV and spirometric indices was revealed. Gas inhalations were well tolerated by all participants, with no adverse events.
Introduction
The use of exogenous MR-visible gas agents permits direct visualization of the distribution of inhaled gas within the lungs. Hyperpolarized-gas MRI (HP-MRI) research is well established with proven clinical efficacy in patients with respiratory disease.1-3 However, the requirement for specialist hyperpolarization equipment and expertise potentially obstructs its translation to widespread clinical implementation.19F-MRI of inhaled thermally polarised perfluoropropane (PFP) at normoxic concentrations: 79% PFP/21% O2 (PFP/O2), provides an alternative approach to pulmonary imaging, avoiding hyperpolarization. Feasibility of 19F-MRI of inhaled perfluoropropane for assessment of pulmonary ventilation has been demonstrated in pre-clinical models4-6 in addition to a small number of human studies in healthy volunteers7-9 and recently in patients with respiratory disease.10,11
Percentage ventilated lung volume (%VV) is a quantitative imaging biomarker developed in HP-MRI literature. The measure correlates with spirometric indices and offers a clinically meaningful quantitative assessment of regional ventilation. Despite its proven utility and widespread use in HP-MRI literature,1-3 to date %VV assessment of 19F-MR images in patient groups has not been investigated. This work aimed to perform 19F-MRI of patients with respiratory disease pre- and post-bronchodilator therapy for measurement of %VV and comparison with that of healthy volunteers.
Methods
Ethical approval was granted following review by the Newcastle and North Tyneside 1 Research Ethics Committee (ref: 16/NE/0282) and the NHS Health Research Authority. 16 patients with asthma (9M, 7F, aged 20-73 years) and 13 patients with COPD (8M, 5F, aged 60-78 years) were screened for study eligibility. Patients were required to have either a physician diagnosis of asthma (step 3 or above12) or COPD with spirometric indices of FEV1/FVC<0.7, and FEV1<50% predicted.Participants were instructed to withhold all long-acting bronchodilator therapy for 12 hours before the scan session. The participant timeline is illustrated in Figure 1. The MRI component of the study consisted of two same-day scan sessions, with 2.5 mg nebulised salbutamol administered to the participant between sessions. Spirometry was performed immediately prior each of the two MRI scan sessions. Images were acquired using a 19F/1H birdcage torso coil (Rapid Biomedical, Germany) interfaced to a Philips 3T Achieva scanner. Each scan session consisted of a 3D 1H anatomical image (TE=0.49ms, TR=4ms, flip angle=6°, FOV=440×440×247.5mm3,resolution=3×3×7.5mm3, bandwidth=3400Hz/pixel, acquisition time=14.6s) acquired during a deep breath hold, followed by 19F-MRI using a 3D SPGR sequence (TE=1.7ms, TR=7.5ms, flip angle=45°, FOV=400×320×250mm3, resolution=10×10×10mm3, bandwidth=500Hz/pixel, acquisition time=13.5s), during a breath hold following three deep inhalations of the PFP/O2 gas mixture. A 5-minute delay was applied between each 19F-MR acquisition to permit gas wash-out.
Anatomical 1H images were registered to 19F-MR ventilation images using in-house built software developed in Matlab R2019a. The registered 1H and 19F lung images were then segmented to determine %VV using a signal threshold-based segmentation approach using ITK-SNAP (v.3.6.0, USA).
%VV data was compared to previously reported data from 38 healthy volunteers, collected and analysed using equivalent protocols in an earlier phase of this study.7 Two-tailed independent samples t-tests were performed to assess differences between the healthy, asthma, and COPD participant groups. Paired samples t-tests were performed to assess differences between pre- and post-bronchodilator in the asthma and COPD patient groups. Correlation between %VV and the spirometric measures of forced vital capacity (FVC) were assessed using Pearson regression analysis.
Results
19F-MRI was well-tolerated by all participants with no adverse events. Three participants (2 asthma, 1 COPD) were excluded from the data analysis due to a RF coil fault impacting on image quality. In the remaining 26 participants, patients with asthma had a mean(SD) %VV of 83.3(15.3)% (pre-bronchodilator) and 87.8(10.4)% post-bronchodilator. Patients with COPD had a mean (SD) %VV of 64.4(20.1)% pre-bronchodilator and 66.3(16.7)% post-bronchodilator. Figure 2 displays representative 19F-MR image slices from the asthma and COPD datasets. Figure 3 shows a comparison of the %VV measurements between the participant groups.Analysis using two-tailed independent samples t-tests revealed that the %VV values differed significantly between healthy volunteers and patients with asthma, (p=0.006) , healthy volunteers and patients COPD (p=0.0001), and between the two patient groups, both pre- (p=0.02) and post-bronchodilator (p=0.001). Paired samples t-tests revealed a significant difference between pre- and post-bronchodilator in %VV for patients with asthma (p=0.02), though no significant difference pre- and post-bronchodilator in patients with COPD (p=0.40).
Figure 4 displays %VV vs. FVC for patients with asthma patients with COPD both pre- and post-bronchodilator. A strong positive correlation was measured (r=0.56).
Discussion
This work describes preliminary results from the 29 patients scanned to date at Newcastle University, which forms part of an ongoing patient study (n=80) across two research sites (Newcastle University and the University of Sheffield).Image quality was sufficient for segmentation and subsequent measurement of %VV. Statistically significant differences of %VV measurements between patient groups was measured, along with a correlation to FVC. These results align with the outcomes of similar patient studies published in the HP-MRI literature. These findings demonstrate the capacity of 19F-MRI to detect regional changes in gas distribution.
Conclusion
This work represents the first study to report quantitative %VV measurements acquired by 19F-MRI of inhaled PFP in a patient population, and the first to quantify change in ventilation properties on administration of a therapeutic agent. Correlation of %VV to spirometric indices has been reported.Acknowledgements
This work was supported by a Medical Research Council Developmental Pathways Funding Scheme award (MR/N018915/1). Advice and technical support from Dr Matthew Clemence (Philips Healthcare) are gratefully acknowledged.References
- Kirby M, Pike D, Coxson HO, et al. Hyperpolarized 3He ventilation defects used to predict pulmonary exacerbations in mild to moderate chronic obstructive pulmonary disease. Radiology. 2014;273(3):887-896.
- Marshall H, Horsley A, Taylor CJ, et al. Detection of early subclinical lung disease in children with cystic fibrosis by lung ventilation imaging with hyperpolarised gas MRI. Thorax. 2017;72(8):760-762.
- Wild J, Smith L, Horn F, et al. Hyperpolarised gas MR lung imaging – Breaks through to clinical practice. European Respiratory Journal. 2015;46(59):OA4992.
- Pérez-Sánchez JM, Pérez De Alejo R, Rodríguez I, Cortijo M, Peces-Barba G, Ruiz-Cabello J. In vivo diffusion weighted 19F MRI using SF6. Magn Reson Med. 2005;54(2):460–463.
- Keuthe DO, Filipzak PT, Hix JM, et al. Magnetic resonance imaging provides sensitive in vivo assessment of experimental ventilator-induced lung injury. Am J Physiol Lung Cell Mol Physiol. 2016;331(2):L208-L218.
- Couch MJ, Fox MS, Viel C, et al. Fractional ventilation mapping using inert fluorinated gas MRI in rat models of inflammation and fibrosis. NMR in Biomedicine. 2016;29(5):545-552.
- Neal MA, Pippard BJ, Maunder A, et al. 19F-MRI of inhaled perfluoropropane for assessment of pulmonary ventilation: a multi-centre reproducibility study in healthy volunteers. In Proceedings of the 28th Annual Meeting of ISMRM, Online Virtual Conference, 2020. Abstract number 0440.
- Couch MJ, Ball IK, Li T, et al. Pulmonary ultrashort echo time 19F MR imaging with inhaled fluorinated gas mixtures in healthy volunteers: Feasibility. Radiology. 2013;269(3):903–909.
- Halaweish AF, Moon RE, Foster WM, et al. Perfluoropropane gas as a magnetic resonance lung imaging contrast agent in humans. Chest. 2013;144(4):1300–1310.
- Gutberlet M, Kaireit TF, Voskrebenzev A, et al. Free-breathing dynamic 19F gas MR imaging for mapping of regional lung ventilation in patients with COPD. Radiology. 2018;286(3):1040–1051.
- Goralski JL, Chung SH, Glass TM, et al. Dynamic perfluorinated gas MRI reveals abnormal ventilation despite normal FEV1 in cystic fibrosis. JCI Insight. 2020;5(2):e133400.
- BTS/SIGN British Guideline on the Management of Asthma. British Thoracic Society. 2014:64:72. Available at: https://www.brit-thoracic.org.uk/quality-improvement/guidelines/asthma/ [accessed: 12th Nov 2020].
Figures
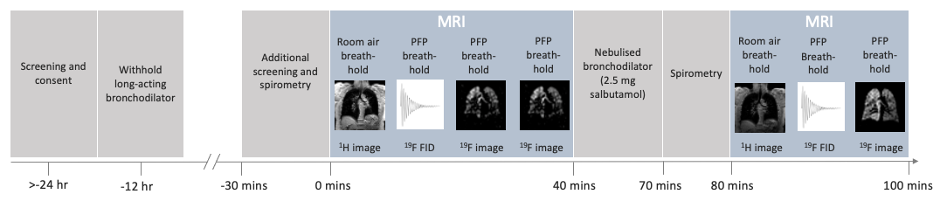
Figure 1: The patient participation timeline: Spirometry was performed immediately prior to the first set of MR scans. A 1H anatomical scan was acquired, followed by a spectroscopy scan to measure the 19F resonant frequency for the remaining acquisitions. Two 3D SPGR 19F-MRI acquisitions were then performed, with the first used for breathing manoeuvre training. Patients then exited the scanner and received bronchodilator therapy. Spirometry was performed 20 minutes after the nebuliser was complete. The MRI scans (minus the training acquisition) were then repeated.
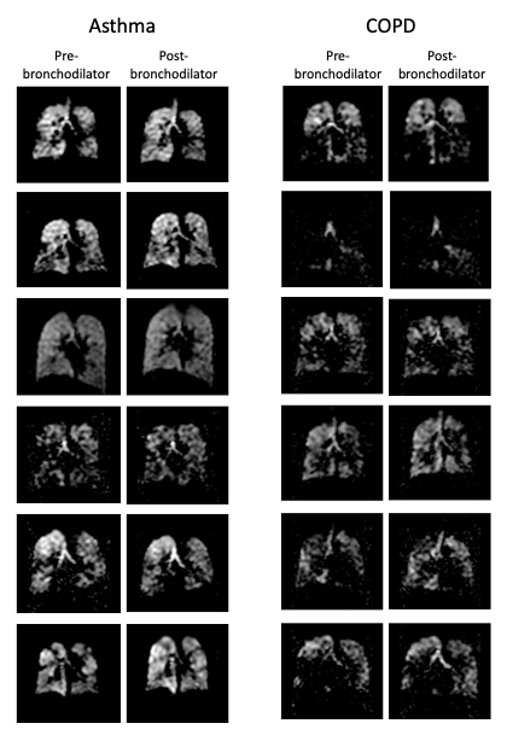
Figure 2: Central slices from 3D SPGR 19F-MR images of inhaled PFP in twelve representative participants. Equivalent slices pre- and post-bronchodilator from the 3D datasets are displayed. The original magnitude images are displayed, where no image processing has been applied other than selection of an appropriate lower windowing threshold to minimise visibility of background noise.
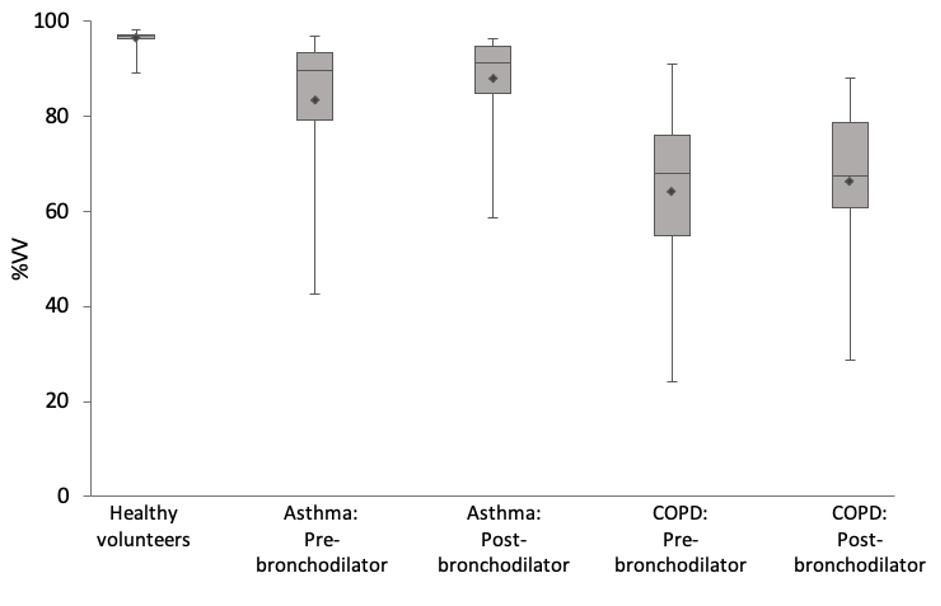
Figure 3: The distribution of %VV measurements from 19F-MRI images of inhaled perfluoropropane in patients with asthma (N = 14) and patients with COPD (N = 12), displayed beside %VV measurements of 38 healthy volunteers measured during an earlier phase of this study.7 Diamonds label the group means, with the 25th percentile, median, and 75th percentiles marked by the three horizonal lines in each box plot. A significant change in %VV was measured between pre- and post-bronchodilator measurements within the asthma cohort, though not for patients with COPD.
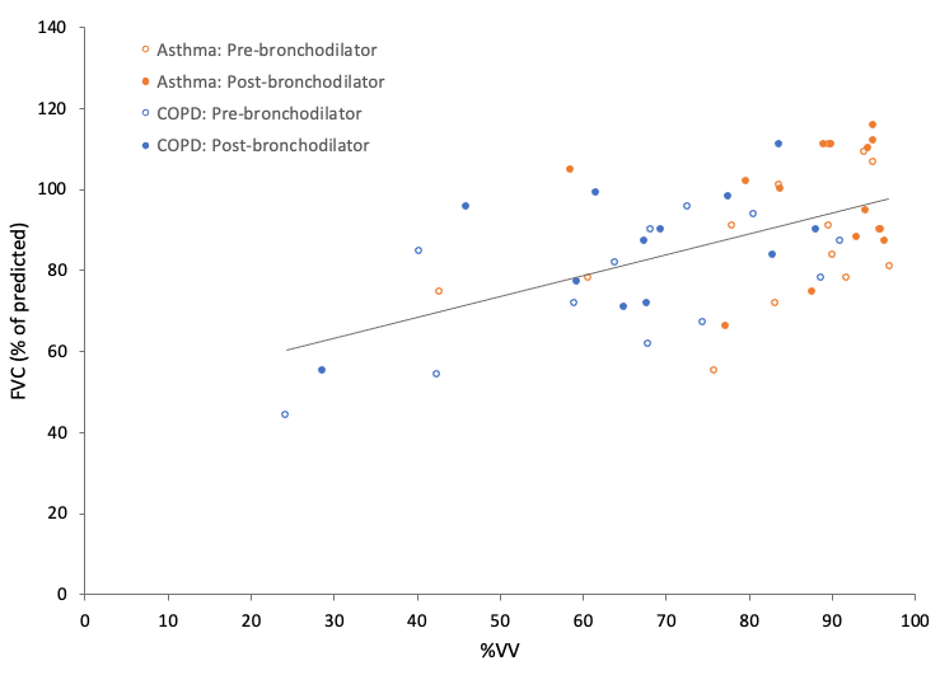
Figure 4: %VV measurements plotted against FVC. Data from patients with asthma (orange circles) are displayed for both pre- (hollow) and post-bronchodilator (filled). Data from patients with COPD (blue circles) are displayed pre- (hollow) and post-bronchodilator (filled). A linear regression trendline fitted against all datapoints is also displayed. A strong positive correlation was measured using Pearson regression analysis (r = 0.56).