0589
Regional Changes in Ventilation Following Bronchodilation in COPD Are Not Associated With Improved Gas Exchange on Xenon-129 MRI
David Mummy1, Erika Coleman2, Ziyi Wang3, Elianna Bier3, Junlan Lu4, Bastiaan Driehuys1,3,4, and Yuh-Chin Huang2
1Radiology, Duke University, Durham, NC, United States, 2Medicine, Duke University, Durham, NC, United States, 3Biomedical Engineering, Duke University, Durham, NC, United States, 4Medical Physics, Duke University, Durham, NC, United States
1Radiology, Duke University, Durham, NC, United States, 2Medicine, Duke University, Durham, NC, United States, 3Biomedical Engineering, Duke University, Durham, NC, United States, 4Medical Physics, Duke University, Durham, NC, United States
Synopsis
Hyperpolarized 129Xe MRI images acquired pre/post-bronchodilator treatment in COPD (N=17) provide a new means of evaluating gas evaluating gas exchange in regions of new, existing, and lost ventilation. Here we demonstrate via longitudinal image registration that, despite improvements in FEV1 and regional ventilation following treatment, no changes in region-based measures of 129Xe barrier or RBC signal were observed. This suggests the presence of persistent vascular abnormalities in COPD that are not addressed by bronchodilation.
Purpose
Hyperpolarized 129Xe MRI provides a non-invasive means of assessing regional gas exchange function in the lung. Inhaled bronchodilator therapy is a common treatment for chronic obstructive pulmonary disease (COPD), reducing airway obstruction, improving FEV1, and allowing the ventilation of previously obstructed regions of the lung. However, the relative contribution of these newly revealed regions to overall gas exchange function, as opposed to airway dynamics alone, is not well understood. Here, we perform registration of 129Xe gas exchange images acquired before and after administration of an inhaled long-acting beta-agonist/long-acting muscarinic receptor antagonist (LABA/LAMA) bronchodilator in patients with COPD. We demonstrate a voxel-wise method of classifying these combined images into three separate regions (newly revealed, constantly ventilated, and newly obstructed or “lost”) reflective of ventilation redistribution. We calculate 129Xe gas exchange metrics specific to these regions, thus presenting a framework for evaluating regional functional consequences of bronchodilation in obstructive lung disease. We hypothesized that we would observe significant changes in gas exchange consistent with subjects’ reported improved outcomes.Methods
Seventeen COPD patients (age 64±5 years) in stage GOLD II (n=9) and GOLD III (n=8) were recruited. After a 1-2 week washout period, they underwent 129Xe MRI both before and after 2 weeks of glycopyrrolate/formoterol inhaler use. Subjects also underwent the COPD Assessment Test (CAT) and measurements of DLCO%P and FEV1%P at each timepoint. Conventional (proton) volume-matched 3D radial UTE images were acquired at each time point, co-registered to their corresponding 129Xe images, and then co-registered longitudinally, with the final result of having all four scans co-registered to one another. The thoracic cavity was segmented on the proton scan and the corresponding ventilation maps binned as described previously.1 From these binned masks binary “ventilation masks” were generated that consisted of the thoracic cavity mask with ventilation defects removed. Ventilation masks were then compared longitudinally to create a combined longitudinal map with three classifications (Fig 1): newly ventilated (green), constantly ventilated (blue), and lost ventilation (red). We then calculated mean values of 129Xe gas exchange metrics (i.e. Bar:Gas and RBC:Gas) in each individual classified region at the corresponding timepoint(s). We assessed changes in metrics across visits using a paired Student’s t-test. Correlations between whole-lung metrics and CAT score, DLCO%P, and FEV1 were assessed using the Pearson correlation.Results
Whole-lung Bar:Gas ratio had a median [1Q – 3Q] of 0.54 [0.44 – 0.64] vs. 0.53 [0.47 – 0.62] at follow-up (p = 0.22). Whole-lung RBC:Gas ratio had a value of 0.16 [0.14 – 0.22] at baseline vs. 0.15 [0.11 – 0.20] at follow-up (p = 0.22). Subjects reported a median 4 point improvement in their CAT score from baseline to follow-up (first quartile: 1 point worsening, third quartile: 6 point improvement) and significant improvements in FEV1 (p < 0.001); however, subjects did not demonstrate improvement in DLCO%P (p = 0.81). Neither change in whole-lung Bar:Gas nor change in whole-lung RBC:Gas were correlated with changes in CAT score (p = 0.51 and p = 0.81 respectively), FEV1 (p = 0.07 and p =0.38), or DLCO%P (p = 0.51 and p = 0.38). Figure 2 shows Bar:Gas ratio and RBC:Gas ratio histograms calculated for the different classified regions at each timepoint in an example subject. Note the relative consistency of the regional Bar:Gas measurements, whereas the RBC:Gas values in the lost and revealed regions differ markedly from the constant regions. Figure 3 shows comparisons of these metrics from each classified region at baseline vs. follow-up across our cohort. None of the changes were significant. Figure 4 shows these same measurements weighted by the lung volume of each individual corresponding region. Again, none of the changes were significant.Discussion
We demonstrate a method for using 129Xe MRI to assess the regional functional consequences of bronchodilator-induced ventilation redistribution in COPD. We did not observe significant changes in Bar:Gas or RBC:Gas ratios in the whole lung or in the individual regions (revealed, constant, and lost) despite visible changes in ventilation patterns and improved CAT scores and FEV1 values in our population. To account for the fact that the effect of changes in mean signal in individual regions could be mediated by changes in the volumes of those regions, we repeated this analysis with metrics weighted by corresponding lung volume. Again, we did not detect significant changes following therapy, and the RBC:Gas ratio especially did not show any evidence of even a trend towards improvement. While this cohort experienced overall improvements in CAT scores and FEV1 following treatment, the absence of change in 129Xe gas exchange metrics suggest that improvements in symptoms are predominantly due to changes in airway dynamics rather than changes in underlying gas exchange function. This interpretation is consistent with the absence of significant change in subjects’ DLCO%P following treatment. These 129Xe findings may reflect the presence of a vascular aspect of COPD that is not addressed by inhaled bronchodilator.Acknowledgements
The study was supported by an investigator-initiated grant from AstraZeneca (ESR-17-12722) and NHLBI R01HL105643.References
1Wang Z, Robertson SH, Wang J, He M, Virgincar RS, Schrank GM, et al. Quantitative analysis of hyperpolarized 129Xe gas transfer MRI. Med Phys. Wiley Online Library; 2017;44:2415–28Figures
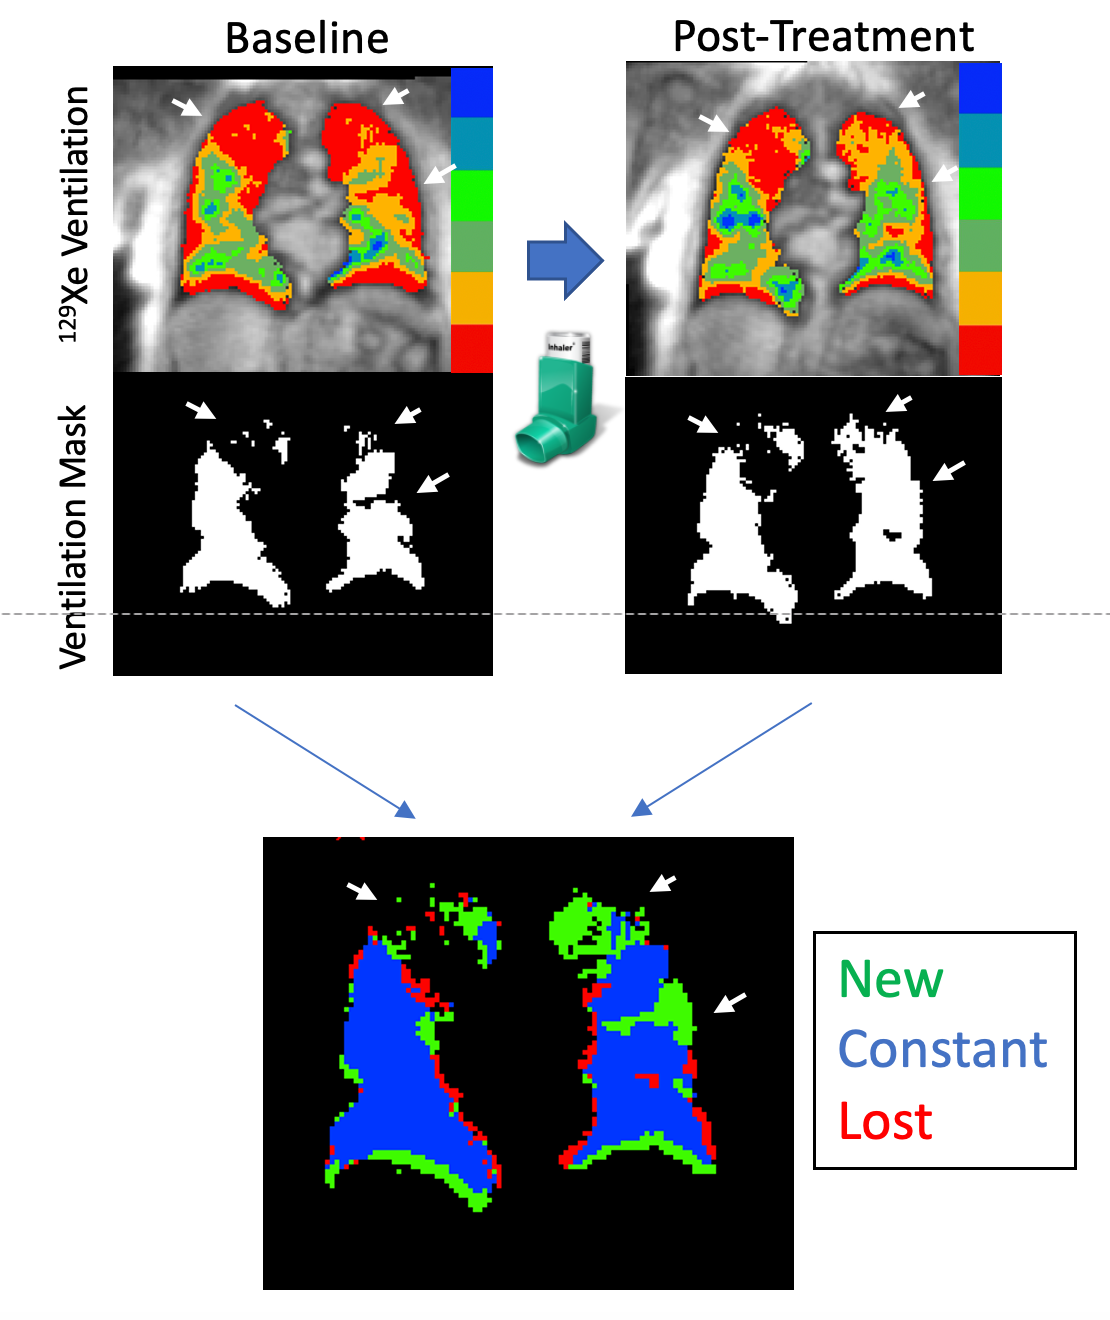
Figure 1. Derivation of revealed regions map. Baseline ventilation binning maps are binarized into ventilation masks for each timepoint (top), and then combined via image registration to classify the image into three regions: newly ventilated (green), ventilated at both time points (“constant” in blue), and regions that were ventilated at baseline but are not at follow-up (“lost”, red). Arrows indicate a prominent persistent ventilation defect in the right lung, and in the left lung, ventilation defects at baseline that are newly revealed at follow-up.
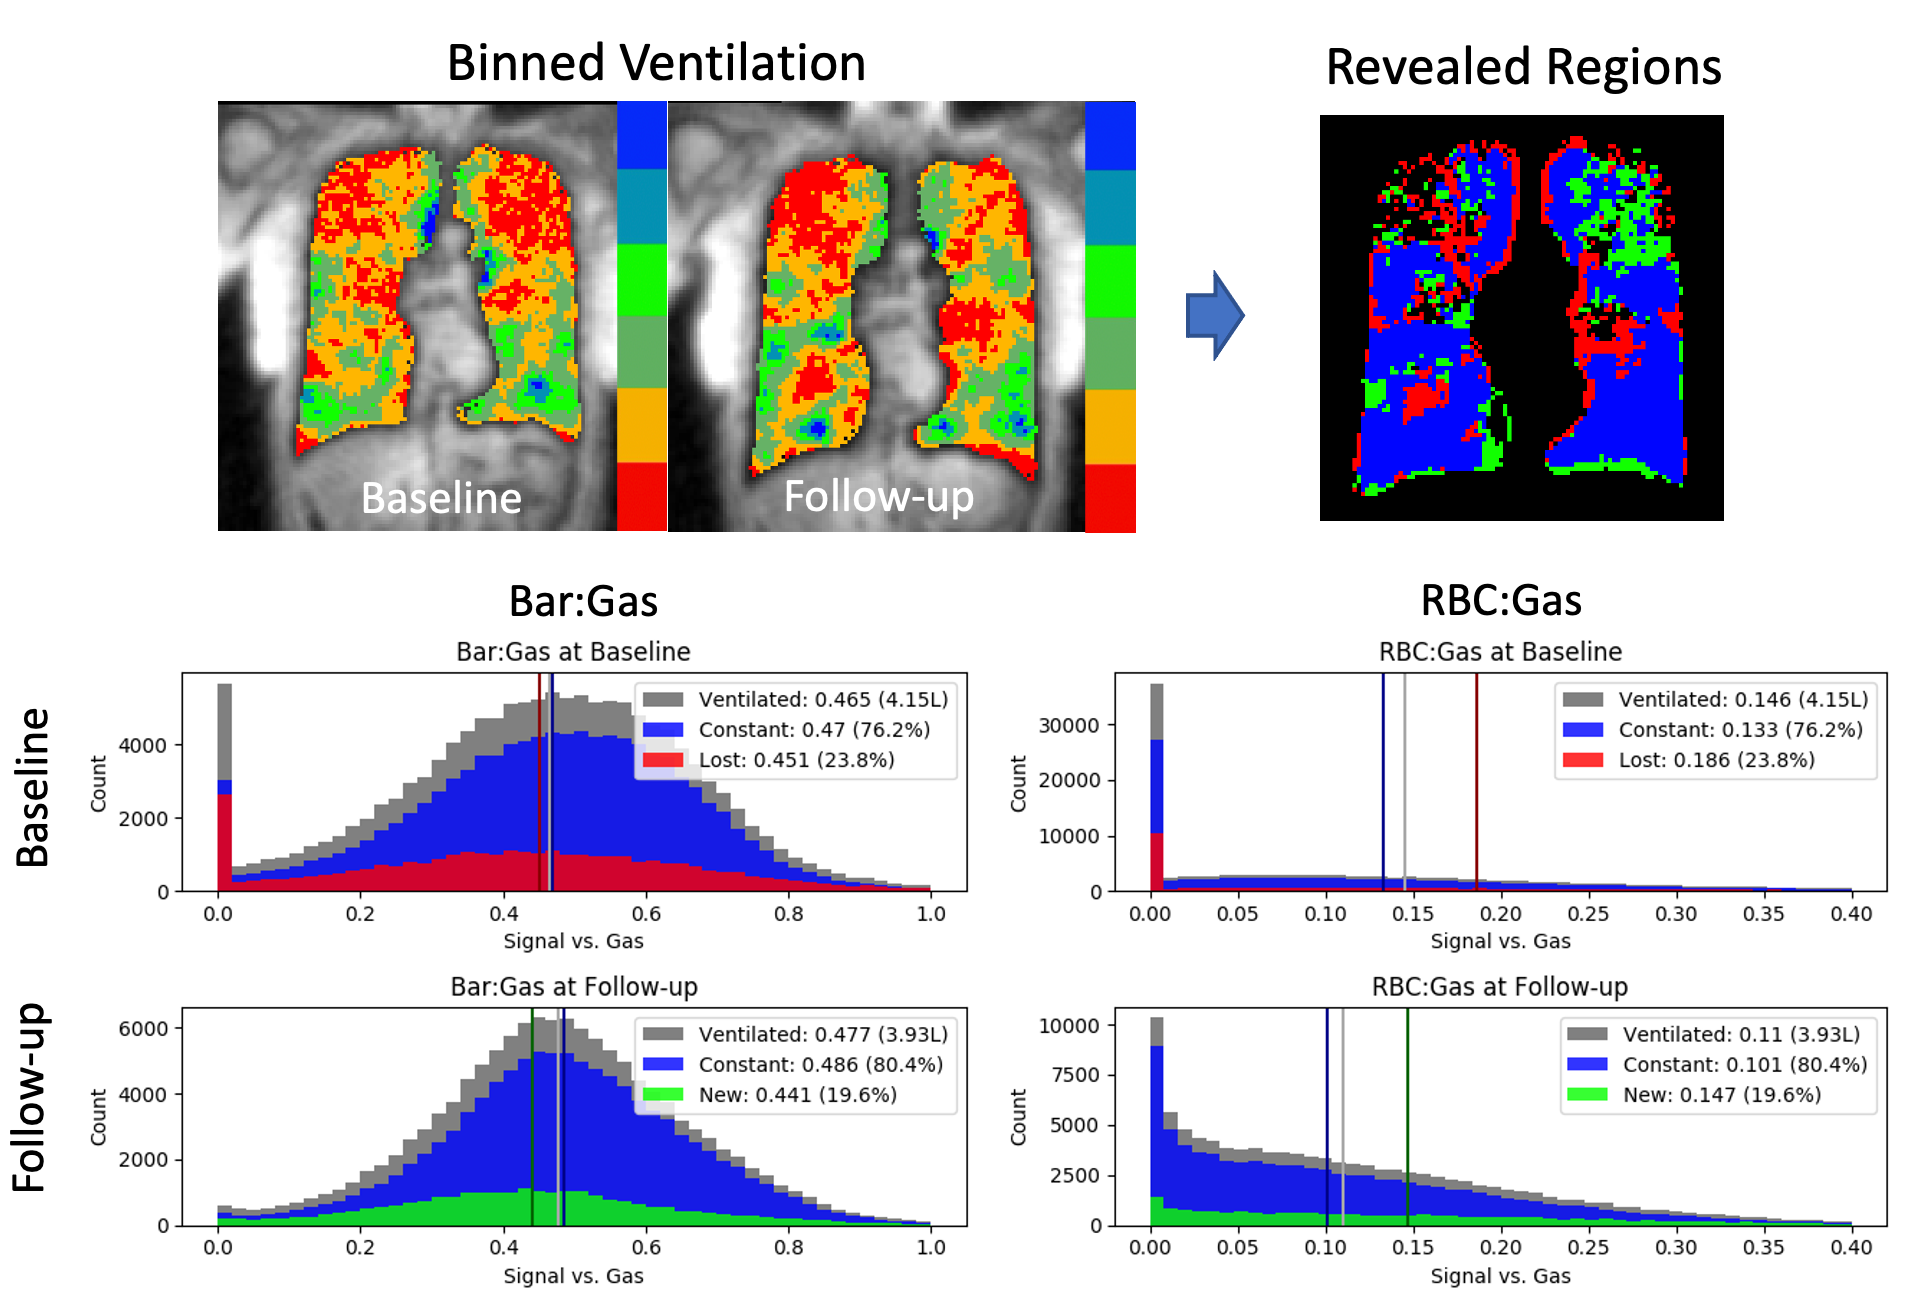
Figure 2. Example histograms corresponding to the classifications in the revealed regions map at baseline (top row) and follow-up (bottom row). Vertical bars indicate the mean value in each region. In this subject, the lost region (red) had a higher mean baseline RBC:Gas ratio than both the constant region (blue) or the overall ventilated volume (gray). At follow-up, the newly revealed regions (green) had a higher mean RBC:Gas ratio than the constant region, but the RBC:Gas ratio of the overall ventilated lung still dropped from 0.15 to 0.11.
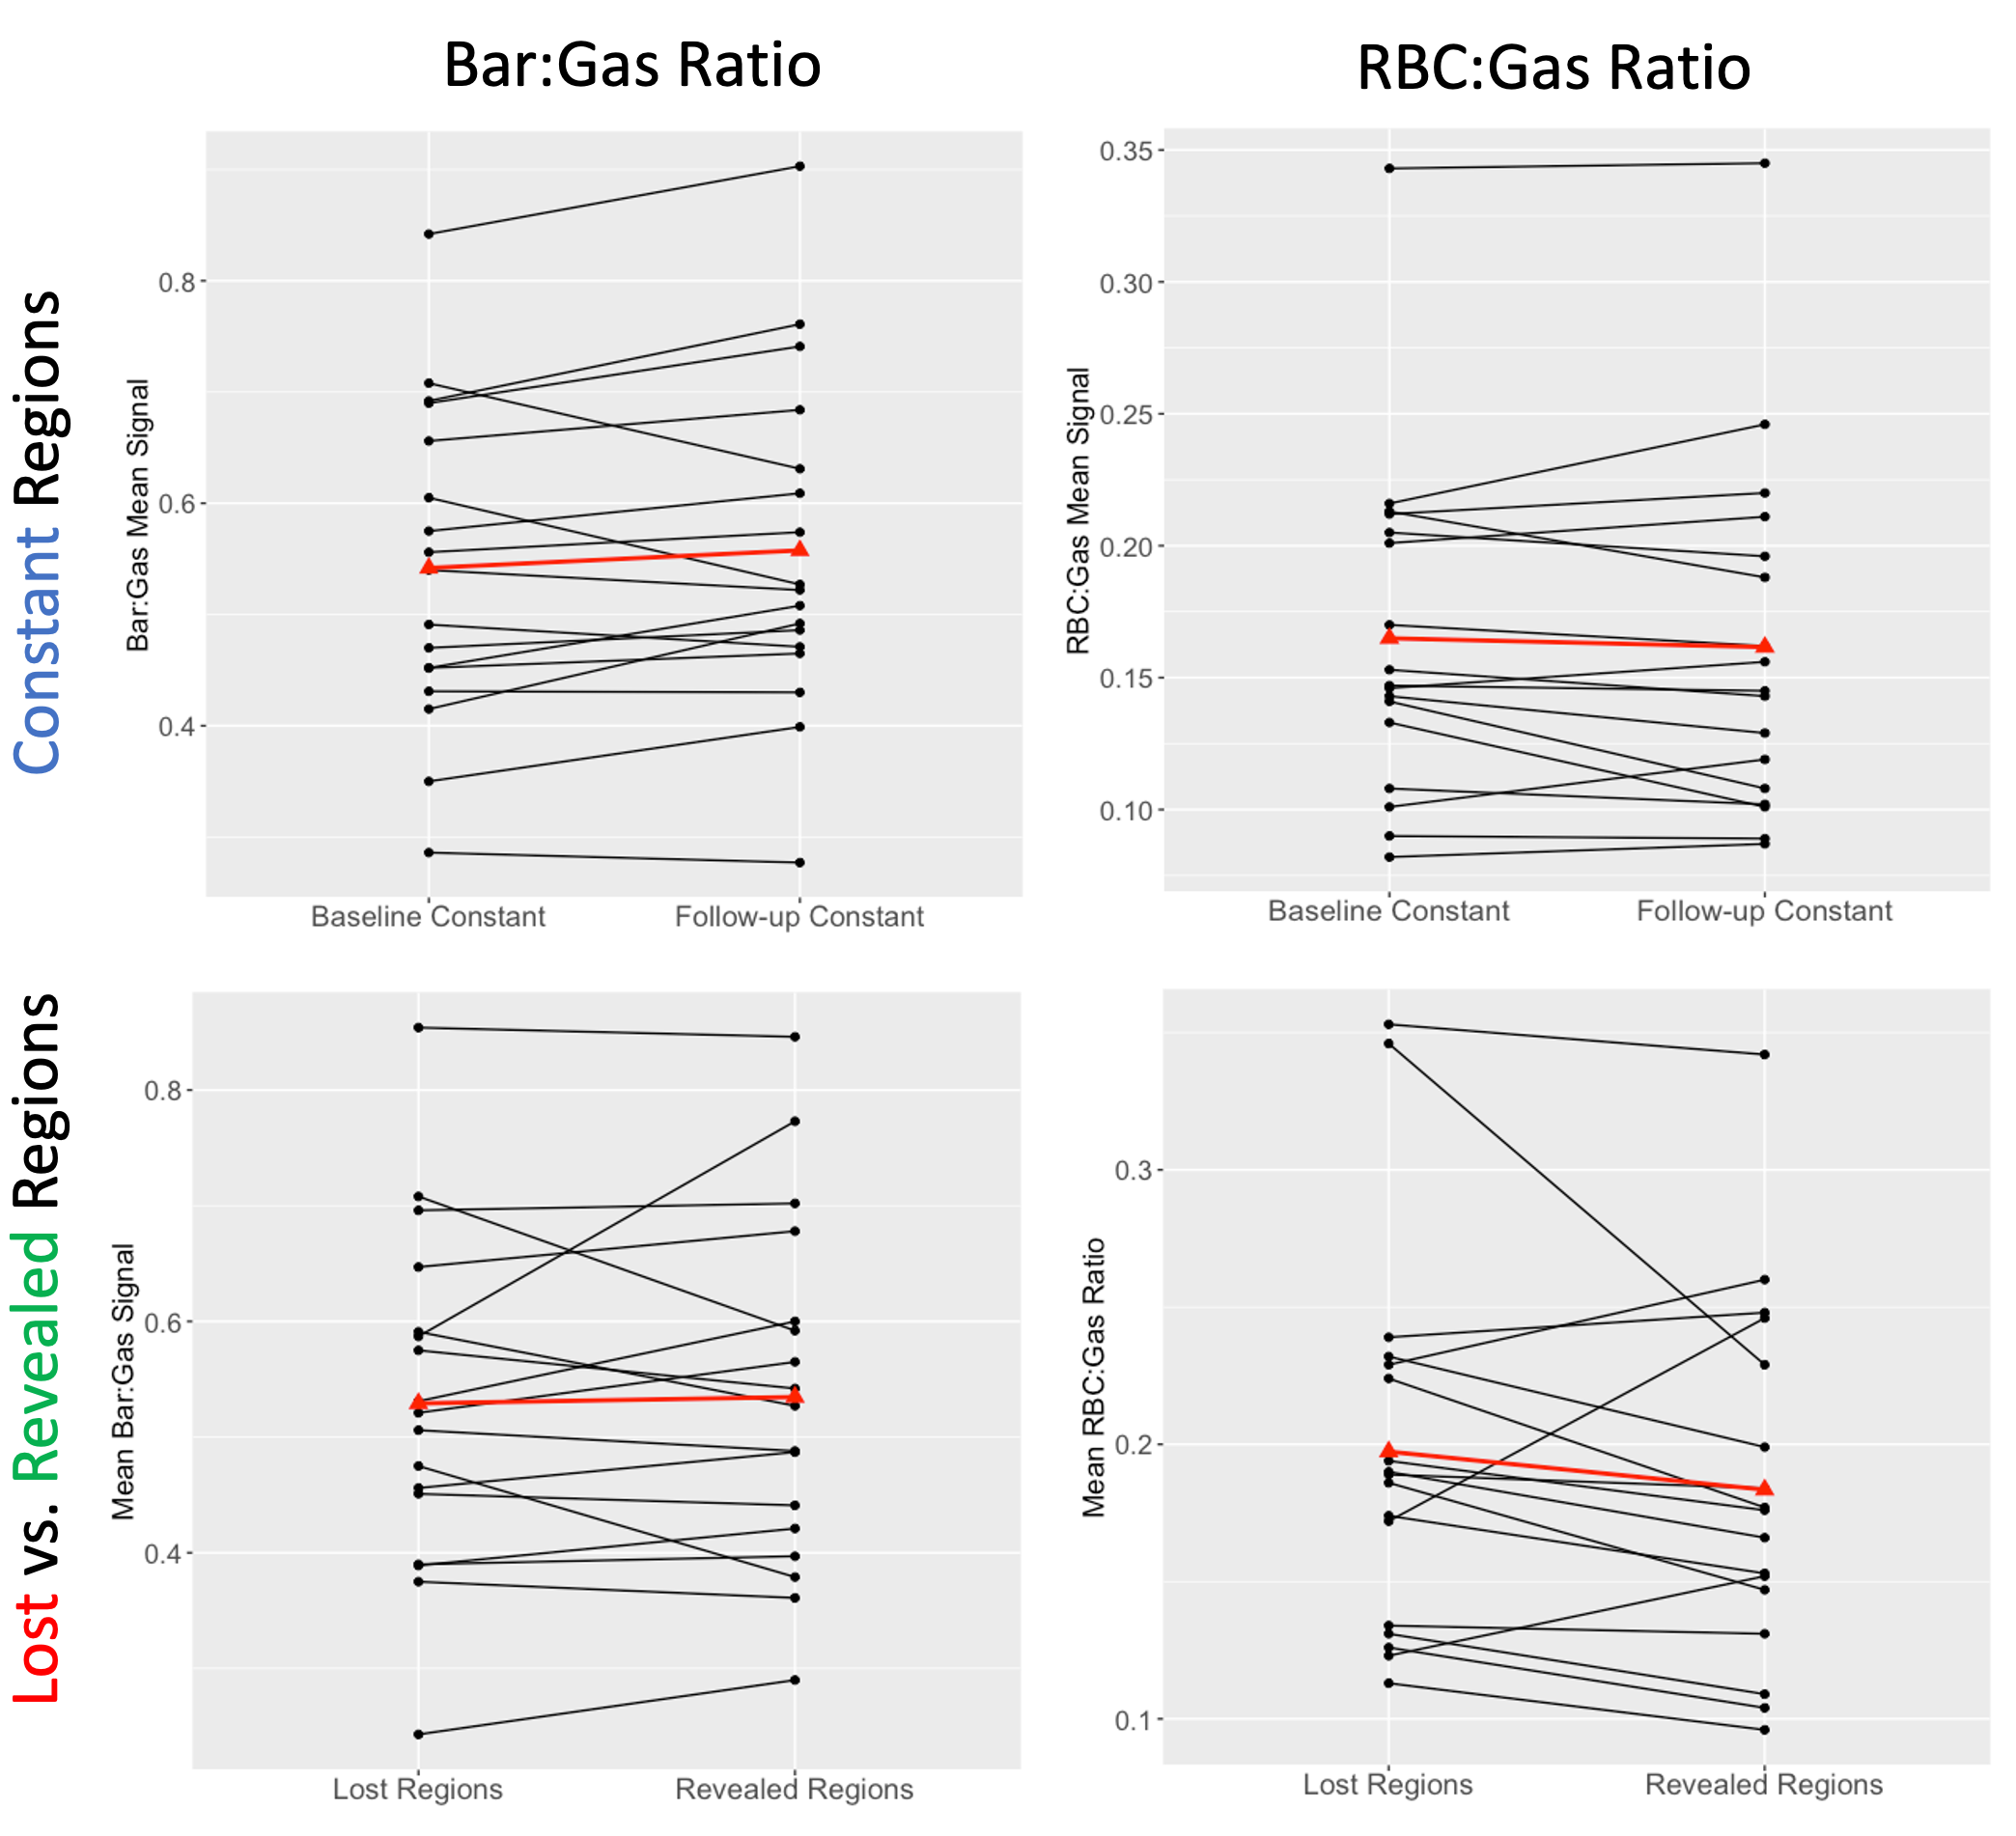
Figure 3. Bar:Gas ratios (left column) and RBC:Gas ratios (right column) in the constant regions at both timepoints (top) and in the lost vs. revealed regions (bottom), with the baseline visit on the left and follow-up on the right. The red connected triangles represent the population mean. Note the absence of significant improvement in any of the metrics from baseline to follow-up
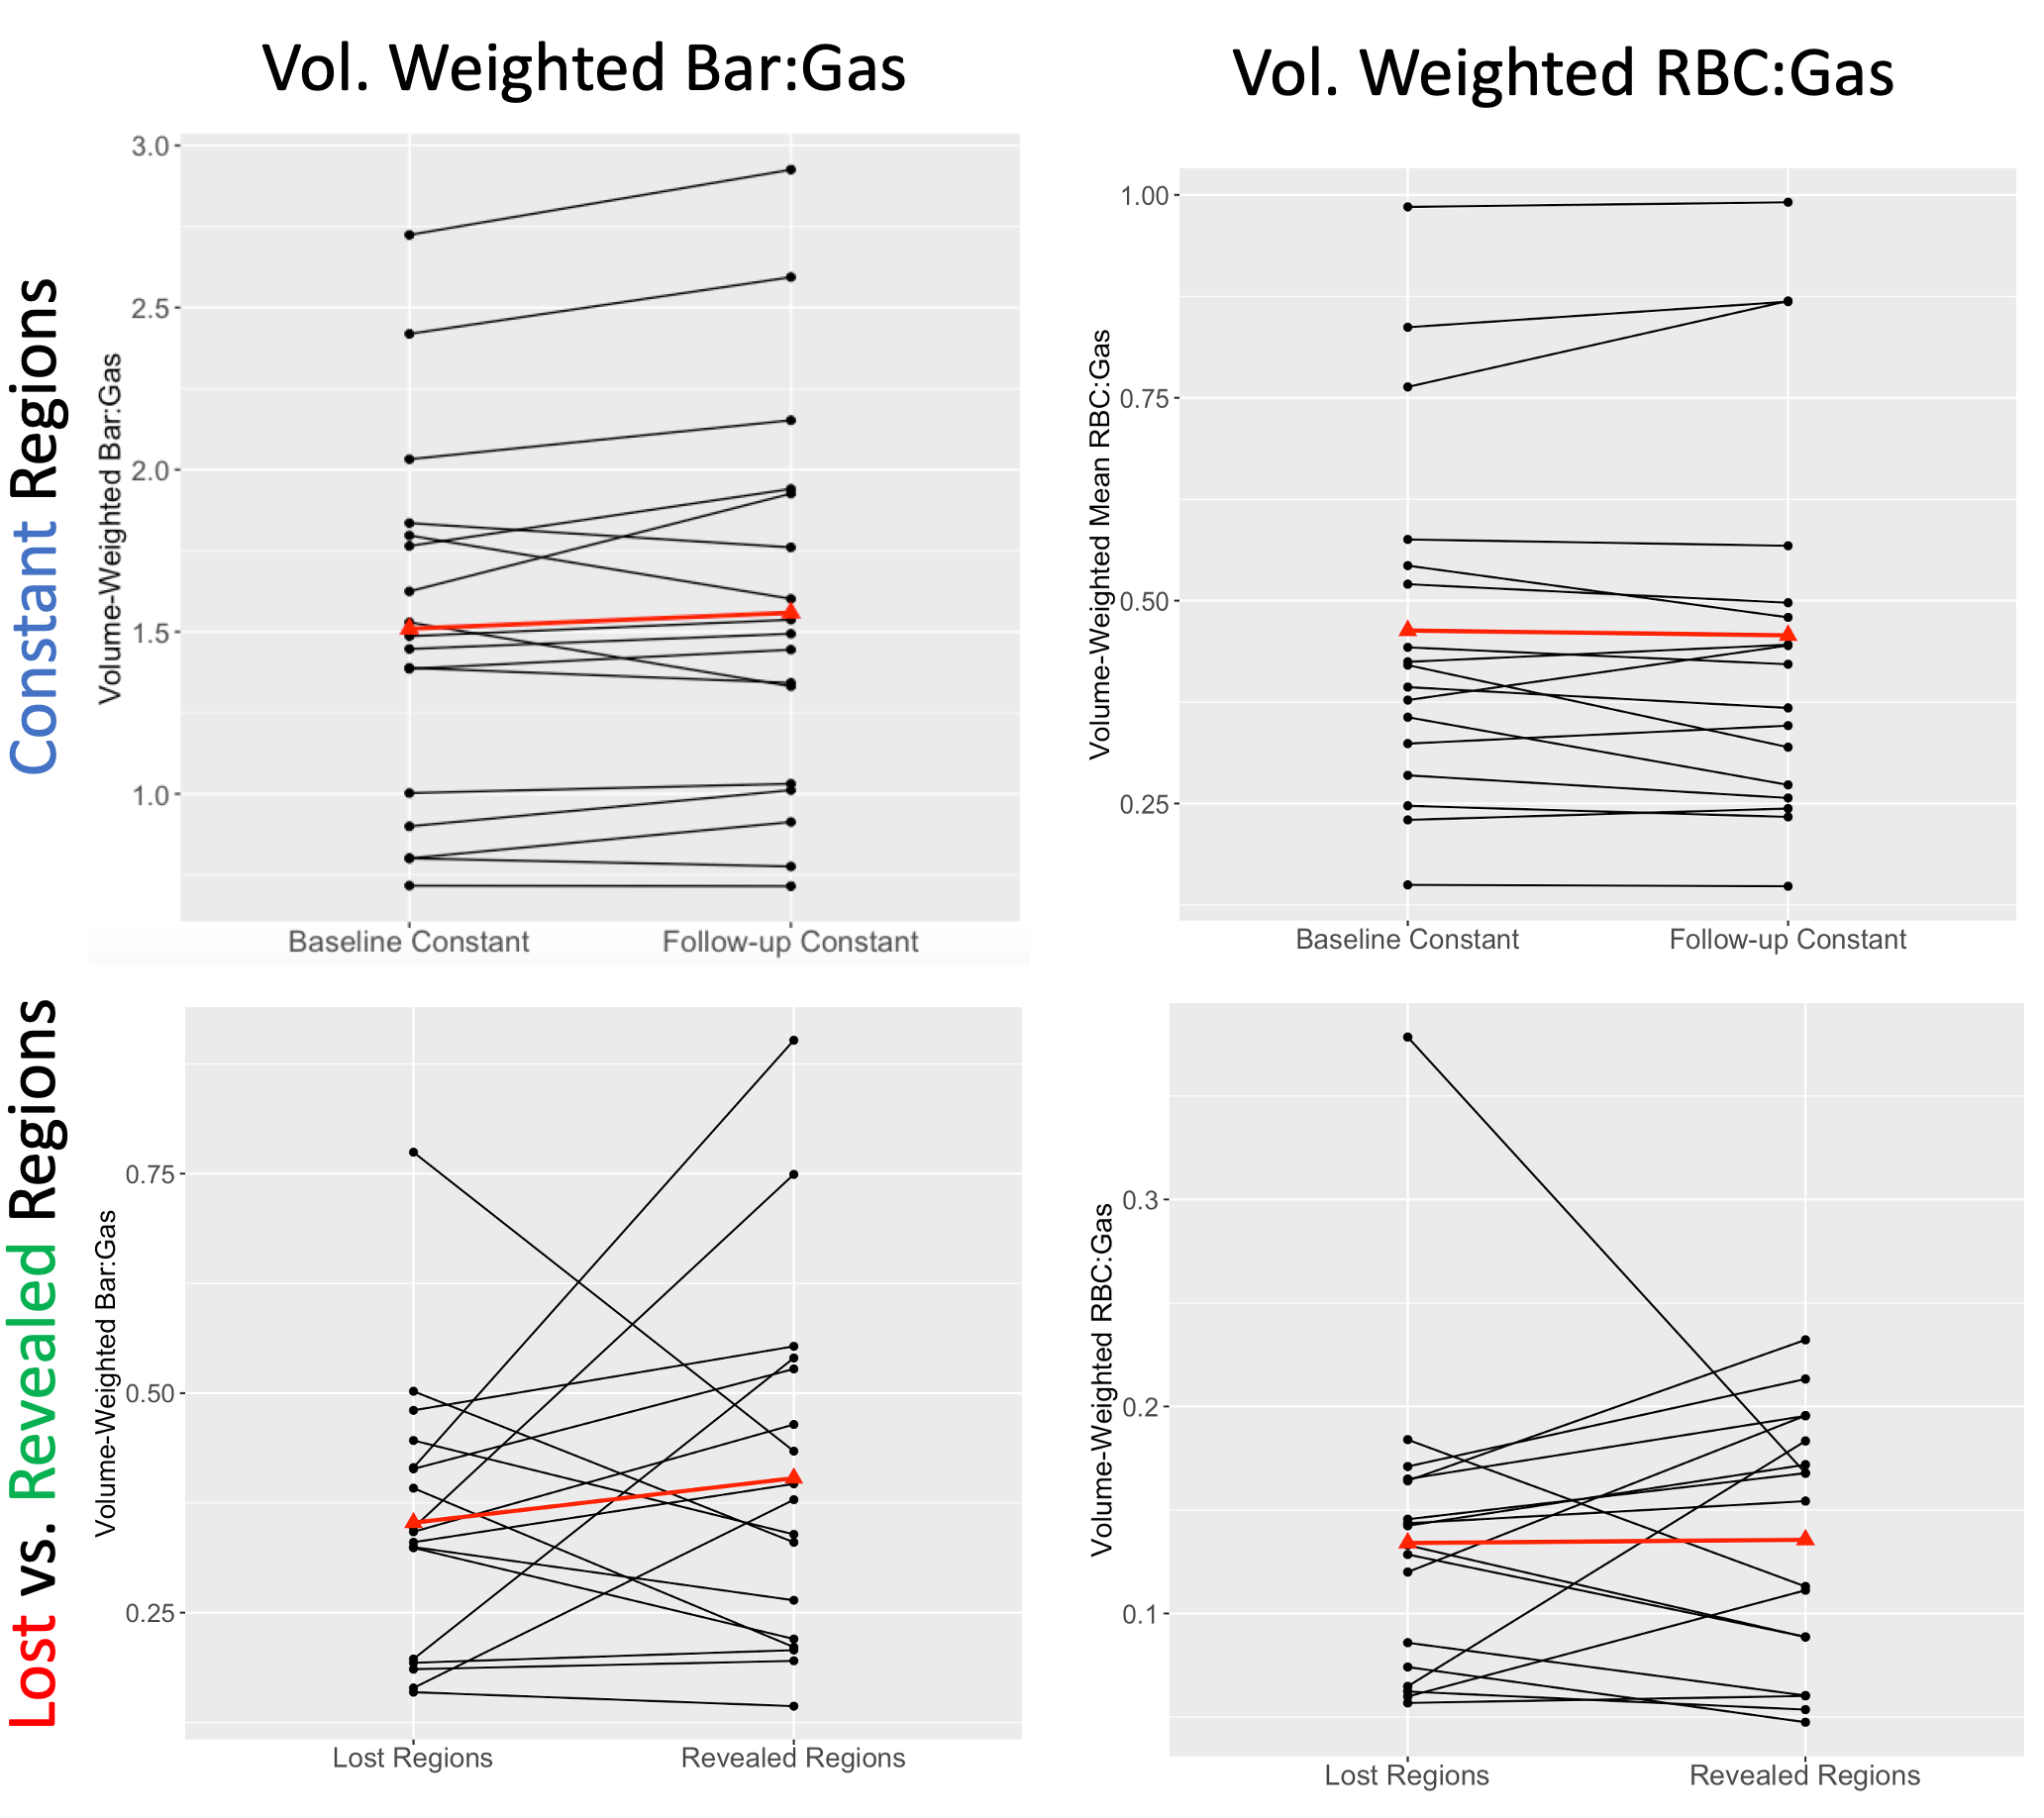
Figure 4. Volume-weighted Bar:Gas ratios (left column) and RBC:Gas ratios (right column) in the constant regions at both timepoints (top) and in the lost vs. revealed regions (bottom), with the baseline visit on the left and follow-up on the rightThe red connected triangles represent the population mean. Weighting the measurements by the individual volumes of each corresponding region does not change the lack of apparent pattern; note especially the lack of change in RBC:Gas ratio in the lost vs. revealed regions.