0588
Quantitative muscle-MRI correlates with histopathology in skeletal muscle biopsies – a pilot study1Neurology, University Clinic Bergmannsheil Bochum gGmbH, Bochum, Germany, 2Radiology, UMC Utrecht, Utrecht, Netherlands
Synopsis
Skeletal muscle biopsy is the gold-standard in the diagnosis of inflammatory and hereditary muscle disorders. Ten patients who underwent muscle biopsy for diagnostic purposes were examined by qMRI (Fat-fraction, water T2-time and diffusion). The fat fraction, the severity of degenerative and inflammatory parameters and the amount of type 1/2-fibers were determined in all samples. The amount of fat tissue correlated significantly between histopathology and qMRI. EPG Water T2-time correlated with the in the histopathologic analysis. The study provides the basis for qMRI methods in the follow up of patients with neuromuscular disorders, especially in the context of emerging treatment strategies.
Introduction
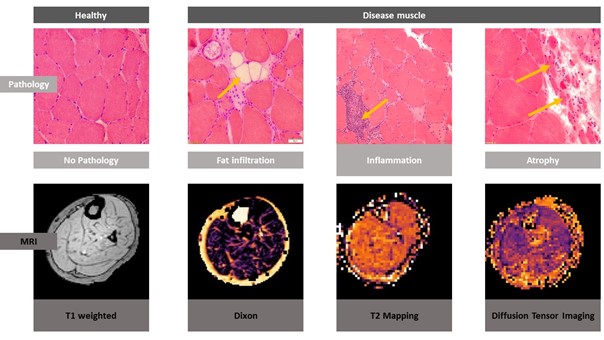
Skeletal muscle biopsy is one of the gold-standards in the diagnostic workup of inflammatory and hereditary muscle disorders. By histopathologic analysis, characteristic features like cellular infiltrations, fat replacement of muscle tissue or structural defects of the myofibrils can be detected. In the past years, novel quantitative MRI (qMRI) techniques have been developed to quantify tissue parameters, providing a non-invasive tool for longitudinal follow-up. Thus, the aim of this study was to validate complimentary quantitative MRI (qMRI) techniques (Dixon, T2-mapping, diffusion tensor imaging) with well-established corresponding histopathologic parameters used in the diagnostic workup of muscle disorders (see Figure 1).Methods
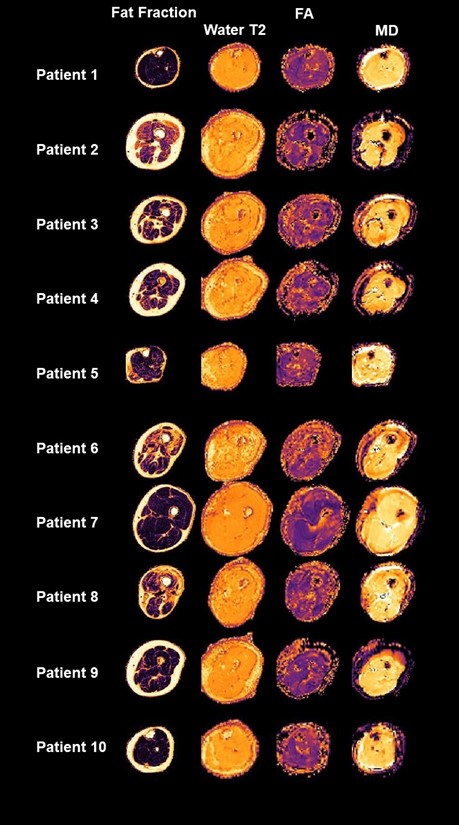
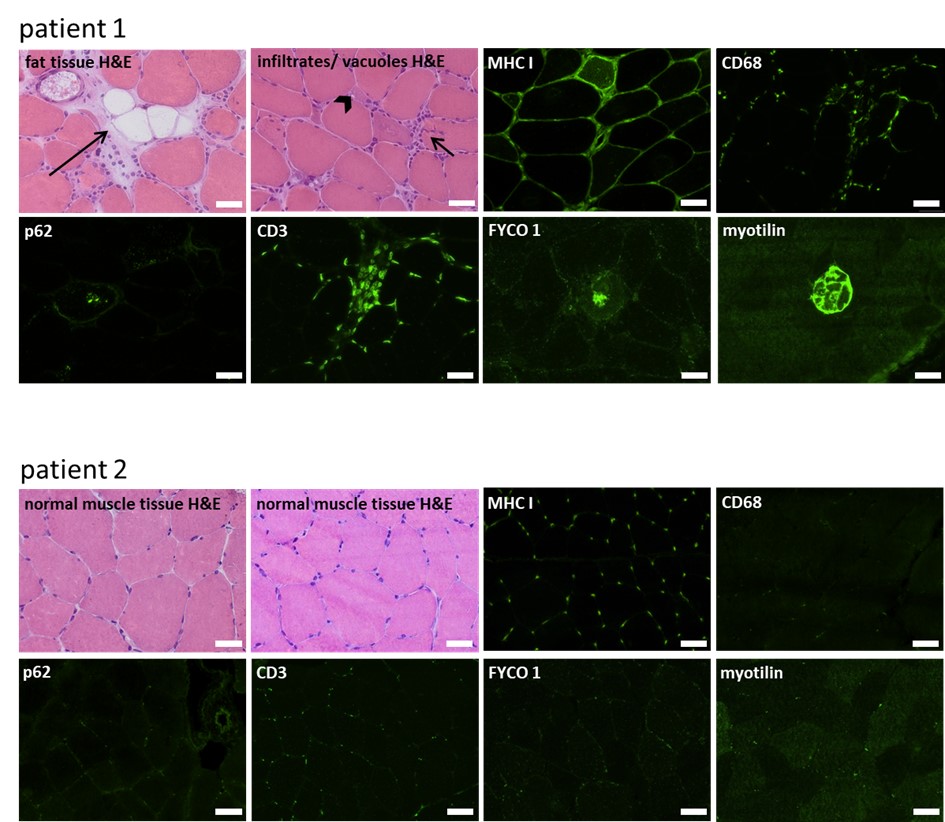
Ten patients who underwent skeletal muscle biopsy for diagnostic purposes were examined by qMRI1 in a 3T Philips Achieva MRI using a 16CH Torso XL Coil. Fat fraction (dixon), water T2-time (ME-SE) and diffusion (SE-EPI) parameters were measured in the muscle from which the biopsy was taken according to Schlaffke et al., 20191. In short, all data were motion corrected, the water T2 estimation was performed using an extended phase graph fitting approach2. For the estimation of the diffusion metrics, the intravoxel incoherent motion was taken into account 3 and the tensor was calculated using an iterative weighted linear least‐square algorithm (WLLS)4. The Dixon data were processed using an iterative decomposition of water and fat with echo asymmetry and least squares estimation (IDEAL)5 using eight reference fat peaks6. Subsequently, the muscle in which the biopsy was performed was manually delineated slice by slice. Using this mask, the mean value of the estimated water T2, the fat fraction as well as the diffusion metrics (including fractional anisotropy-FA and mean diffusivity – MD) were derived (See Figure 2).The proportion of fat tissue, the severity of degenerative and inflammatory parameters and the amount of type 1 and type 2-fibers were determined in all biopsy samples. Serial skeletal muscle cryosections of 10 µm thickness were fixed, permeabilized, blocked, and incubated overnight at 4°C with primary antibodies against major histocompatibility complex I (MHC I; CD3, CD68, p62, FYCO 1, myotilin, myosin heavy chain slow or myosin heavy chain 2A). All primary antibodies were diluted in 2% bovine serum albumin (BSA) in phosphate- buffered saline (PBS) for immunofluorescence. Subsequently, the qMRI-data were correlated to the histopathological findings.
Results
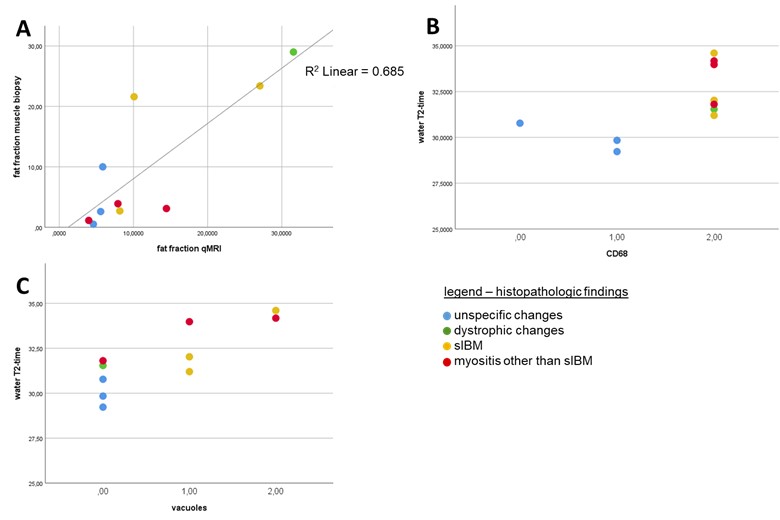
Three of the ten patients included in this study, had unspecific changes on histopathology, one had features of a muscular dystrophy (hereafter named as “dystrophic changes”), three showed the histopathological features of sporadic inclusion body myositis (hereafter referred to as “sIBM”), and three were described as “myositis other than sIBM”. Fat fractions calculated from the qMRI-data correlated significantly with the proportion of fat tissue in the skeletal muscle biopsy sample (see Figure 4A, r = 0.842, p = 0.002). Our data show that long water T2- times (>30 ms) are associated with the presence of CD68- positive macrophages in skeletal muscle tissue (figure 4B). Long water T2- time correlated significantly with the amount of cytoplasmic vacuoles (see Figure 5C, r = 0.816, p = 0.004). There was a significant correlation of water T2-time with the amount of macrophages (r = 0.764, p = 0.01). The amount of cellular infiltrations and the presence of MHC I at the sarcolemma was also higher in muscle tissue with a long T2-time, but without statistical significance. Long water T2-times also tend to be associated with the autophagy- marker p62, but without statistical significance. The results hint at an association of the FA (fractioned anisotropy) with the amount of type 1- fibers, and the amount of “mixed fibers” with type 1- and type 2- features, but the data lack statistical significance. The presence of CD3, FYCO 1 or myotilin- positive aggregates in the skeletal muscle biopsy did not significantly correlate with any of the qMRI- features.Discussion
As not only inflammatory changes, but also structural defects of the muscle cells result in tissue oedema, we compared the water T2-time with the amount of vacuoles and p62 as markers for tissue degeneration and autophagy. Our study showed a significant correlation of fat fraction in qMRI with the proportion of fat tissue in muscle biopsy. Former studies have described an increased fat fraction in several neuromuscular disorders 7,8 which corresponds to clinical muscle function parameter. Correlation of qMRI fat fraction with histological proportion of fat tissue taken within 24 hours before muscle biopsy thus validated Dixon MRI as a reliable method to detect fat replacement in neuromuscular disorders. The correlation of water-T2 with histopathologic parameters like CD68 or the amount of vacuoles can thus be taken as a marker for the activity of the disease, as already been postulated by Carlier et al. in inflammatory myopathies9. This provides evidence, that qMRI may serve as a non-invasive addition or alternative to biopsies, when evaluating disease progression.Conclusion
In this pilot study, qMRI techniques were validated by the comparison to characteristic histopathologic features in neuromuscular disorders. The study provides the basis for further development of qMRI methods in the follow up of patients with neuromuscular disorders, especially in the context of emerging treatment strategies.Acknowledgements
We thank Philips Germany, especially Burkhard Maedler for continuous scientific supportReferences
1. Schlaffke L, Rehmann R, Rohm M, et al. Multicenter evaluation of stability and reproducibility of quantitative MRI measures in healthy calf muscles. NMR Biomed. 2019;32(9):1-14. doi:10.1002/nbm.4119
2. Marty B, Baudin PY, Reyngoudt H, et al. Simultaneous muscle water T2 and fat fraction mapping using transverse relaxometry with stimulated echo compensation. NMR Biomed. 2016;29(November 2015):431-443. doi:10.1002/nbm.3459
3. De Luca A, Bertoldo A, Froeling M. Effects of perfusion on DTI and DKI estimates in the skeletal muscle. Magn Reson Med. 2017;78:233-246. doi:10.1002/mrm.26373
4. Veraart J, Sijbers J, Sunaert S, Leemans A, Jeurissen B. Weighted linear least squares estimation of diffusion MRI parameters: Strengths, limitations, and pitfalls. Neuroimage. 2013;81:335-346.
5. Reeder SB, Pineda AR, Wen Z, et al. Iterative Decomposition of Water and Fat With Echo Asymmetry and Least-Squares Estimation ( IDEAL ): Application With Fast Spin-Echo Imaging. Magnenetic Reson Med. 2005;644:636-644. doi:10.1002/mrm.20624
6. Triplett WT, Baligand C, Forbes SC, et al. Chemical shift-based MRI to measure fat fractions in dystrophic skeletal muscle. Magn Reson Med. 2014;72(1):8-19. doi:10.1002/mrm.24917.Chemical
7. Otto LAM, van der Pol WL, Schlaffke L, et al. Quantitative MRI of skeletal muscle in a cross-sectional cohort of patients with spinal muscular atrophy types 2 and 3. NMR Biomed. 2020;(e4357):1-13. doi:10.1002/nbm.4357
8. Carlier PG, Azzabou N, De Sousa PL, et al. Skeletal muscle quantitative nuclear magnetic resonance imaging follow-up of adult Pompe patients. J Inherit Metab Dis. 2015;(38):565-572.
9. Carlier PG, Marty B, Scheidegger O, et al. Skeletal Muscle Quantitative Nuclear Magnetic Resonance Imaging and Spectroscopy as an Outcome Measure for Clinical Trials. J Neuromuscul Dis. 2016;3(1):1-28. doi:10.3233/JND-160145
Figures