0586
Multimodal MR Assessment of Skeletal Muscle in Patients with Chronic Kidney Disease and Dialysis1Department of Medical Physics, Memorial Sloan Kettering Cancer Center, New York, NY, United States, 2Philips Healthcare, Andover, MA, United States, 3Department of Radiology, Albert Einstein College of Medicine and Montefiore Medical Center, Bronx, NY, United States, 4Department of Medicine, Albert Einstein College of Medicine and Montefiore Medical Center, Bronx, NY, United States, 5Department of Bioengineering, University of California, Berkeley, Berkeley, CA, United States
Synopsis
Chronic kidney disease (CKD) is associated with reduced skeletal muscle mass, strength, and function, but a quantitative approach to systematically assess changes in skeletal muscle is lacking. The purpose of this study was to develop a multimodal MR method for quantitative assessment of skeletal muscle in patients with CKD compared to normal controls. The study revealed significant changes of T1ρ, intra- and extra-myocellular lipid ratio, ADC, and FA in CKD or dialysis patients. In addition, there was significant correlation between T1ρ and DTI biomarkers. These findings may provide new insights into the impaired skeletal muscle function in CKD patients.
INTRODUCTION
Previous studies have shown that chronic kidney disease (CKD) is associated with reduced skeletal muscle mass, strength, and function.1 However, a non-invasive and quantitative approach to systematically assess changes in skeletal muscle in patients with CKD is lacking. T1ρ emerges as a promising biomarker for early detection of biochemical changes in knee cartilage, brain tissue, and skeletal muscle.2-4 We hypothesize that T1ρ can be used to detect changes in skeletal muscle in patients with CKD. MR spectroscopy (MRS) has shown to be a useful tool for measuring lipid composition in skeletal muscle and therefore can be used to quantify intra- and extra-myocellular lipids (IMCL and EMCL).5 Diffusion tensor imaging (DTI) enables microstructural assessment of skeletal muscle and its function.6 The purpose of this study was to develop a multimodal MR method for quantitative assessment of skeletal muscle in patients with CKD and dialysis in comparison to normal controls.METHODS
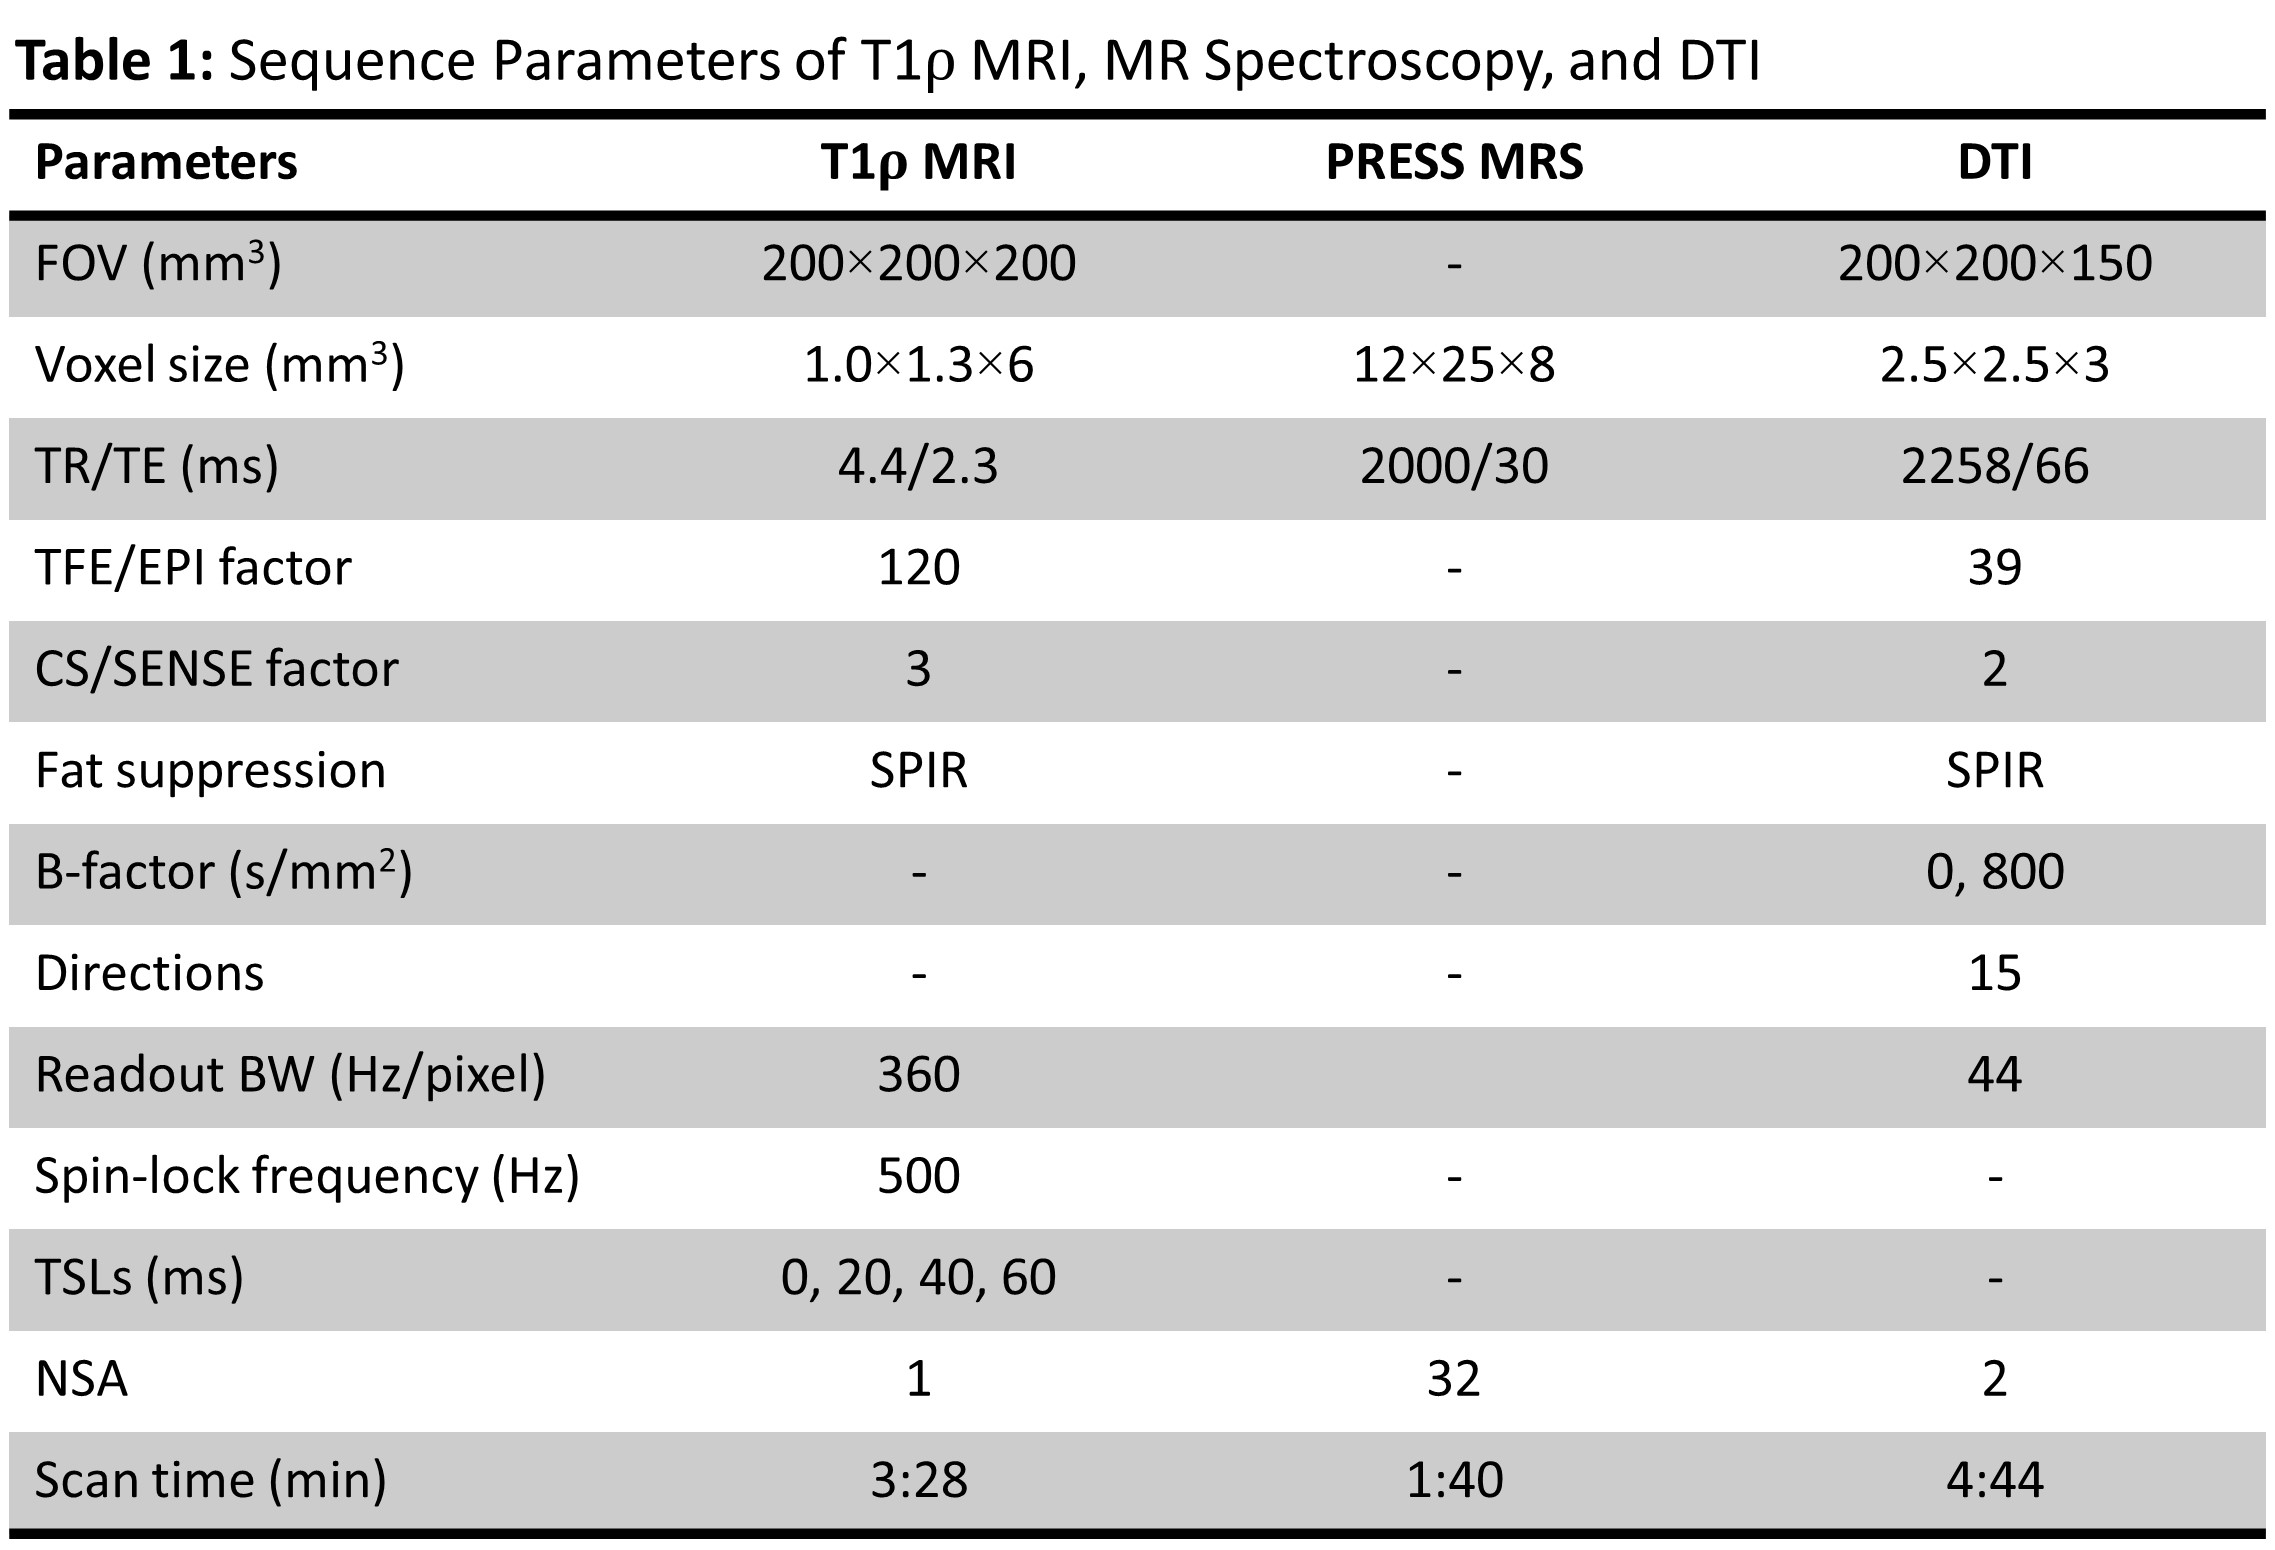
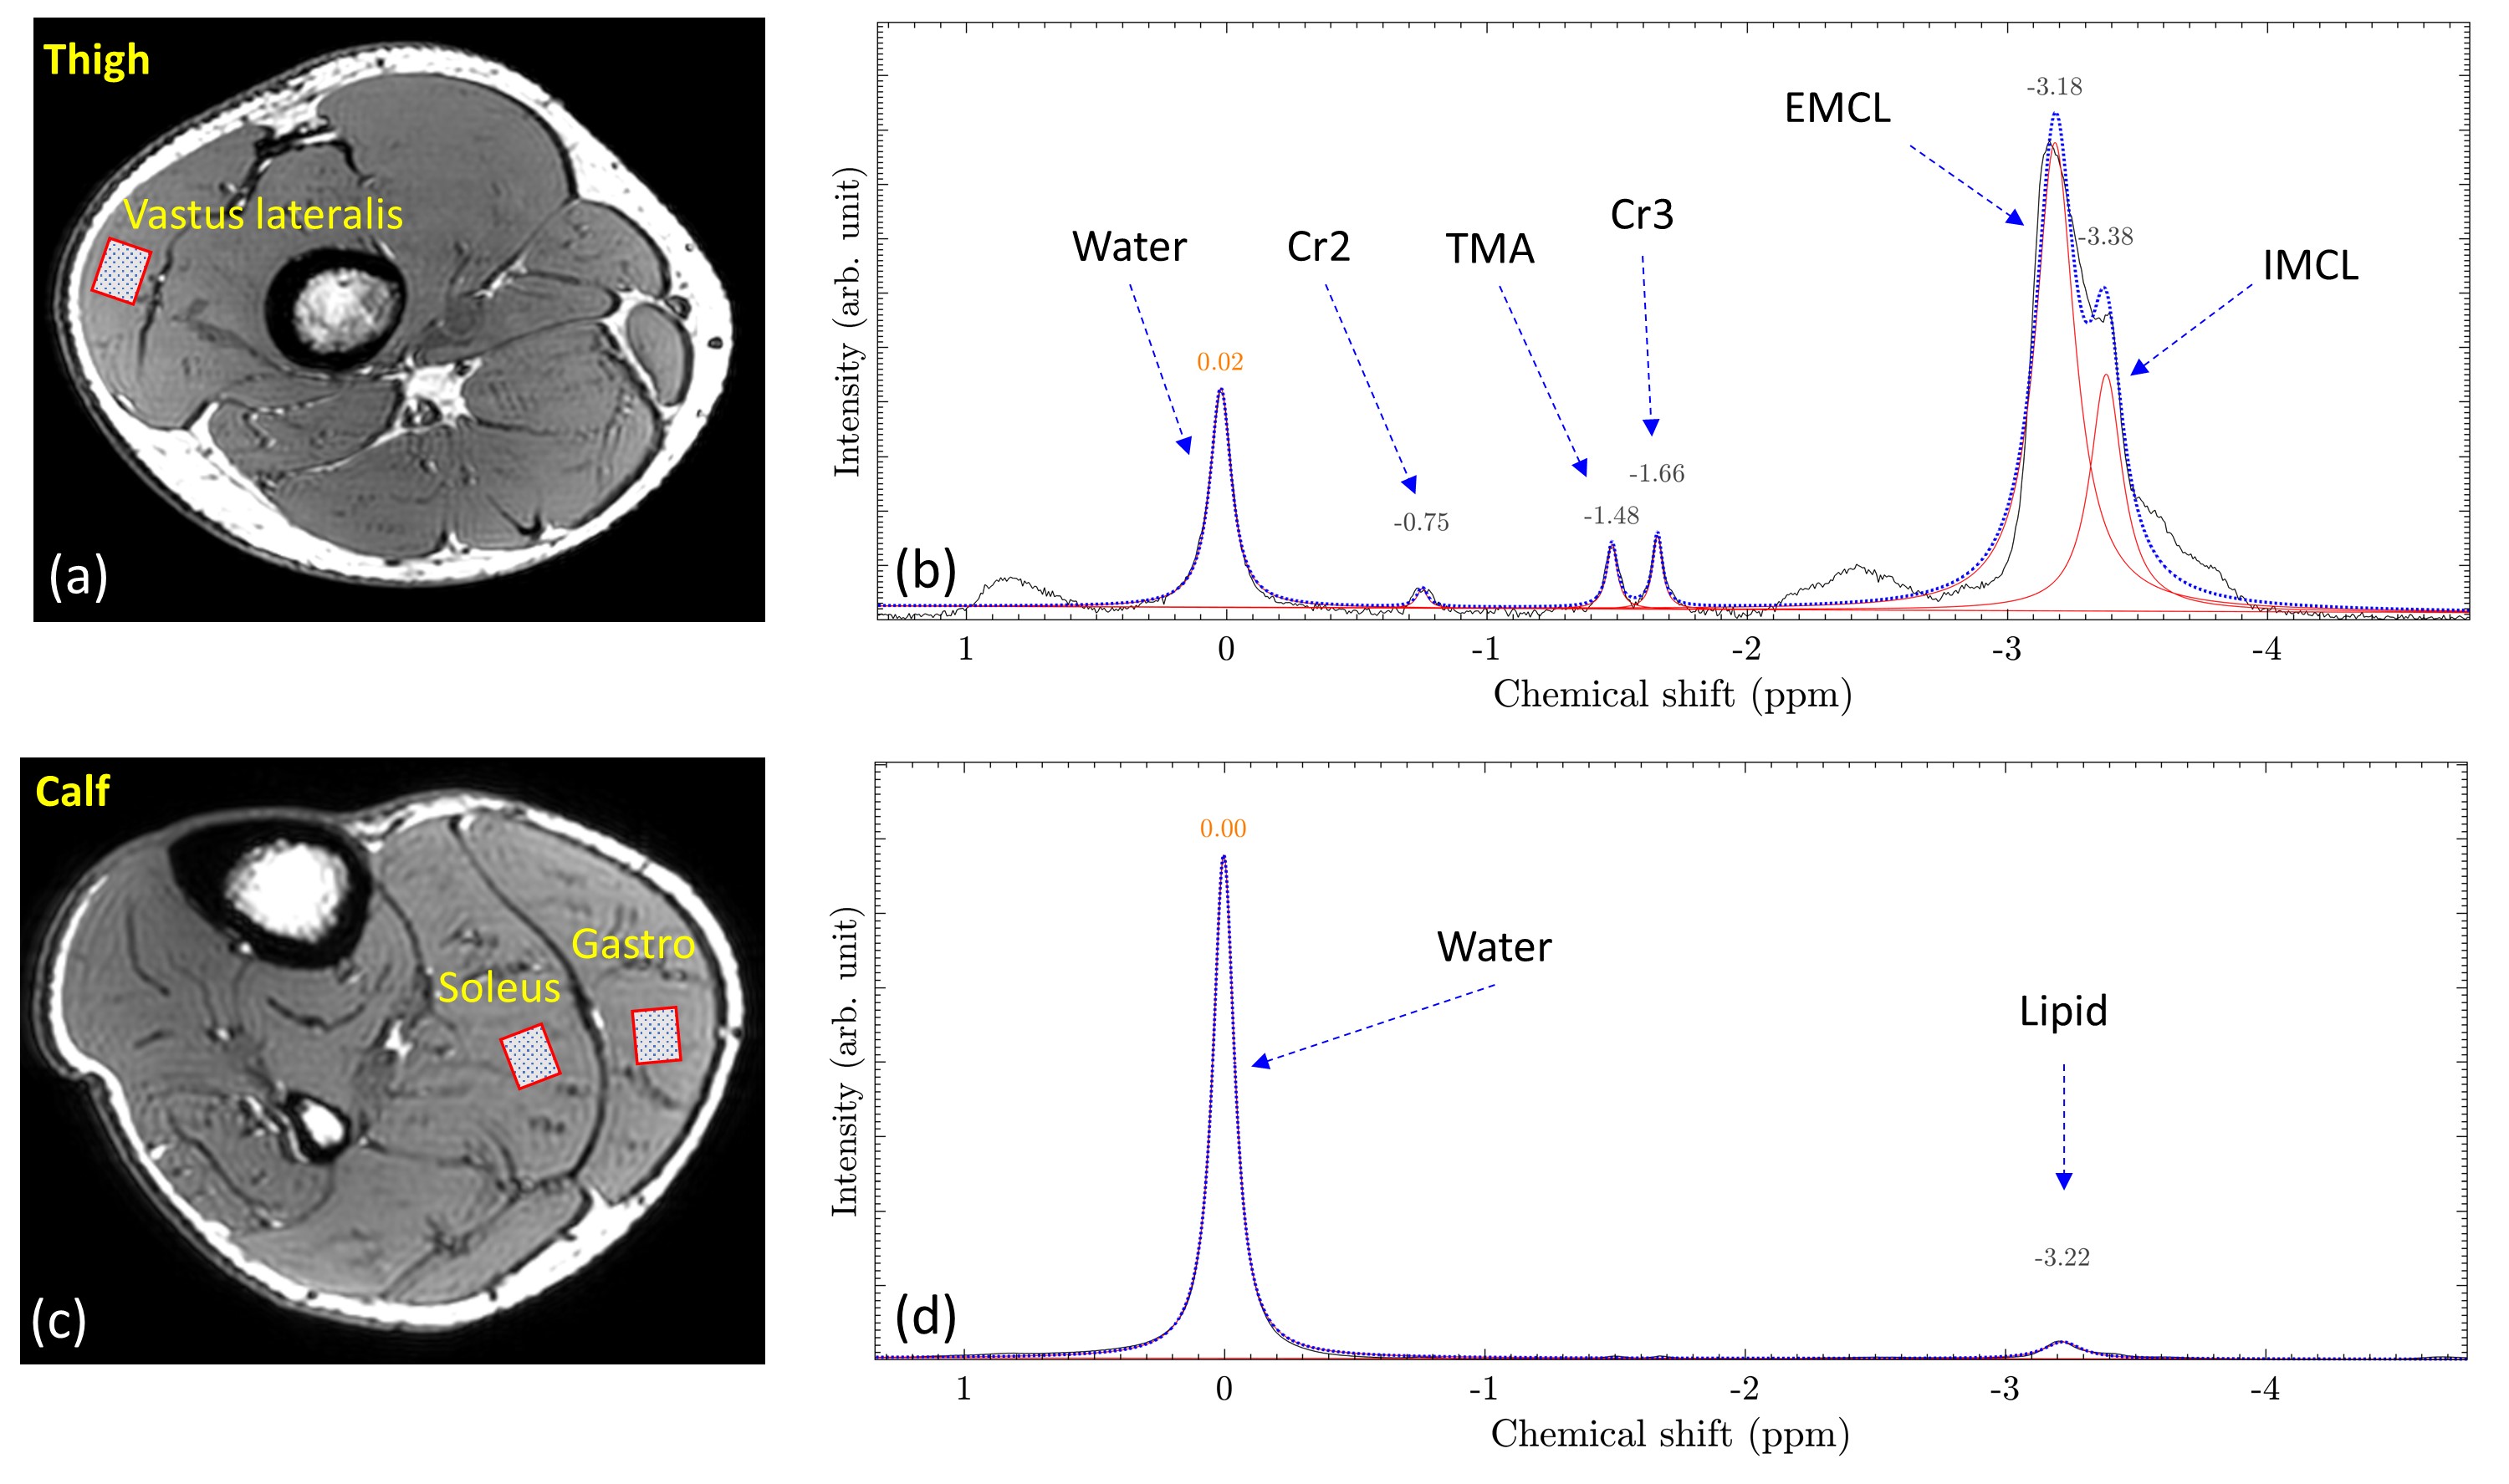
Following IRB approval, 14 subjects (7 controls, 4 CKD, and 3 dialysis patients; 8M/6F, age = 58±12 years old) were included in the study. All experiments were performed using a 16 channel T/R knee coil on a 3T clinical scanner (Ingenia Elition, Philips Healthcare, The Netherlands). For each subject, 3D MAPSS T1ρ imaging,7 point resolved spectroscopy (PRESS) (see Figure 1a and 1c for voxel positions), and DTI were performed at the thigh and calf (see Table 1 for detailed sequence parameters). T1ρ maps were generated on the scanner using a mono-exponential two-parameter fitting algorithm. The MRS data were exported offline for spectral peak fitting and calculation of nominal concentration of each metabolite component which is defined as the area under the fitted peak. A custom tool in Matlab (The MathWorks, Natick, MA) was developed to fit the MRS data with a linear combination of symmetric Gaussian functions. Figure 1b and 1d illustrate an example of the peak fitting for MRS data without (6 peaks: water, Cr2, TMA, Cr3, EMCL, and IMCL) and with (2 peaks: water and lipid) water suppression, respectively. ADC and FA maps were calculated on the scanner using a diffusion software package provided by the vendor. For T1ρ and DTI analysis, regions of interest (ROIs) were manually drawn at the vastus lateralis of the thigh and at the soleus and gastrocnemius of the calf. The mean and standard deviation of the T1ρ, ADC and FA in each ROI were recorded. Mann-Whitney U test was performed to compare different biomarkers between subgroups of controls, CKD and dialysis patients. The relationship between different biomarkers was tested using Pearson correlation coefficient. A p-value less than 0.05 was considered statistically significant.RESULTS
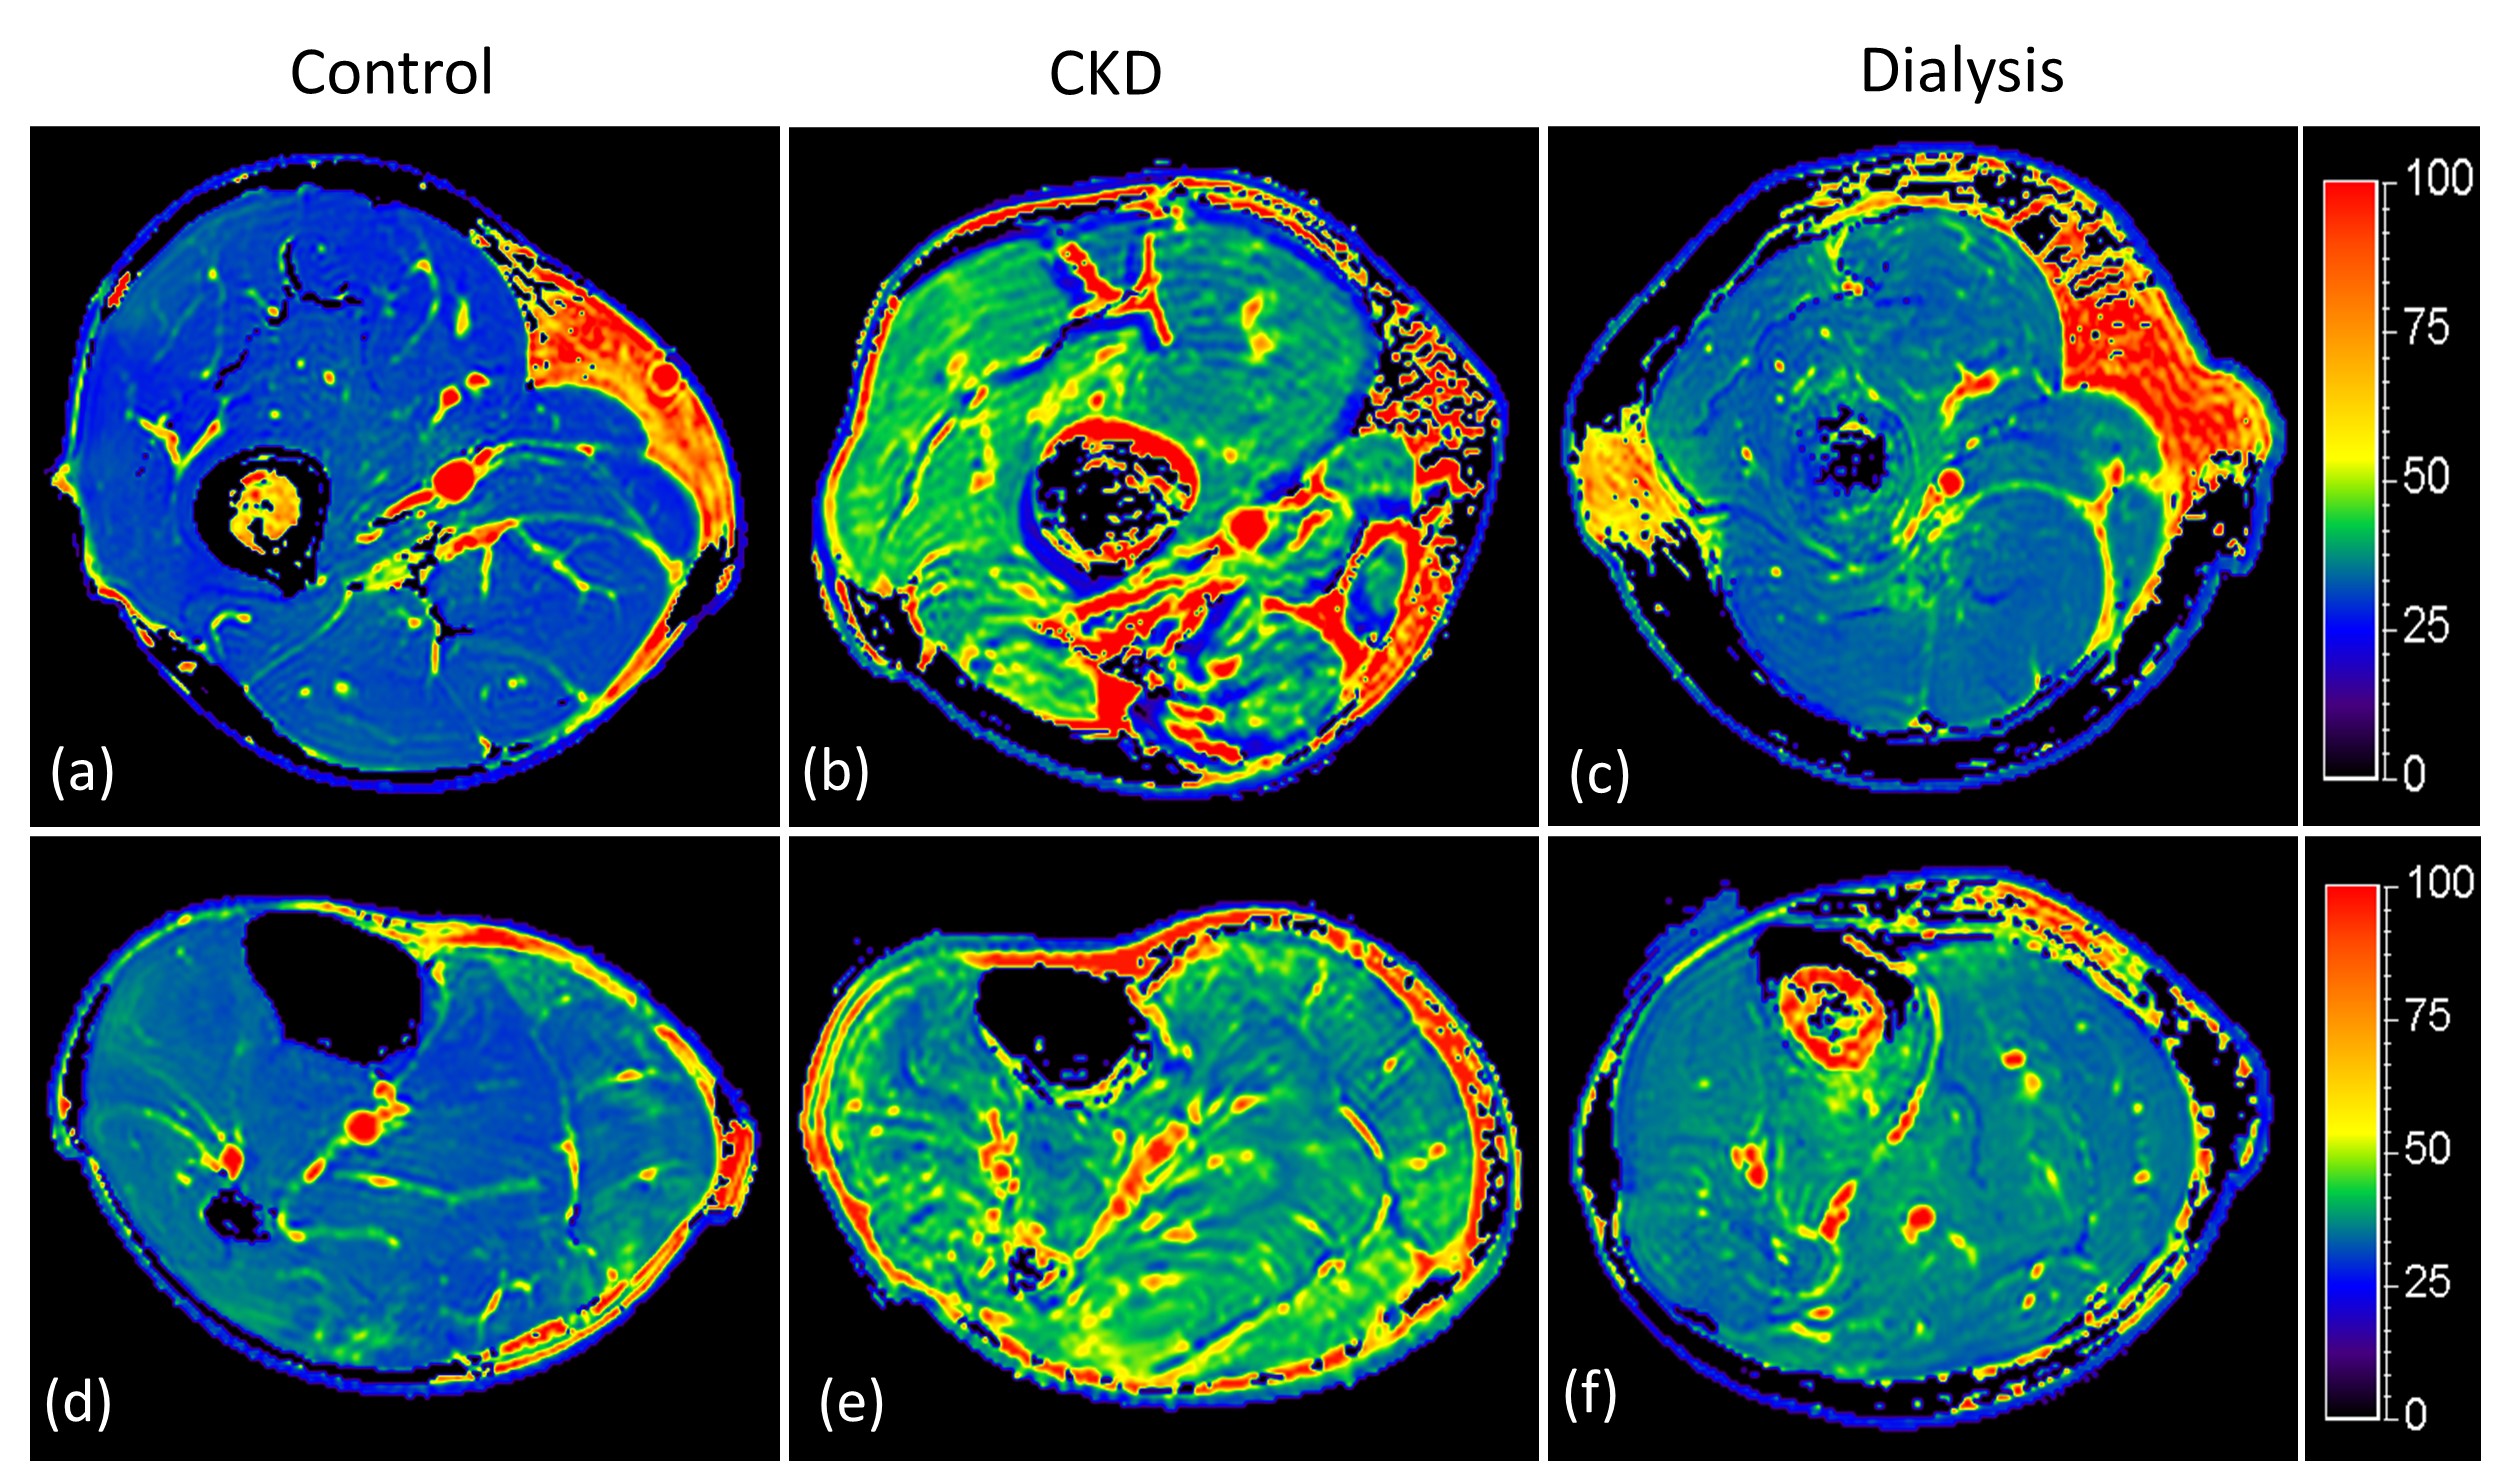
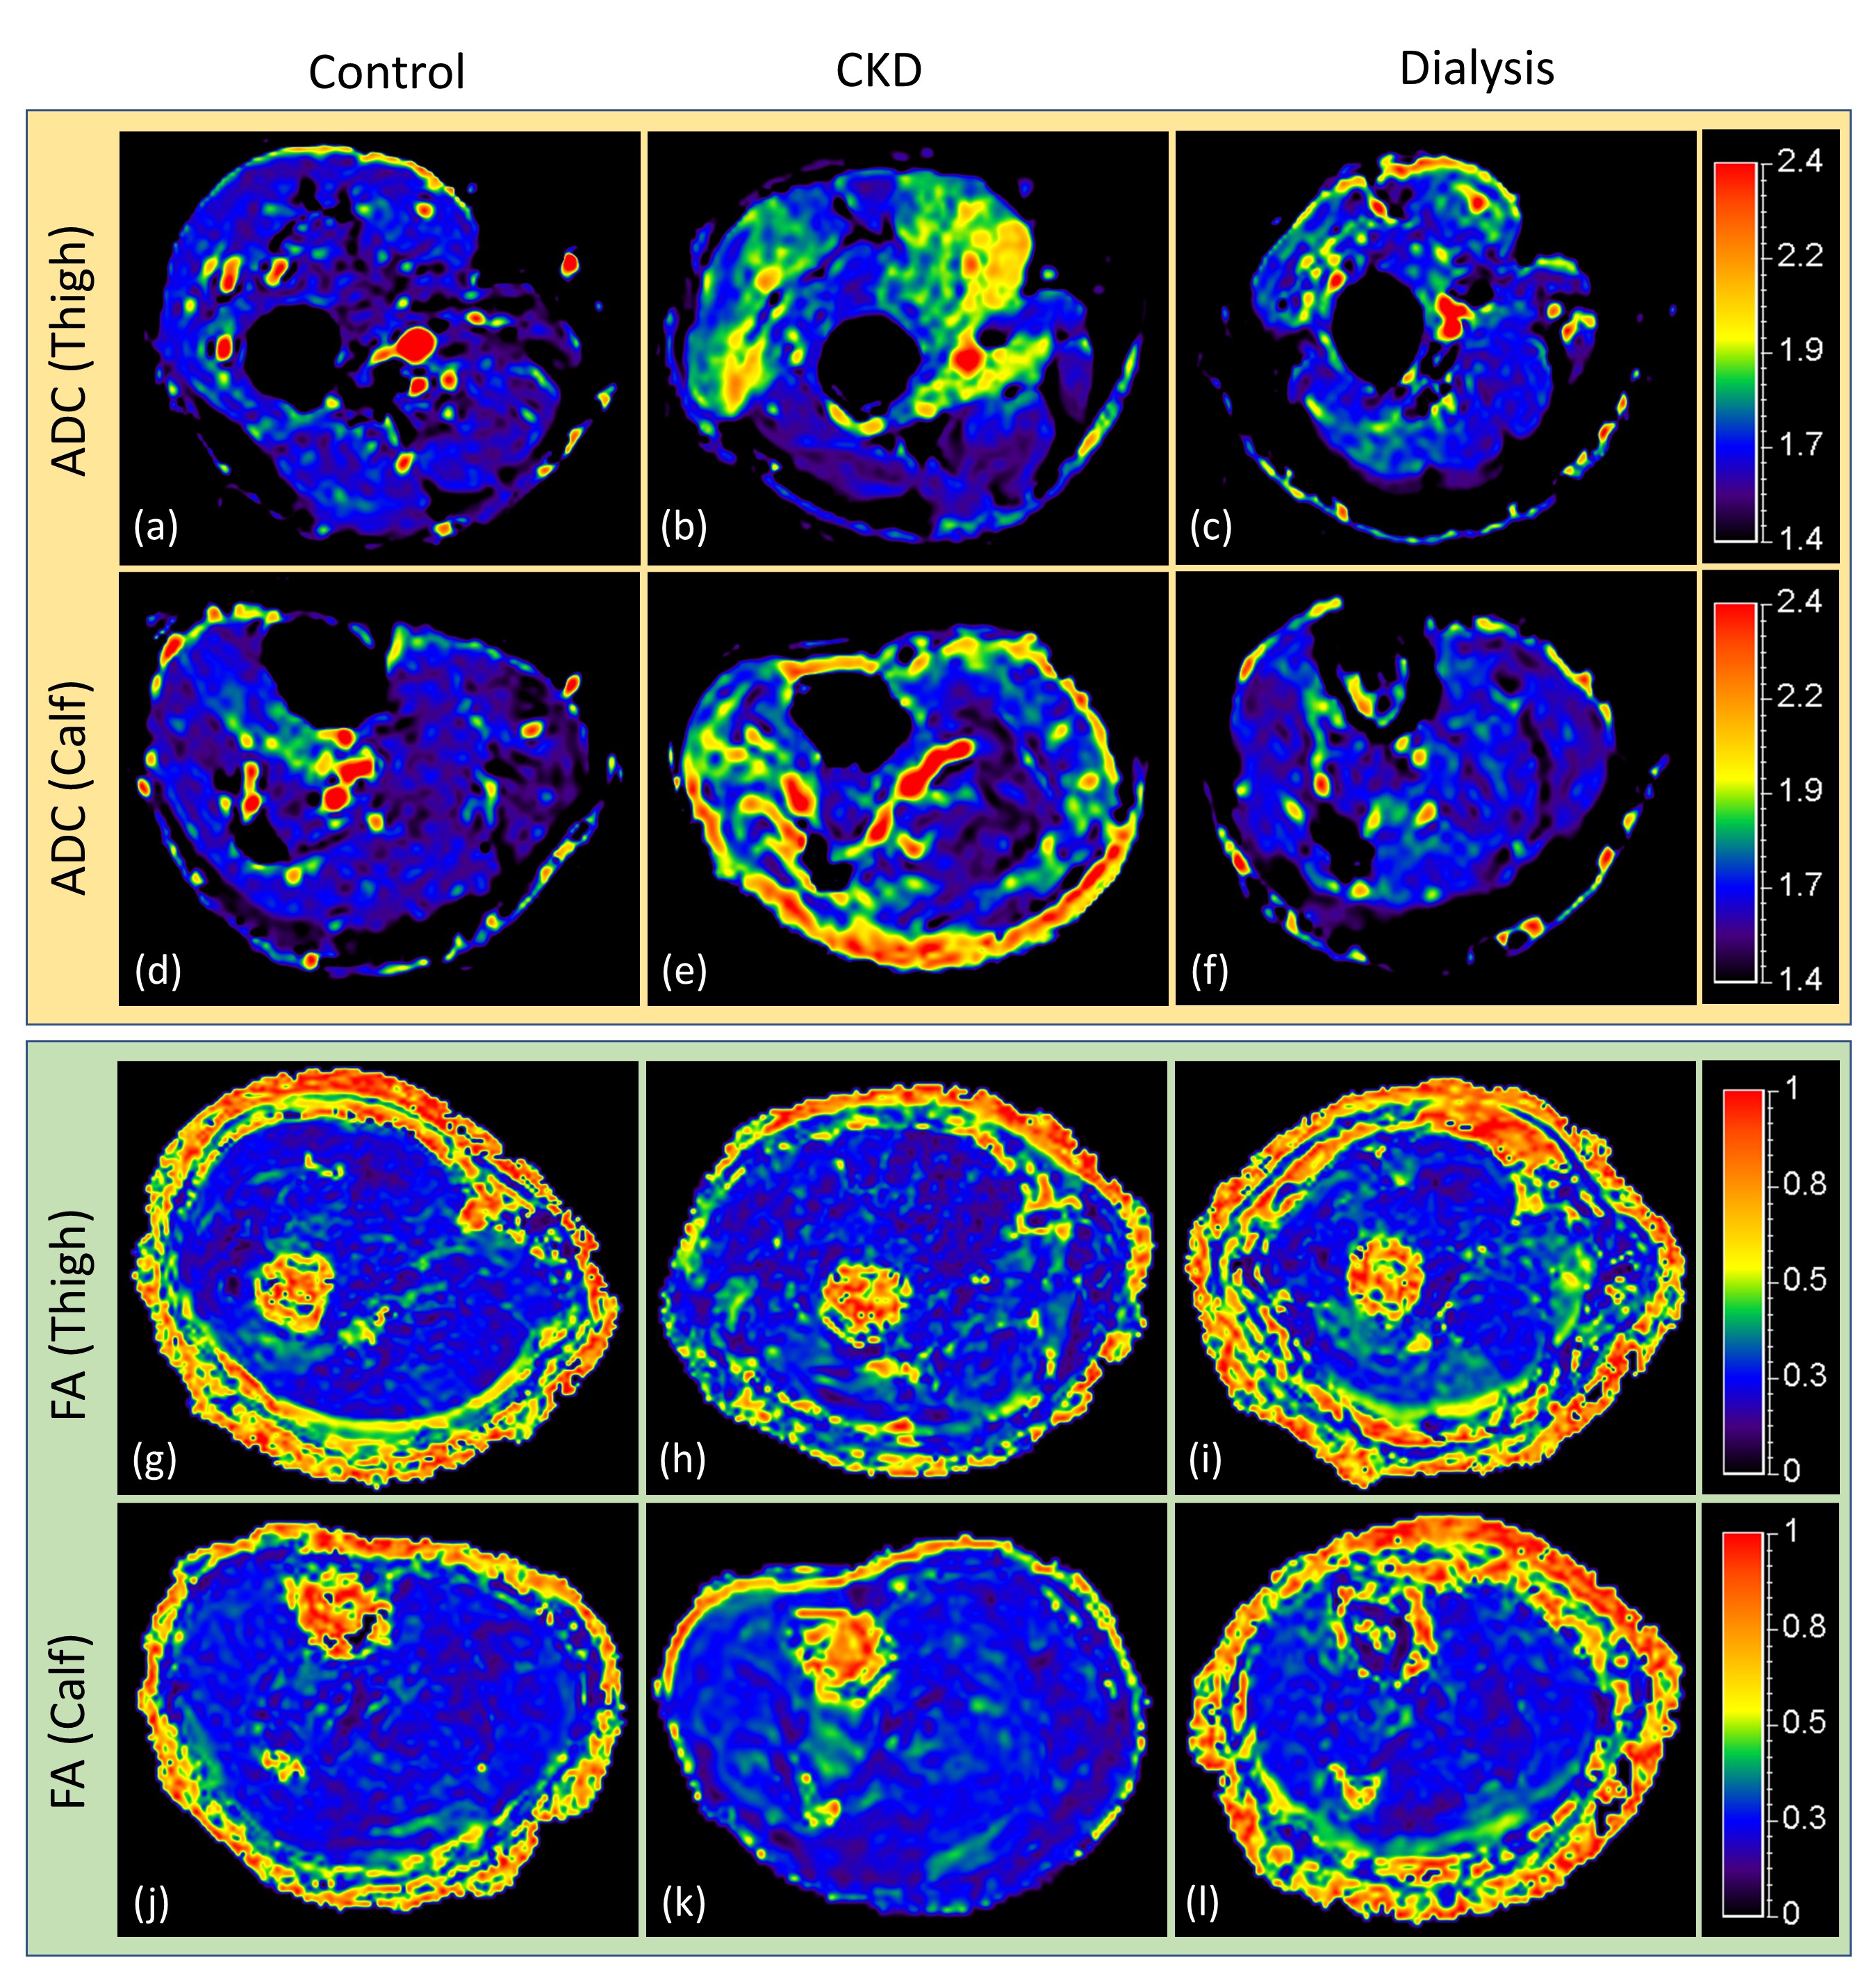
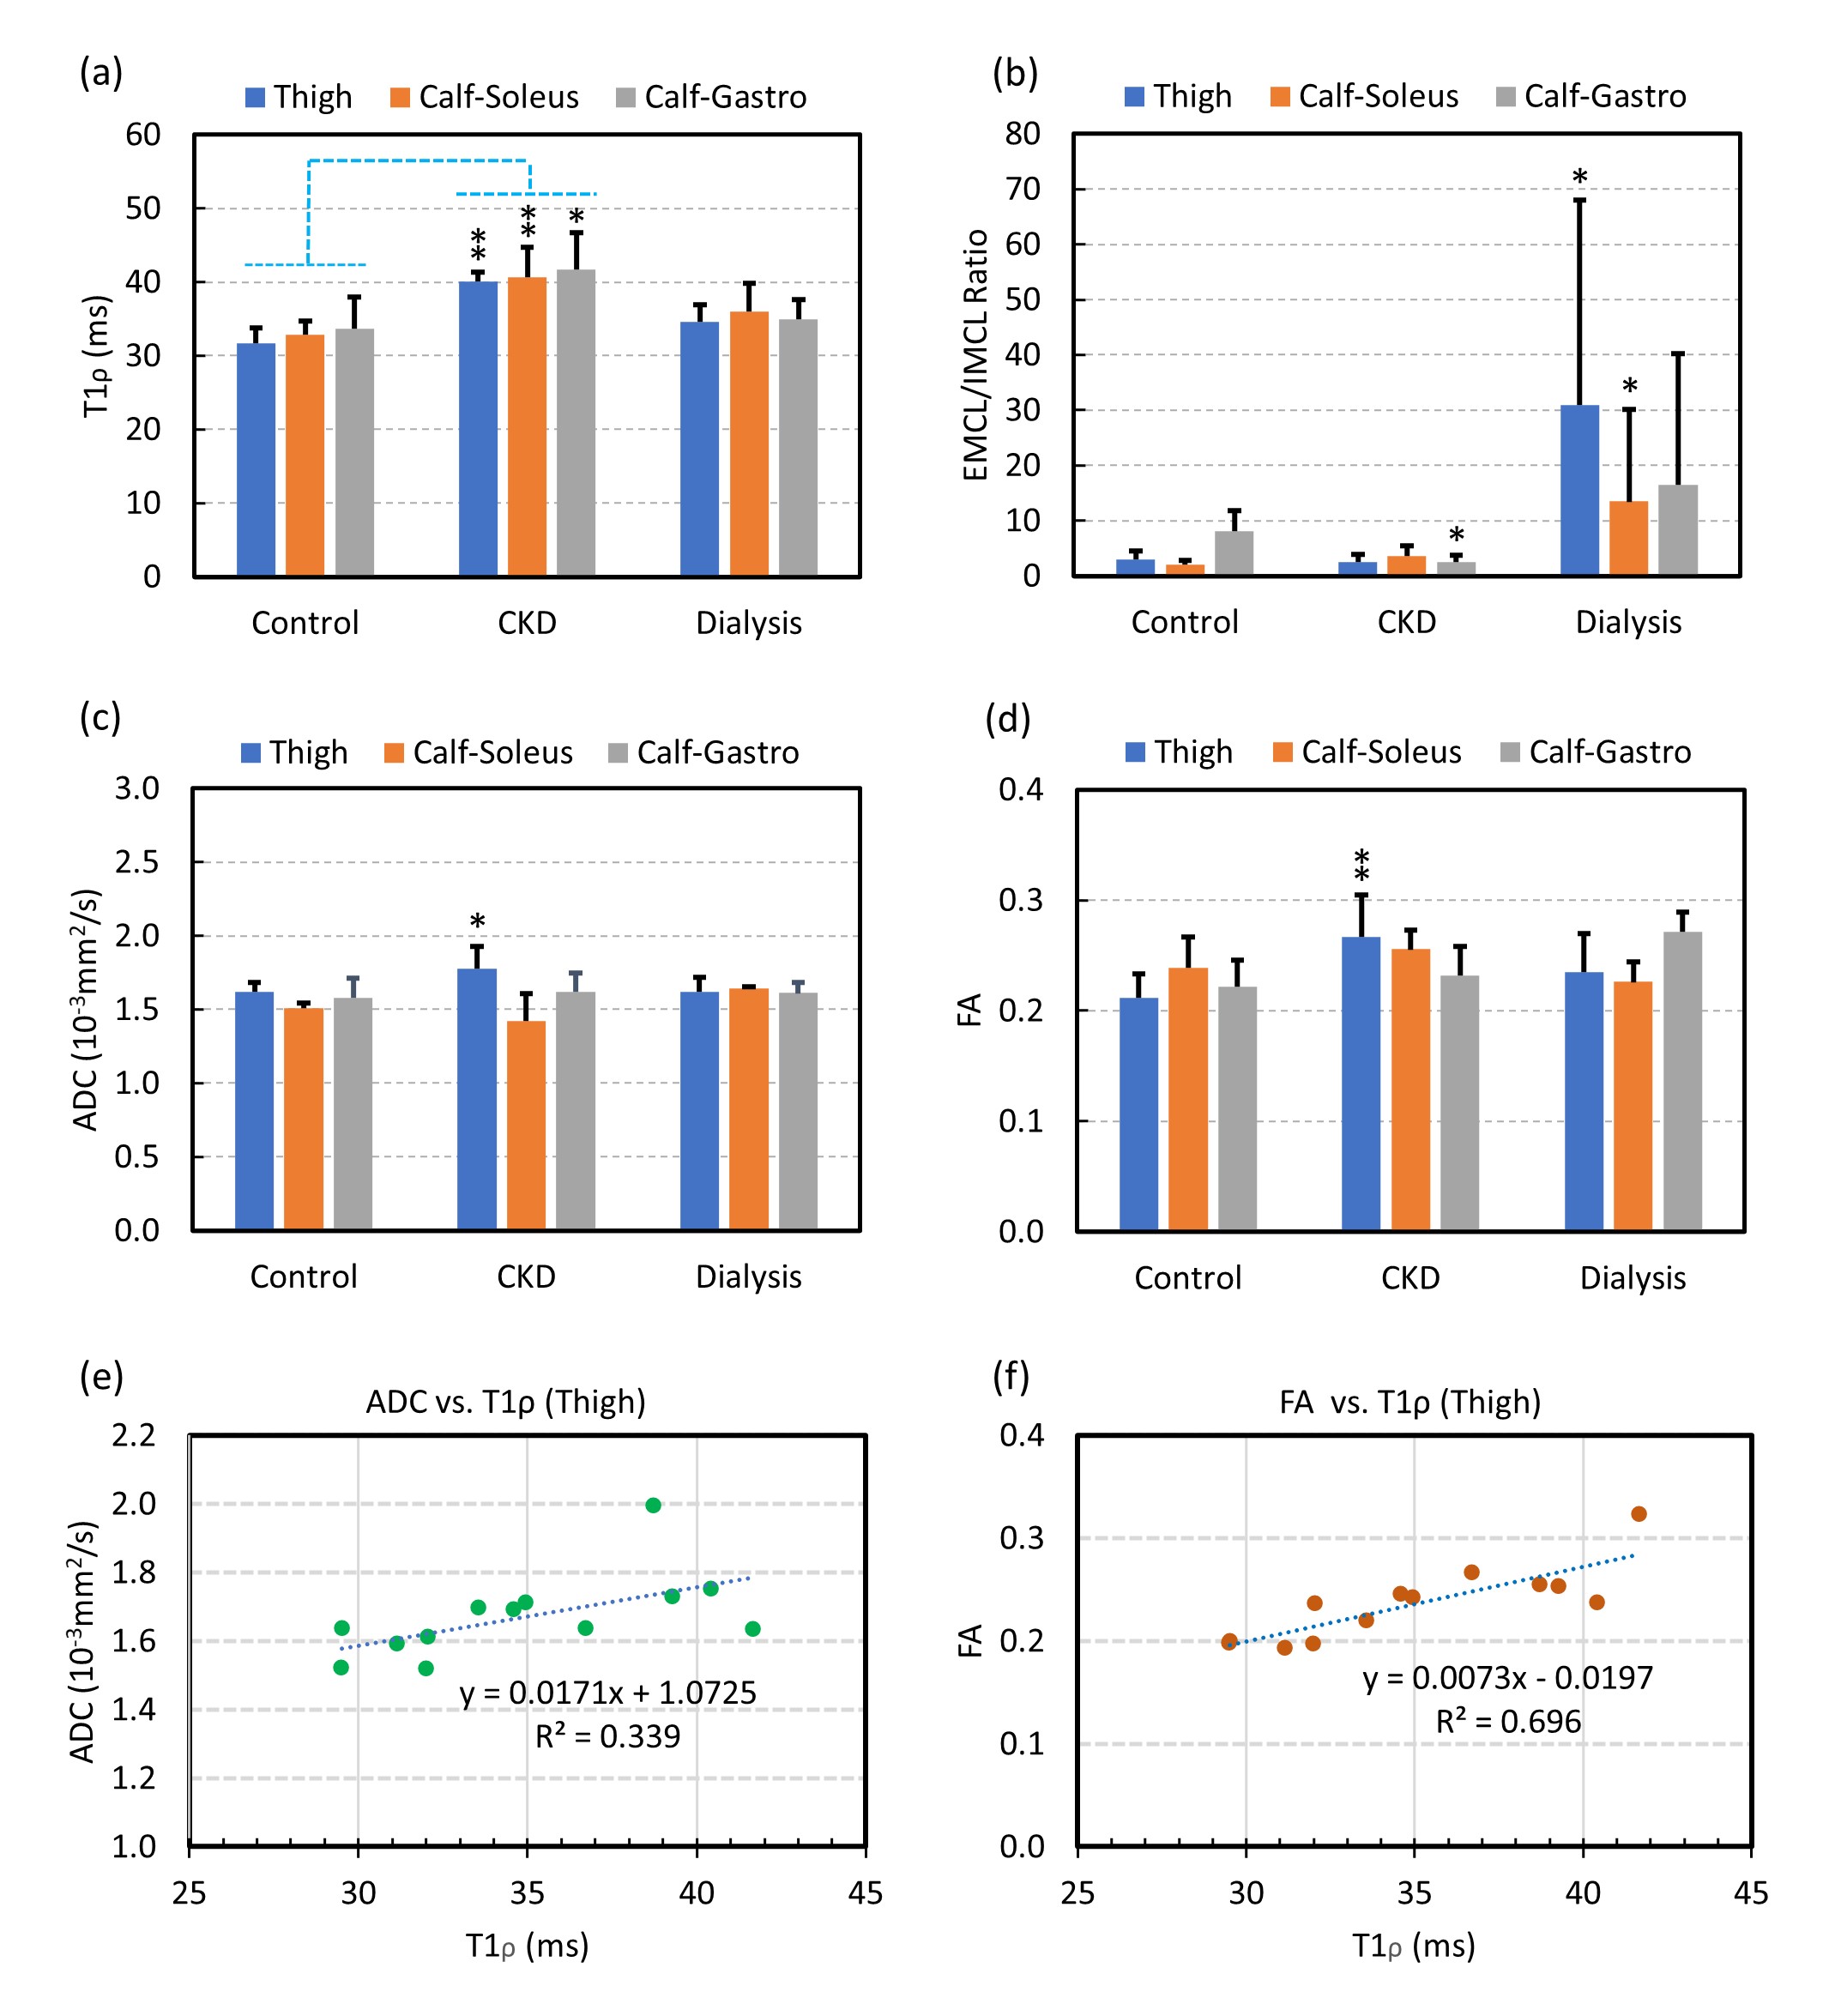
Figure 2 shows example T1ρ maps of the thigh (top row) and calf (bottom row) for a control (2a, 2d), CDK (2b, 2e) and dialysis patient (2c, 2f). Increased T1ρ was observed in the CKD patient compared to the control. Figure 3 shows example ADC and FA maps of the thigh and calf for a control (left column), CKD (middle column) and dialysis patient (right column). Elevated ADC (Figure 3b, 3e) can be observed in the CKD patient, but the difference was not obvious for FA maps (Figure 3h, 3k). Quantitative results revealed significantly increased T1ρ in all three muscles (thigh: p = 0.007; soleus: p = 0.007; gastrocnemius: p = 0.021) in CKD patients compared to controls (Figure 4a), but the difference between dialysis patients and controls was not significant. Figure 4b shows significantly increased EMCL/IMCL ratio of the thigh (p = 0.034) and soleus (p = 0.014)) in dialysis patients compared to controls, but no similar increase was observed in CKD patients. In contrast, there was a significant decrease in EMCL/IMCL ratio of the gastrocnemius (p = 0.012) in CKD patients compared to controls. For DTI biomarkers, significantly increased ADC (Figure 4c) and FA (Figure 4d) were observed in the thigh of CKD patients compared to controls. There was no significant correlation between T1ρ and MRS biomarkers. However, significant correlations were observed in the thigh between DTI biomarkers and T1ρ (Figure 4e: ADC-T1ρ, R2 = 0.339, p = 0.0368; Figure 4f: FA-T1ρ, R2 = 0.696, p = 0.0004).DISCUSSION
To the best of our knowledge, there were no previous studies using multimodal MR methods to quantitatively evaluate skeletal muscle in CKD and to compare the biomarkers with controls. In this study, T1ρ mapping, MRS and DTI were combined to systematically assess changes in skeletal muscle in CKD and dialysis patients compared to controls. The results demonstrated significant differences of biomarkers derived from all three MR techniques, mostly in the thigh of CKD patients compared to controls. In addition, significant correlations were observed between T1ρ and DTI biomarkers. The study is limited by the small number of subjects and not having biopsy to corroborate the changes in muscle. Future work is warranted to further investigate the connection of these quantitative biomarkers to histology findings and patient outcome.CONCLUSION
T1ρ, metabolite concentration from MRS, ADC and FA are promising quantitative biomarkers to probe changes in skeletal muscle in patients with CKD and dialysis. A multimodal MR protocol with combined quantitative biomarkers may provide new insights into impaired skeletal muscle function in CKD patients.Acknowledgements
This work is supported by the National Institute of Diabetes and Digestive and Kidney Diseases (K23DK099438, R03DK116023).References
1. Avin KG, Moorthi RN. Bone is not alone: the effects of skeletal muscle dysfunction in chronic kidney disease. Curr Osteoporos Rep 2015; 13(3): 173-179.
2. Kim J, Mamoto K, Lartey R, Xu K, Nakamura K, Shin W, Winalski CS, Obuchowski N, Tanaka M, Bahroos E, Link TM, Hardy PA, Peng Q, Reddy R, Botto-van Bemden A, Liu K, Peters RD, Wu C, Li X. Multi-vendor multi-site T1ρ and T2 quantification of knee cartilage. Osteoarthritis Cartilage. 2020; 28(12):1539-1550.
3. Menon RG, Sharafi A, Windschuh J, Regatte RR. Bi-exponential 3D-T1ρ mapping of whole brain at 3T. Sci Rep 2018; 8:1176.
4. Sharafi A, Change G, Regatte RR. Bi-component T1ρ and T2 relaxation mapping of skeletal muscle in-vivo. Sci Rep 2017; 7:14115.
5. Krssak M, Lindeboom L, Schrauwen-Hinderling V, Szczepaniak LS, Derave W, Lundbom J, Befroy D, Schick F, Machann J, Kreis R, Boesch C. Proton magnetic resonance spectroscopy in skeletal muscle: experts’ consensus recommendations. NMR Biomed 2020; 5:e4266.
6. Heemskerk AM, Damon BM. Diffusion tensor MRI assessment of skeletal muscle arthitecture. Curr Med Imaging Rev 2015; 3(3):151-160.
7. Li X, Han ET, Busse RF, Majumdar S. In vivo T1ρ mapping in cartilage using 3D magnetization-prepared angle modulated partitioned k-space spoiled gradient echo snapshots (3D MAPSS). Magn Reson Med. 2008; 59(2):298-307.
Figures