0585
Quantitative muscle MRI in monitoring disease progression and nusinersen treatment effects in spinal muscular atrophy1Department of Neurology, UMC Utrecht Brain Center, University Medical Center, Utrecht, Utrecht, Netherlands, 2Department of Radiology, University Medical Center Utrecht, the Netherlands, Utrecht, Netherlands, 3Biostatistics & Research Support, Julius Center for Health Sciences and Primary Care, University Medical Center Utrecht, Utrecht, Netherlands, 4Department of Neurology and Child Neurology, UMC Utrecht Brain Center, University Medical Center, Utrecht, Utrecht, Netherlands, 5Department of Child Development and Exercise Center, University Medical Center Utrecht, the Netherlands, Utrecht, Netherlands
Synopsis
Quantitative MRI of muscles allows to measure disease progression or to assess therapeutic effects in neuromuscular diseases. We executed two studies on patients with spinal muscular atrophy, treated and untreated, with a protocol consisting of DIXON, T2 mapping and DTI on a 3T MR scanner. In treatment-naïve adult patients we demonstrated that qMRI was able to measure subclinical disease progression. In young children with SMA, quantitative MR parameters of the DIXON and DTI sequence showed ongoing fatty infiltration and normalization of thigh muscle microstructure during the first year of nusinersen treatment.
Background
Quantitative MRI of muscles allows to measure disease progression or to assess therapeutic effects in neuromuscular diseases. Longitudinal imaging studies to evaluate the sensitivity of qMRI in detecting disease progression in spinal muscular atrophy are lacking but essential. Especially with experimental methods such as qMRI there is a need for reference data, preferably of treatment-naïve patients. As treatment is becoming available for patients, there is subsequent fewer opportunity to obtain data on natural history of disease progression. Nusinersen is the first approved treatment for SMA and is a cellular SMN protein enhancing treatment that is intrathecally delivered to target motor neurons and has been shown to improve motor function in children with SMA.1.2 Treatment effects could be reflected in changes in muscle. In this longitudinal study we used a cohort of treatment positive and naïve SMA patients to investigate the value of qMRI parameters for the monitoring of natural disease progression and treatment effects.Methods
We included 10 treatment-naïve patients; 5 had SMA type 2 (onset between 6-18 months, able to sit independently at any moment in life)(mean age 21.6 ± 7.0 years) and 5 SMA type 3 (onset after 18 months, able to walk independently at any moment in life)(mean age 33.4 ± 11.9 years).3 Mean duration was 13.1 months (min-max 368-442 days) between baseline and follow-up scan. Additionally, we enrolled 8 consecutive children with genetically confirmed SMA before the start of treatment with nusinersen; 4 children had SMA type 2 and 4 had SMA type 3. Mean age was 9.0 years (range 7.6 - 13.8 years). We scanned them at baseline, before starting treatment, and during the first year of treatment (at 4th injection at 2 months and at 6th injection at 10 months), see figure 1.MR acquisition
MR datasets of both legs were acquired on a 3T MR scanner (Philips Ingenia, Philips Medical Systems, the Netherlands) in supine position, with a 12-channel posterior and 16 channel anterior body coil. Images were acquired with a FOV of 15cm and aligned with the femur, starting 17,5cm from the femoral head or centered mid-femoral in case of severe contractures or in young children. The MR scanning protocol was ~10 minutes and has shown reproducibility in a previous multicenter study4 and comprised: i. 4-point DIXON (TR/TE/ 210/2.6/3.36/4.12/4.88 ms; flip angle 10°; voxel size 1x1.5x1.5; no gap; 25 slices) ii. T2 mapping (17 echoes TR/TE/ΔTE 4598/17/7.6; flip angle 90/180°; voxel size 1x3x3; slice gap 6mm; 13 slices, no fat suppression) iii. SE-EPI (TR/TE 5000/57 ms; b-value 0 s/mm2; voxel size 1x3x3; no gap; 25 slices, 8 dynamics, SPAIR and SPIR fat suppression).
MR processing
We processed MR data using the custom toolbox QMRITools for Mathematica (mfroeling.github.io/QMRITools).5 A detailed description of the processing steps have been outlined in previous work.4,6 To ensure a match of the muscle segmentations at all time-points we used non rigid registration of the masks between timepoints (figure 2).
Results
In treatment-naïve adults; there was an increase in fat fraction of all muscles over time (slope +1.3 %/time; 95%-CI 0.51 – 2.05) (figure 3). T2 decreased from 28.2 ms (SE 0.2) to 28.0 ms (SE 0.2, p=0.07). MD did not change significantly, FA of the adductor longus and biceps femoris (short head) showed a significant decrease of 0.03 (p<0.01). Contractile cross-sectional area (CSA) decreased with 0.23 cm2 over time (p=0.016). Clinical scores of motor function and muscle strength were not significantly different between baseline and follow-up.In children under treatment (figure 4), we observed an increase in fat fraction (+3.2%, p=0.02) of thigh muscles except for the m. adductor longus. DTI parameters decreased in the hamstrings (baseline MD 1.59, slope -0.09 *10-3 mm2/s, p=0.007; baseline AD 2.16 slope -0.19 *10-3 mm2/s, p<0.001), with similar trends in other muscle groups. T2 showed no significant changes over time (-0.7 ms, p=0.3). We did not find a significant decrease in contractile CSA over time (+0.04 cm2, p=0.6).
Discussion
Longitudinal imaging data show slow disease progression in skeletal muscle of the thigh of treatment-naïve adult patients with spinal muscular atrophy despite stable strength and motor function scores. The increase in fat fraction seems to occur at the expense of contractile muscle tissue. We think the decrease in T2 is related to the bias of a simultaneous increase of fat fraction, as increasing fat replacement results in lowering of T2.6–8In children under treatment, we demonstrated ongoing fatty infiltration of thigh muscles during the first year of treatment, that was not at the cost of contractile muscle tissue. In contrast to observations in treatment-naïve patients, DTI parameters decreased to values observed in healthy muscle, which might indicate changes in microstructure of the muscle that possibly marks normalization of muscle microstructure.
In both adults and children, we observed a bimodal distribution (figure 3) in the level of fatty infiltration and, muscles with low fat fractions at baseline deteriorated at a slower pace than muscle with higher fat content.
Conclusion
Quantitative MRI of muscle measured disease progression, and served as biomarker for effects of treatment at tissue level. Methods to overcome misalignment of scans, such as applied in these studies, are indispensable when performing longitudinal imaging studies.Acknowledgements
We thank all SMA patients and their families for their participation. We thank Christa van Ekris for her assistance. This work was supported by the Prinses Beatrix Spierfonds (Grant no. W.OR16-06). The Dutch SMA register is supported by stichting Spieren voor Spieren.References
1. Finkel RS, Mercuri E, Darras BT, et al. Nusinersen versus sham control in infantile-onset spinal muscular atrophy. N Engl J Med. 2017;377:1723-1732. doi:10.1056/NEJMoa1702752
2. Mercuri E, Darras BT, Chiriboga CA, et al. Nusinersen versus sham control in later-onset spinal muscular atrophy. N Engl J Med. 2018;378(7):625-635. doi:10.1056/NEJMoa1710504
3. Wadman RI, Wijngaarde CA, Stam M, et al. Muscle strength and motor function throughout life in a cross-sectional cohort of 180 patients with spinal muscular atrophy types 1c–4. Eur J Neurol. 2018;25(3):512-518. doi:10.1111/ene.13534
4. Schlaffke L, Rehmann R, Rohm M, et al. Multicenter evaluation of stability and reproducibility of quantitative MRI measures in healthy calf muscles. NMR Biomed. Published online 2019:1-14. doi:10.1002/nbm.4119
5. Froeling M. QMRTools: a Mathematica toolbox for quantitative MRI analysis. J Open Source Softw. Published online 2019. doi:10.21105/joss.01204
6. Otto LAM, van der Pol W-L, Schlaffke L, et al. Quantitative MRI of skeletal muscle in a cross-sectional cohort of Spinal Muscular Atrophy patients with types 2-3. NMR Biomed. Published online 2020. doi:10.1002/nbm.4357
7. Keene KR, Beenakker JM, Hooijmans MT, et al. T 2 relaxation‐time mapping in healthy and diseased skeletal muscle using extended phase graph algorithms . Magn Reson Med. Published online 2020. doi:10.1002/mrm.28290
8. Schlaeger S, Weidlich D, Klupp E, et al. Decreased water T2 in fatty infiltrated skeletal muscles of patients with neuromuscular diseases. NMR Biomed. 2019;32(8). doi:10.1002/nbm.4111
Figures
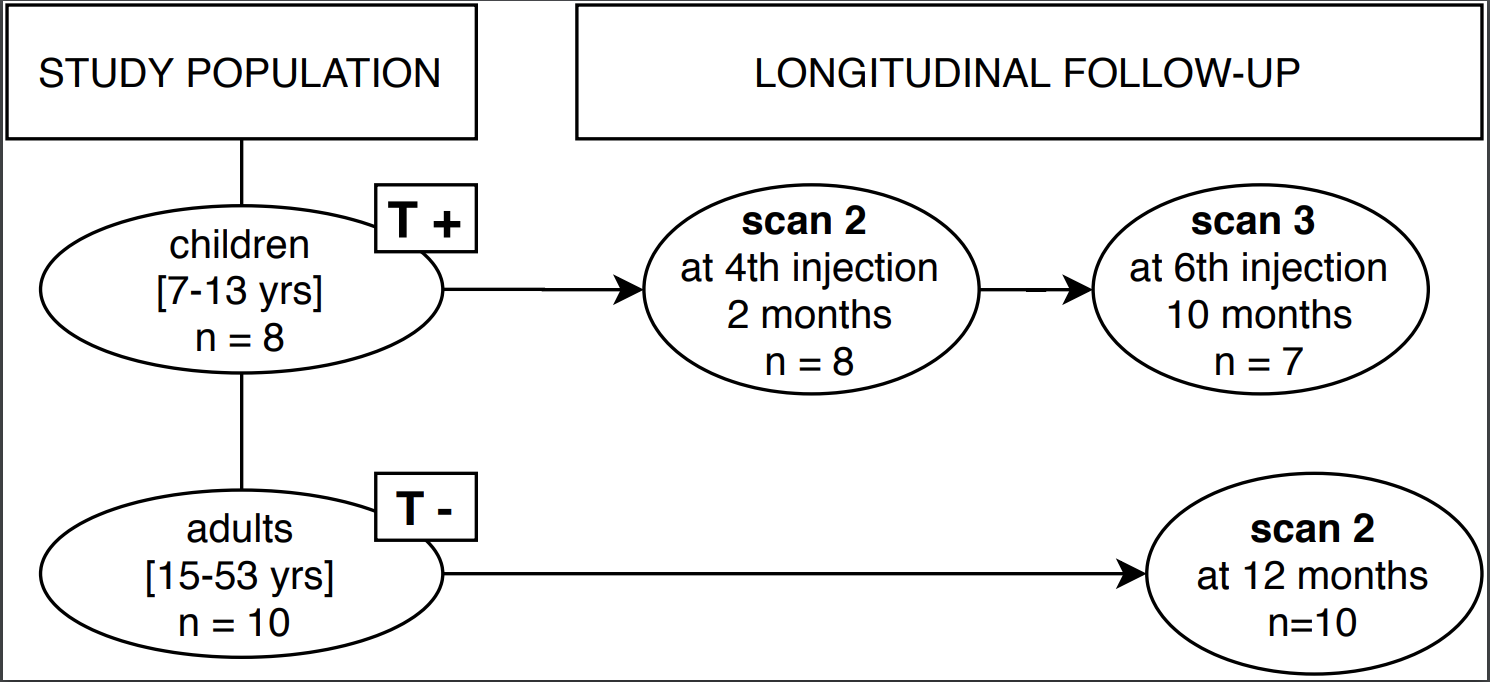
T+ = treatment positive, T- = treatment-naïve
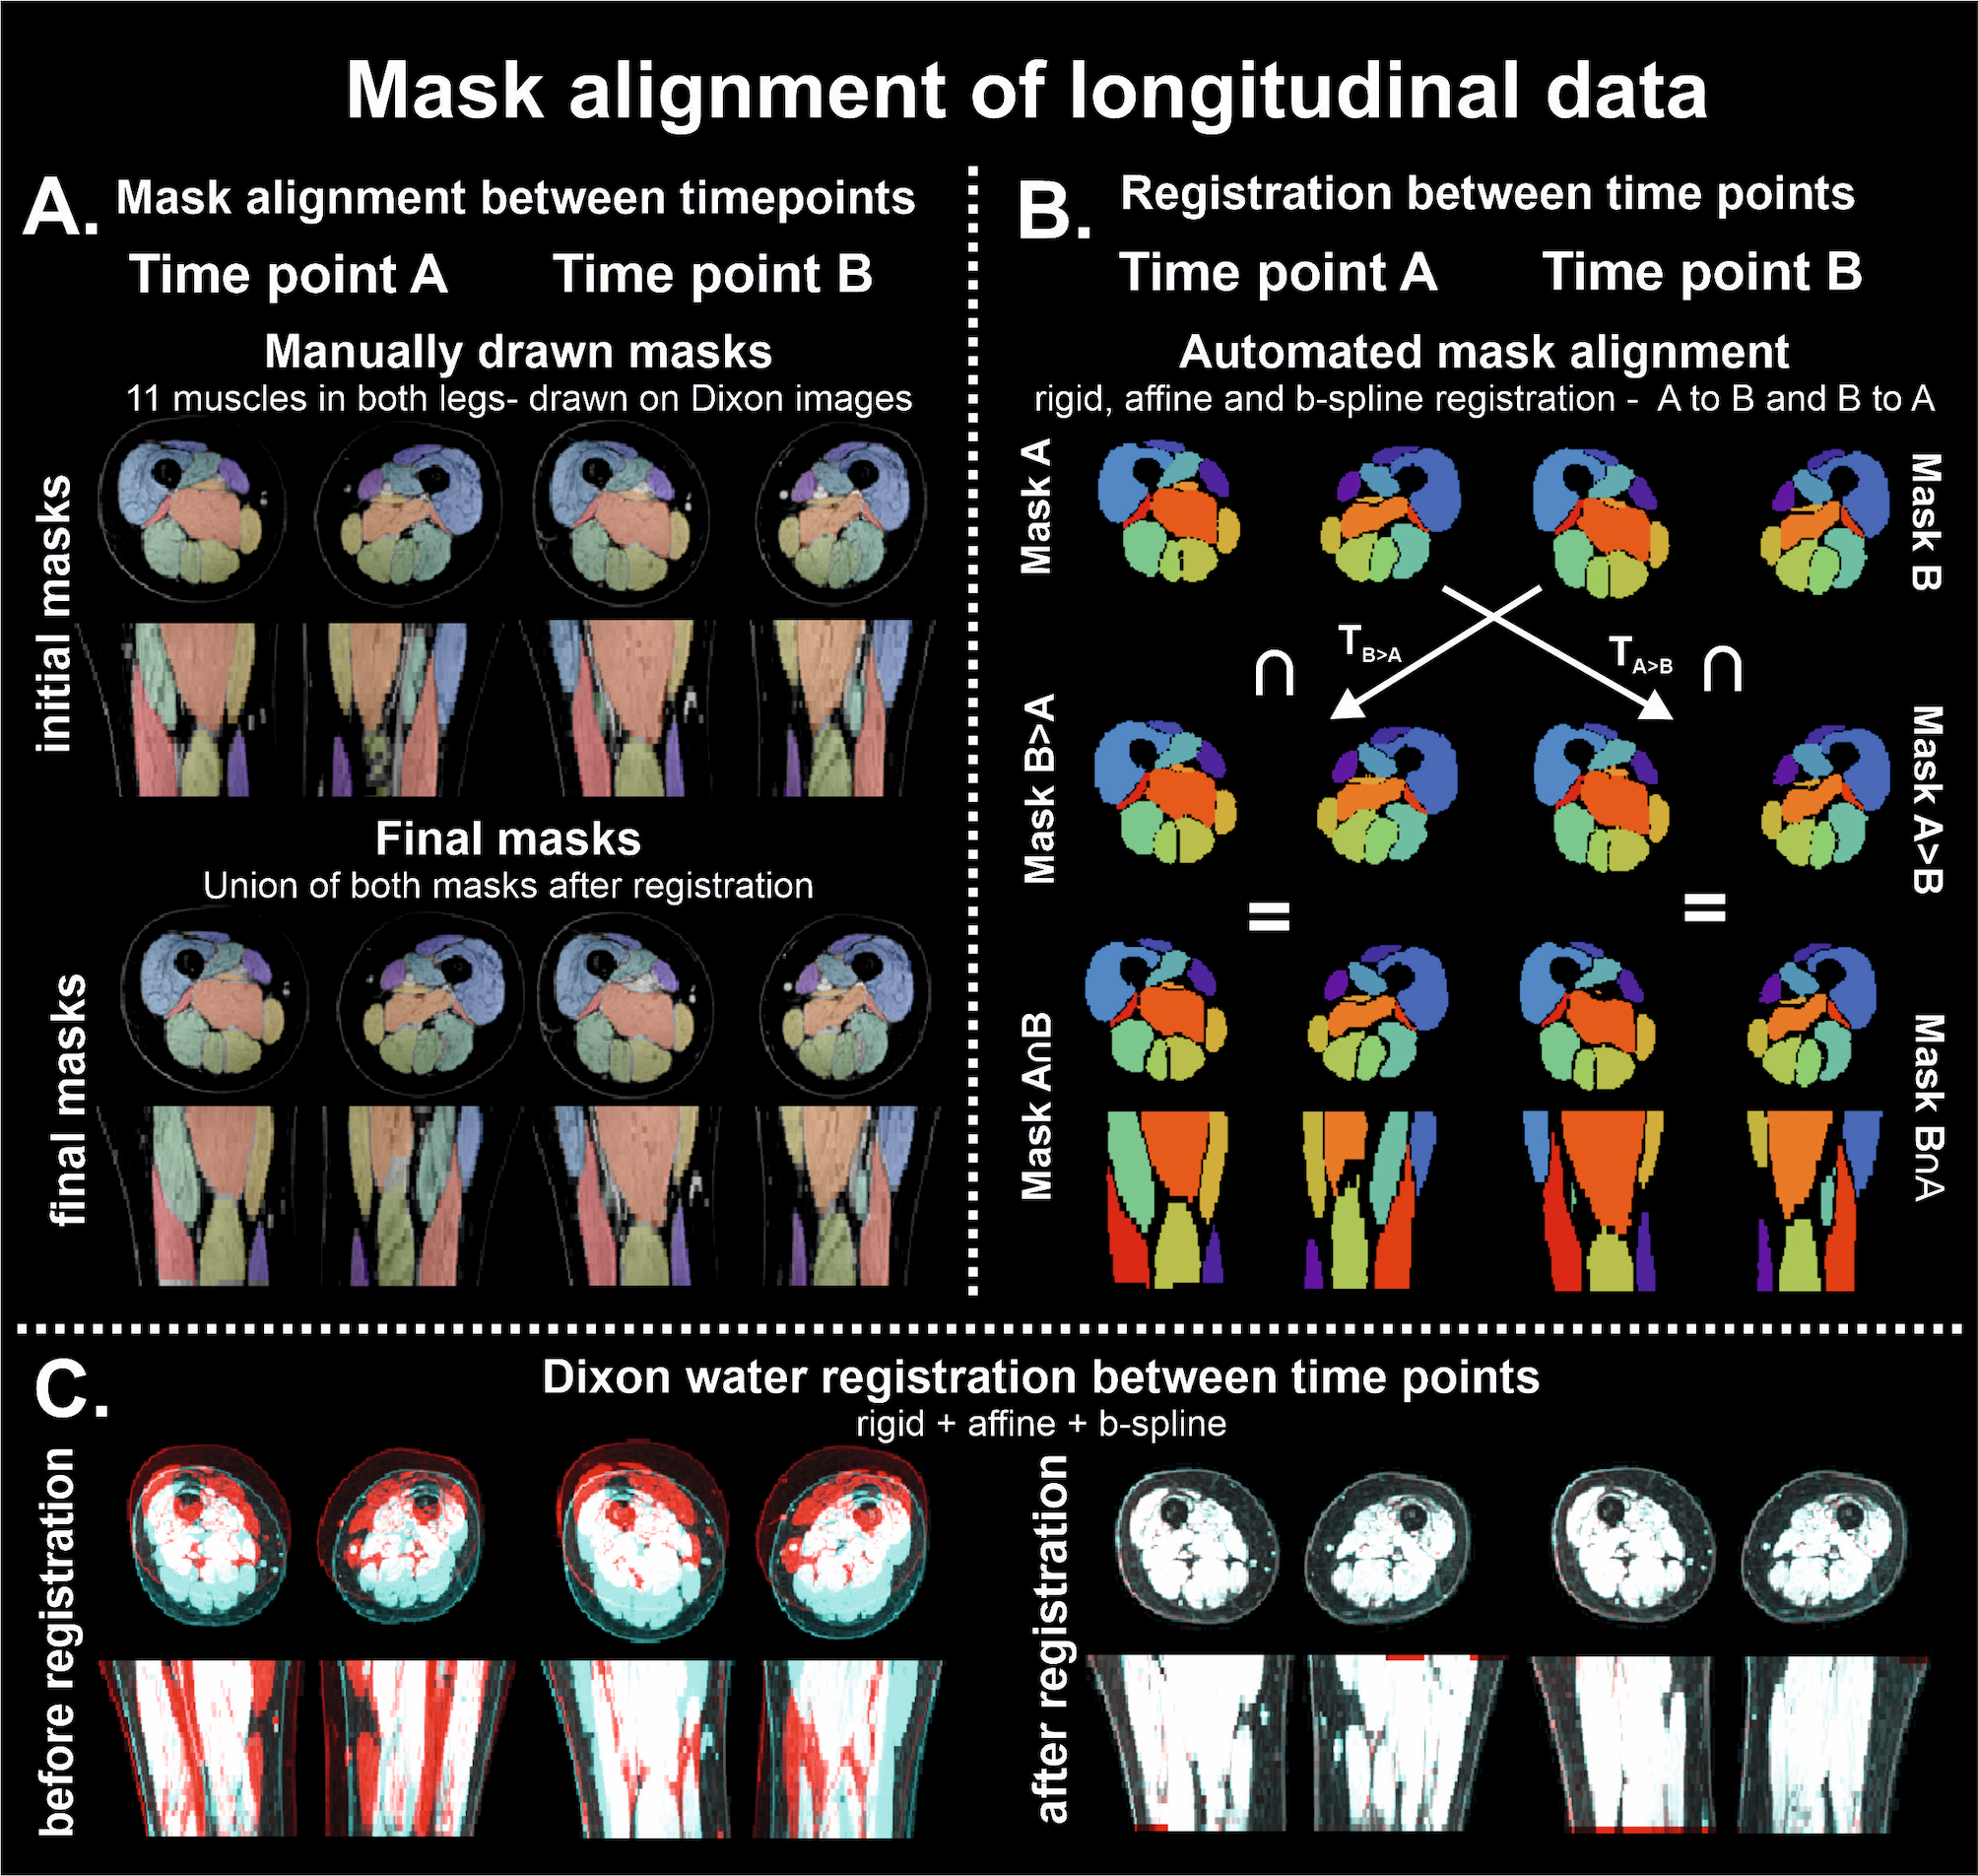
Illustration of pipeline and steps of mask alignment of longitudinal data
The methodology of alignment of imaging stacks is illustrated by the steps involving conversion of masks; initial and final masks in panel A and automated steps in mask alignment in panel B. In panel C, the images of time-point A and time-point B are rendered red and blue, to illustrate the incongruency between datasets before (left) and after (right) rigid, affine and b-spline registration. The non-corresponding regions can be identified as they maintain their respective color.
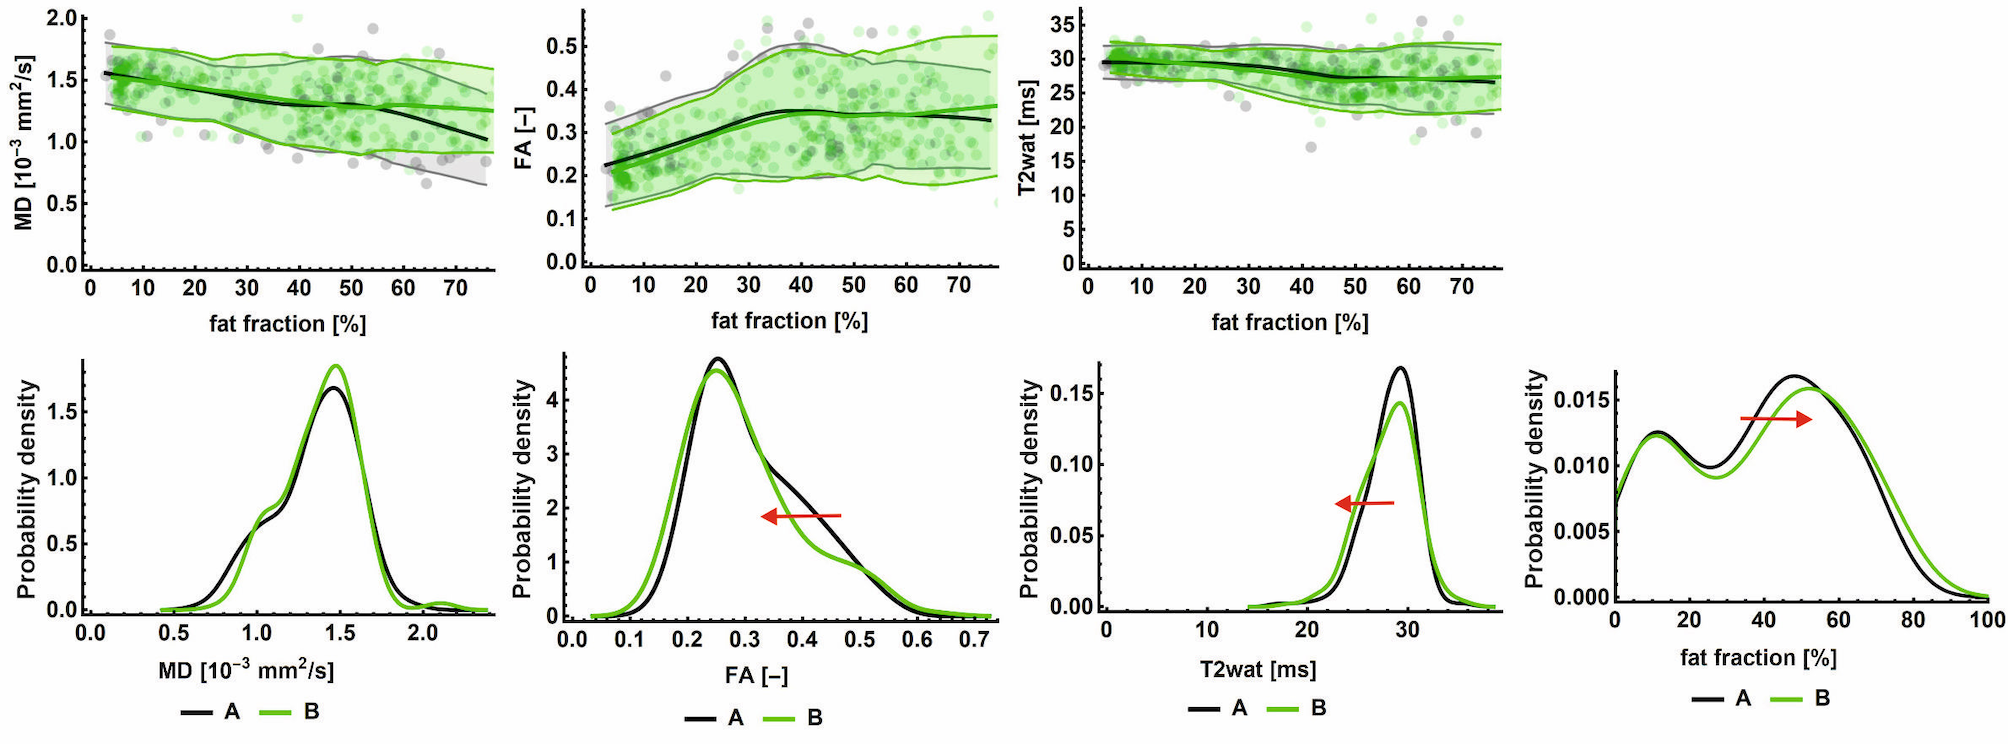
Histogram and plots of qMRI parameters of treatment-naïve cohort at both time-points
In the upper row, MD, FA and T2 are plotted against fat fraction, with each of the individual datapoints as dots, reduced to an average line using local regression with 95%-CI (shaded area). The bottom row represents the histograms of each of the qMRI parameters, the red arrow indicates significant changes and its direction. Time-point A is indicated in grey, and time-point B in green. All presented data is from the treatment-naïve cohort.
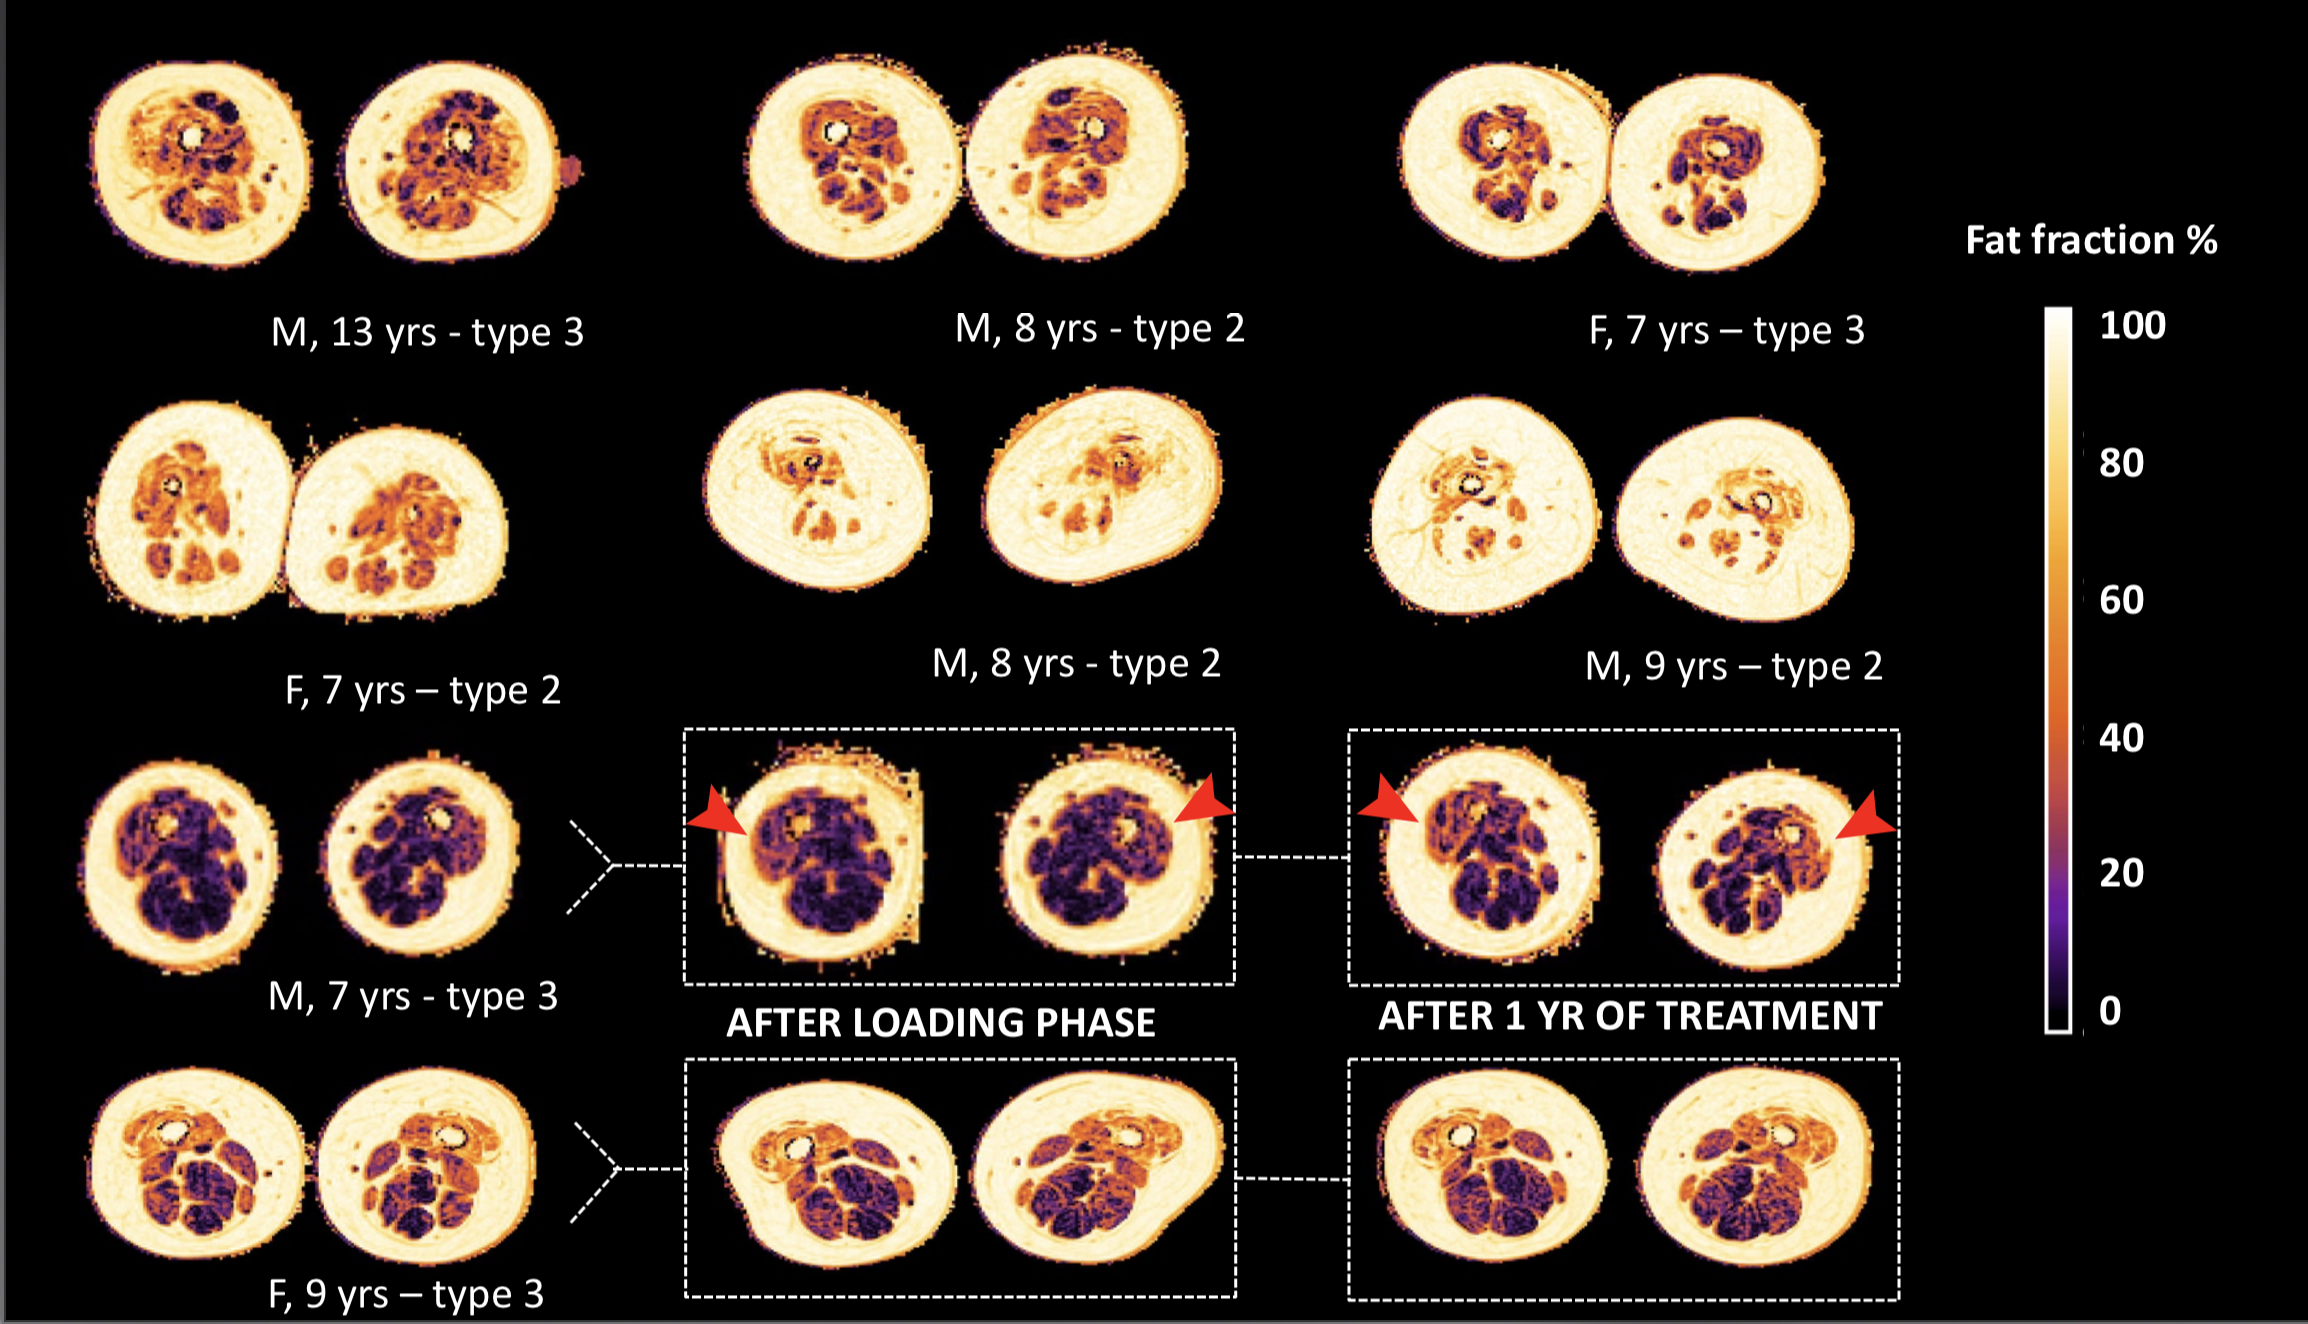
Status of fat infiltration of children at baseline, before starting treatment
Legend: M = male, F = female, yr(s) = year(s)
Overview of the status of fat infiltration of all participants in the treatment positive cohort, as measured by the DIXON sequence; in the bottom two rows we highlight the three consecutive scans of two subjects. Note the visible change of color in the anterior compartment of one male subject, as indicated by the red arrows, that indicates progression of fat infiltration.