0582
Characterization of cross-relaxation in human skeletal muscle using downfield 1H MRS at 7T1Department of Bioengineering, University of Pennsylvania, Philadelphia, PA, United States, 2Department of Radiology, University of Pennsylvania, Philadelphia, PA, United States, 3St. Jude Children's Research Hospital, Memphis, TN, United States, 4Siemens Medical Solutions USA Inc, Malven, PA, United States
Synopsis
Water suppression limits the detection of non-labile proton downfield resonances in 1H magnetic resonance spectroscopy (MRS) due to cross-relaxation with water, and the cross-relaxation properties of these resonances has yet to be quantified in human skeletal muscle. We use spectrally-selective excitation in an inversion recovery experiment to compare the apparent T1 relaxation time of downfield resonances in skeletal muscle under selective and nonselective inversion conditions at 7T. Nonselective inversion significantly prolongs the longitudinal relaxation rate of resonances found 8.0, 8.2, and 8.5 ppm. This change is larger for the resonances at 8.2 and 8.5 ppm, indicating a stronger cross-relaxation effect.
Introduction
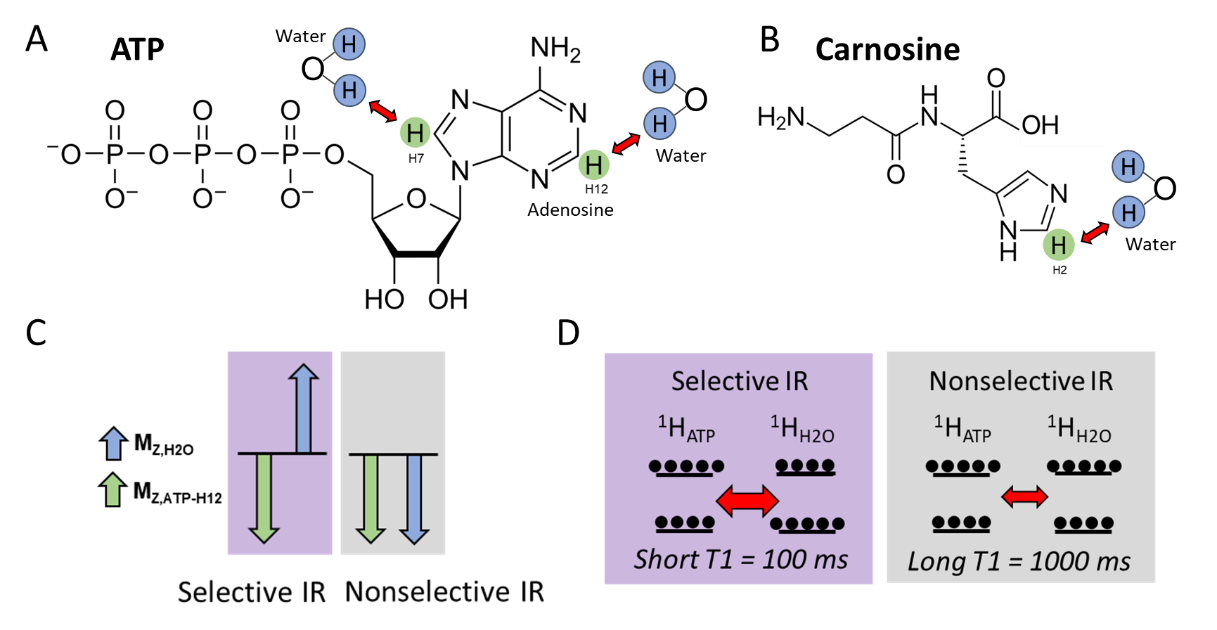
In vivo detection of 1H MRS downfield resonances (>4.7 ppm) is challenged by spectral overlap, cross-relaxation and chemical exchange with water. These effects lead to prolonged T1 recovery and rapid T2 decay, limiting signal detection when water suppression is applied. Enhanced T1 recovery has been observed in downfield metabolite signals when water suppression is not used but has not yet been quantified in human skeletal muscle.1-4 In muscle there are two peaks in the downfield spectrum at 8.2 and 8.5 ppm that may be attributed to the H12 and H7 protons of the ATP adenosine moiety, though other metabolites likely contribute to these signals as well (Fig. 1A). There is an evident peak at 8.0 ppm attributable to the H2 proton of the carnosine imidazole ring (Fig. 1B). ATP is the dominant energy currency in the human body and provides the energy for myosin head repositioning during the cross-bridge cycle in muscle cells, while carnosine is a dipeptide found in skeletal muscle which may buffer intracellular physiological pH and potentiate contractility by increasing calcium sensitivity.5,6 While carnosine may be invasively measured by biopsy, 31P MRS detection of ATP is limited by low sensitivity, low resolution, and potential contamination from other metabolites, and requires special hardware.7Objective: To characterize the cross-relaxation properties of downfield proton resonances in human skeletal muscle using spectrally-selective downfield spectroscopy.
Methods
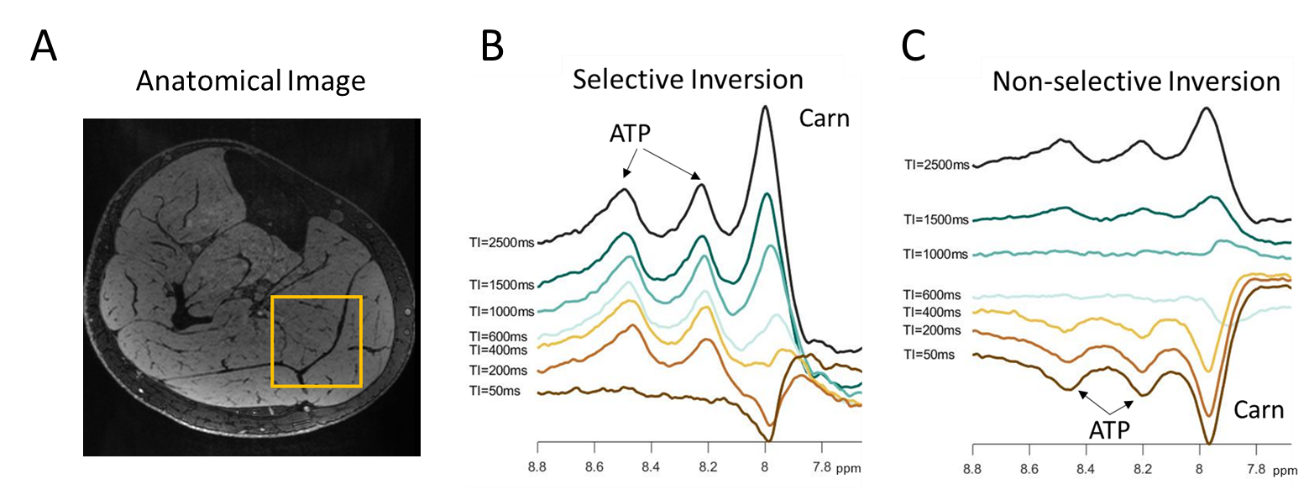
This study was approved by local IRB, and all participants gave written informed consent. We collected inversion recovery single-voxel downfield 1H MRS data from 5 healthy male and female volunteers between the ages of 24 and 39 years at 7T (MAGNETOM Terra, Siemens Healthcare, Erlangen, Germany) run in investigational mode using a prototype sequence with a 28-channel knee RF coil (Quality Electrodynamics, Mayfield Village, OH, USA). A spectrally-selective 90° E-BURP pulse8,9 centered at 9.1 ppm was used to excite the downfield metabolites (30x30x30mm3 voxel, TR/TE: 7000/20 ms, 32 averages, BW: 600Hz), and 3 narrow spatially selective refocusing 180° Shinnar-Le Roux (SLR) pulses (BW: 800Hz) were used for localization. The voxel was positioned in the superficial posterior compartment of the calf and included soleus and gastrocnemius muscles (Fig. 2A). Prior to excitation, the initial magnetization configuration was manipulated using a 180° pulse to invert only metabolites (selective sinc pulse, BW: 660 Hz) or metabolites and water (non-selective hyperbolic secant pulse, BW: 4000 Hz) with inversion times of 50-2500 ms (Fig. 1C and 1D). Spectra were frequency aligned using a water spectrum for reference and metabolite peaks were individually phase corrected. The magnetization of each metabolite resonance was measured as the integral under the peak. T1 was measured from selective and non-selective inversion recovery curves using a 3-parameter fit with least-squares minimization of the following equation: $$$S=A-Be^{-TI/C}$$$. The distribution of each set of T1 values was assessed for normality using the Shapiro-Wilk test. Paired t-tests were used to compare T1 measured with selective and nonselective inversion and results were Bonferroni corrected.Results
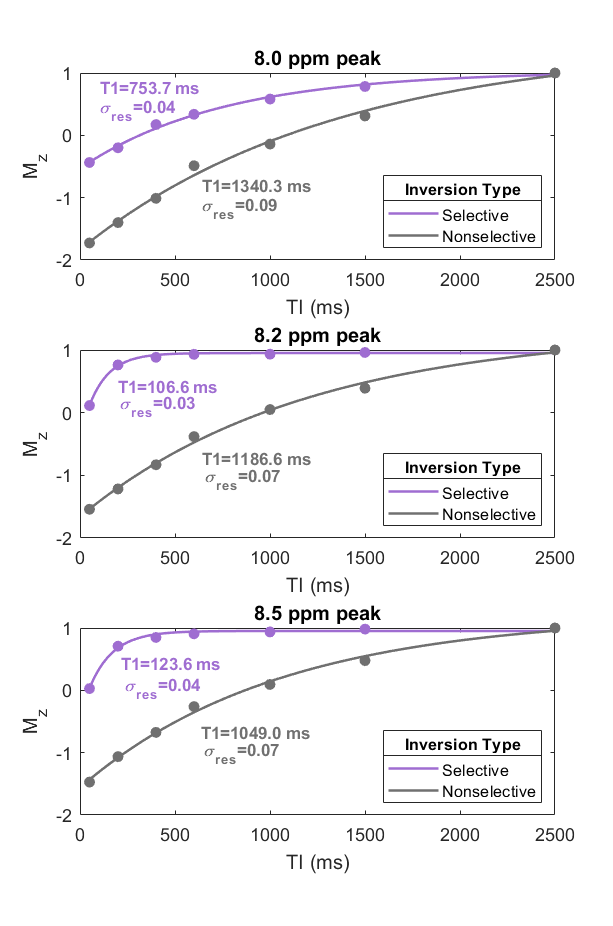
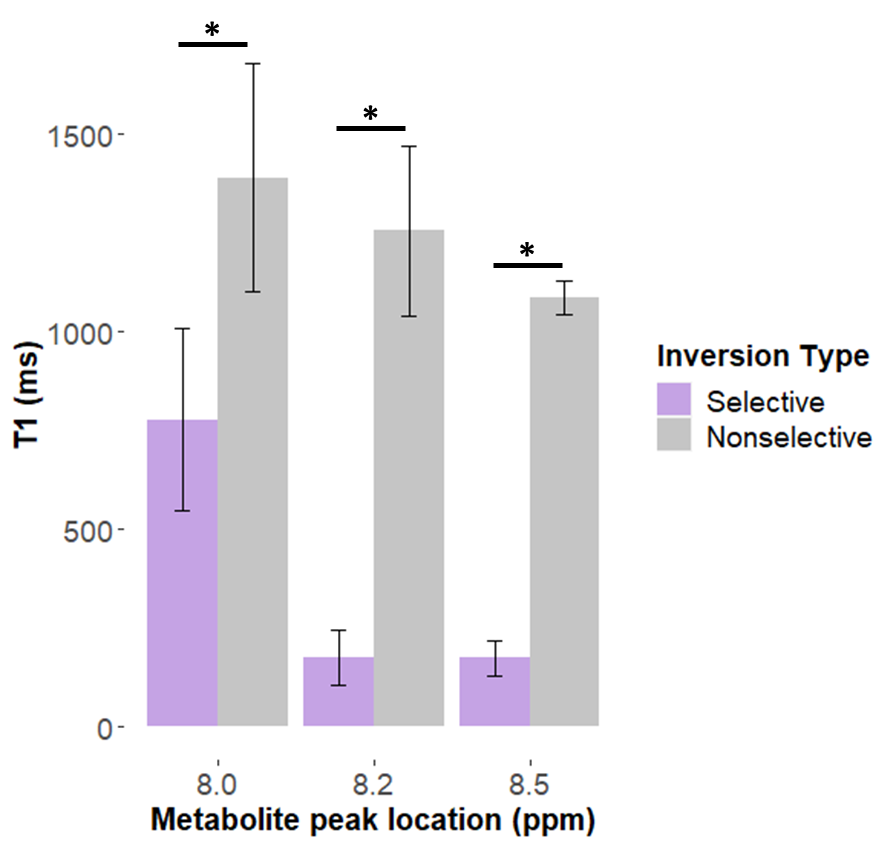
Figure 2B and 2C show representative spectra with resonances at about 8.0, 8.2, and 8.5 ppm in the downfield region at multiple selective and non-selective inversion times. Figure 3 shows the magnetization at each inversion time of the three metabolite peaks and the modeled T1 recovery curve under selective and non-selective inversion conditions from a single subject. The hypotheses that each set of T1 values came from a normal distribution could not be rejected (p>0.05). The average standard error of the residuals of the T1 model fits for each resonance ranged from 0.047±0.022 to 0.093±0.005 (Table 1). T1 of each metabolite peak was significantly shorter under selective inversion compared to nonselective inversion (Fig. 4). The nonselective T1’s of each peak were significantly larger than the selective T1’s. The T1’s of the 8.0 ppm peak were 1389±288 ms non-selective and 778±231 ms selective (p=0.005), 8.2 ppm peak were 1256±215 ms non-selective and 176±70 ms selective (p= 7.0e-04), and 8.5 ppm peak were 1085 ±42 ms non-selective and 174±43 ms selective (p=7.1e-06).Discussion and Conclusion
While we attribute most of the signal detected at 8.2 and 8.5 ppm to ATP, there are likely contributions from other metabolites, and further investigation of extent of the ATP contribution is underway. For frequency selective inversion, the metabolite resonances recover rapidly to equilibrium while non-selective inversion significantly prolongs the recovery. Because the H2 proton of the carnosine imidazole ring and the H7 and H12 protons of the ATP adenosine rings do not rapidly exchange with water, the decrease in apparent T1 under the selective inversion condition suggests a cross-relaxation effect and not chemical exchange. The larger cross-relaxation effect for metabolite peaks at 8.2 and 8.5 ppm may suggest that a larger proportion of ATP is bound to large proteins in vivo, which decreases rotational correlation time and enhances the cross-relaxation effect. The effect of cross-relaxation on carnosine is not as large and may contribute to the visibility of carnosine in the downfield region even when water suppression is used. We can exploit cross-relaxation effects to enhance or suppress signals from downfield resonances.Acknowledgements
Research reported in this publication was supported by the National Institute of Biomedical Imaging and Bioengineering of the National Institutes of Health under award Number P41EB015893 and T32EB009384, and by the National Heart, Lung, and Blood Institute of the National Institutes of Health under award Number R01HL137501.References
1. de Graaf RA, Behar KL. Detection of cerebral NAD(+) by in vivo (1)H NMR spectroscopy. NMR Biomed. 2014;27(7):802-809.
2. MacMillan EL, Boesch C, Kreis R. Magnetization exchange observed in human skeletal muscle by non-water-suppressed proton magnetic resonance spectroscopy. Magn Reson Med. 2013;70(4):916-924.
3. MacMillan EL, Chong DG, Dreher W, et al. Magnetization exchange with water and T1 relaxation of the downfield resonances in human brain spectra at 3.0 T. Magn Reson Med. 2011;65(5):1239-1246.
4. Shemesh N, Dumez JN, Frydman L. Longitudinal relaxation enhancement in 1H NMR spectroscopy of tissue metabolites via spectrally selective excitation. Chemistry. 2013;19(39):13002-13008.
5. Boldyrev AA, Aldini G, Derave W. Physiology and pathophysiology of carnosine. Physiol Rev. 2013;93(4):1803-1845.
6. Frontera WR, Ochala J. Skeletal muscle: a brief review of structure and function. Calcif Tissue Int. 2015;96(3):183-195.
7. Henning A. Proton and multinuclear magnetic resonance spectroscopy in the human brain at ultra-high field strength: a review. Neuroimage. 2018;168:181-198.
8. Geen H, Freeman R. Band-selective radiofrequency pulses. J Magn Reson. 1991; 93(1): 93-141.
9. Bendel P, Margalit R, Salomon Y. Optimized 1H MRS and MRSI methods for the in vivo detection of boronophenylalanine. Magn Reson Med. 2005;53(5):1166-1171.
Figures