0581
4D Phase Contrast MRI detects heterogeneous strain rate patterns along the length of the Tibialis Anterior muscle during dynamic contractions1Radiology, Leiden University Medical Center, Leiden, Netherlands, 2Biomedical Engineering & Physics, Amsterdam Movement Sciences, Amsterdam University Medical Center, Location AMC, Amsterdam, Netherlands, 3Radiology, Stanford University, Stanford, CA, United States, 4Rehabilitation Medicine, Leiden University Medical Center, Leiden, Netherlands, 5Radiology and Nuclear Medicine, Amsterdam Movement Sciences, Amsterdam University Medical Center, Location AMC, Amsterdam, Netherlands, 6Duchenne Center Netherlands, Veenendaal, Netherlands
Synopsis
We assessed strain rate distributions within the Tibialis Anterior muscle by acquiring whole lower leg 4D PC-MRI during dynamic exercise, with and without load. Our data revealed a spatially heterogeneous strain rate pattern along the length of the Tibialis Anterior muscle during movement cycle. During dorsiflexion, the smallest negative strain rates were observed (in first approximation) along the fiber in the most proximal segment and the largest positive strain rates (in first approximation) across the fiber in the most distal segment, while plantarflexion showed the expected opposite. No effect of load was detected on strain rates.
Introduction
It is known that muscles do not uniformly shorten along their longitudinal axis1 and therefore strains during contraction and relaxation are likely heterogeneously distributed within the muscle. This notion is supported by the finding that muscle damage after heavy eccentric exercise is not uniformly distributed within muscles2,3. However, the few studies that assessed strain heterogeneity within muscles reported contrasting results, including homogeneous distributions and higher strain rates distally4,5. A limitation in these studies was that primarily 2D imaging techniques with limited coverage or single slice assessments were used in combination with small ROIs6,7. Consequently, 3D information with high spatial resolution, needed to assess the hypothesized complex strain distributions within muscle, was not available. In addition, these studies used primarily isometric contractions and passive joint motions which are not reflective for daily-life activities whereas dynamic contraction against load would be more reflective. We used an in-house developed accelerated time-resolved 3D Phase Contrast (PC)-MRI protocol with sufficient spatial-temporal resolution to facilitate a 3D assessment of strain rate distributions in the Tibialis Anterior (TA) muscle during dynamic exercise, under two different load conditions.Methods
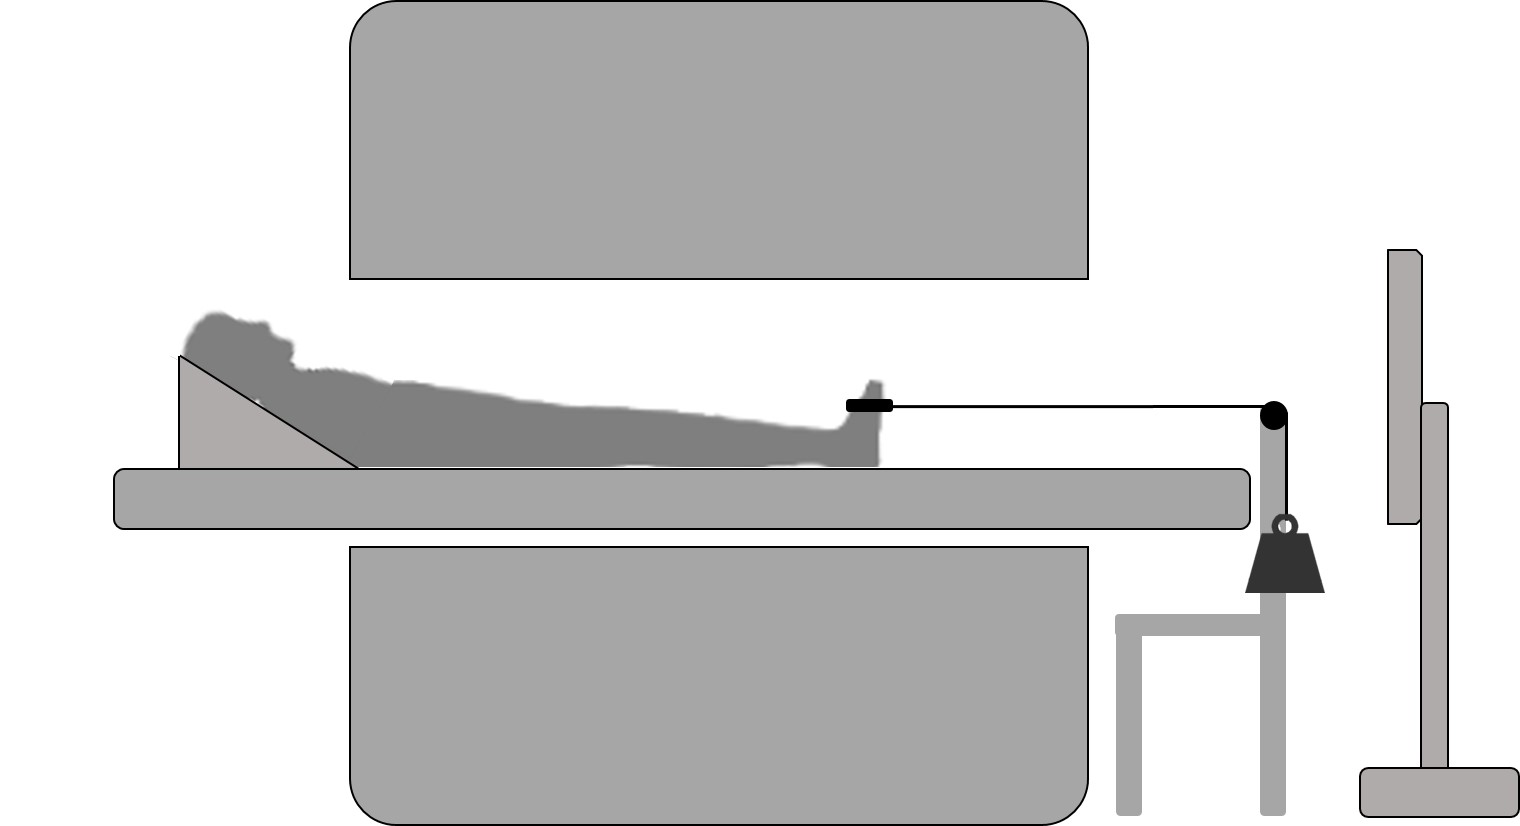
MR datasets were acquired in the right lower leg of 12 healthy volunteers (age: 31.6±15.9 years; 50% m) with a 3T Philips Ingenia system (Best, Netherlands) and 16-channel receive coil with the ankle in neutral position. The MR examination consisted of a Dixon acquisition (TR/TE/∆TE/FA 7.8/1.27/1.1/3; voxel size 1x1x3mm3) for muscle segmentation, diffusion-weighted acquisition (fat-suppressed SE-EPI; TR/TE 6123/48ms; b-values: 0(4), 400(19) s/mm2; voxel size 3x3x6mm3) to assess principal fiber directions and two 4D PC-MRI acquisitions to retrieve velocity information during dorsi-/plantarflexion movement (starting in plantarflexion), with and without load (VENC=10 cm/s; 20 time-points, voxel size 3x3x6mm3; scan duration of 432 seconds corresponding to 216 motion task repetitions) covering the lower leg (FOV 192x192x390mm3). 4D PC-MRI data were acquired by incoherently undersampling k-space based on a pseudo-spiral pattern (R=9.1)8,9. The applied load was 7.5% of maximum voluntary contraction force (MVC-force). MVC-force was measured as the highest value of three contractions for dorsi-flexor muscles prior to the scan examination using a handheld dynamometer. A schematic representation of the exercise set-up is shown in Figure 1.Data-analysis
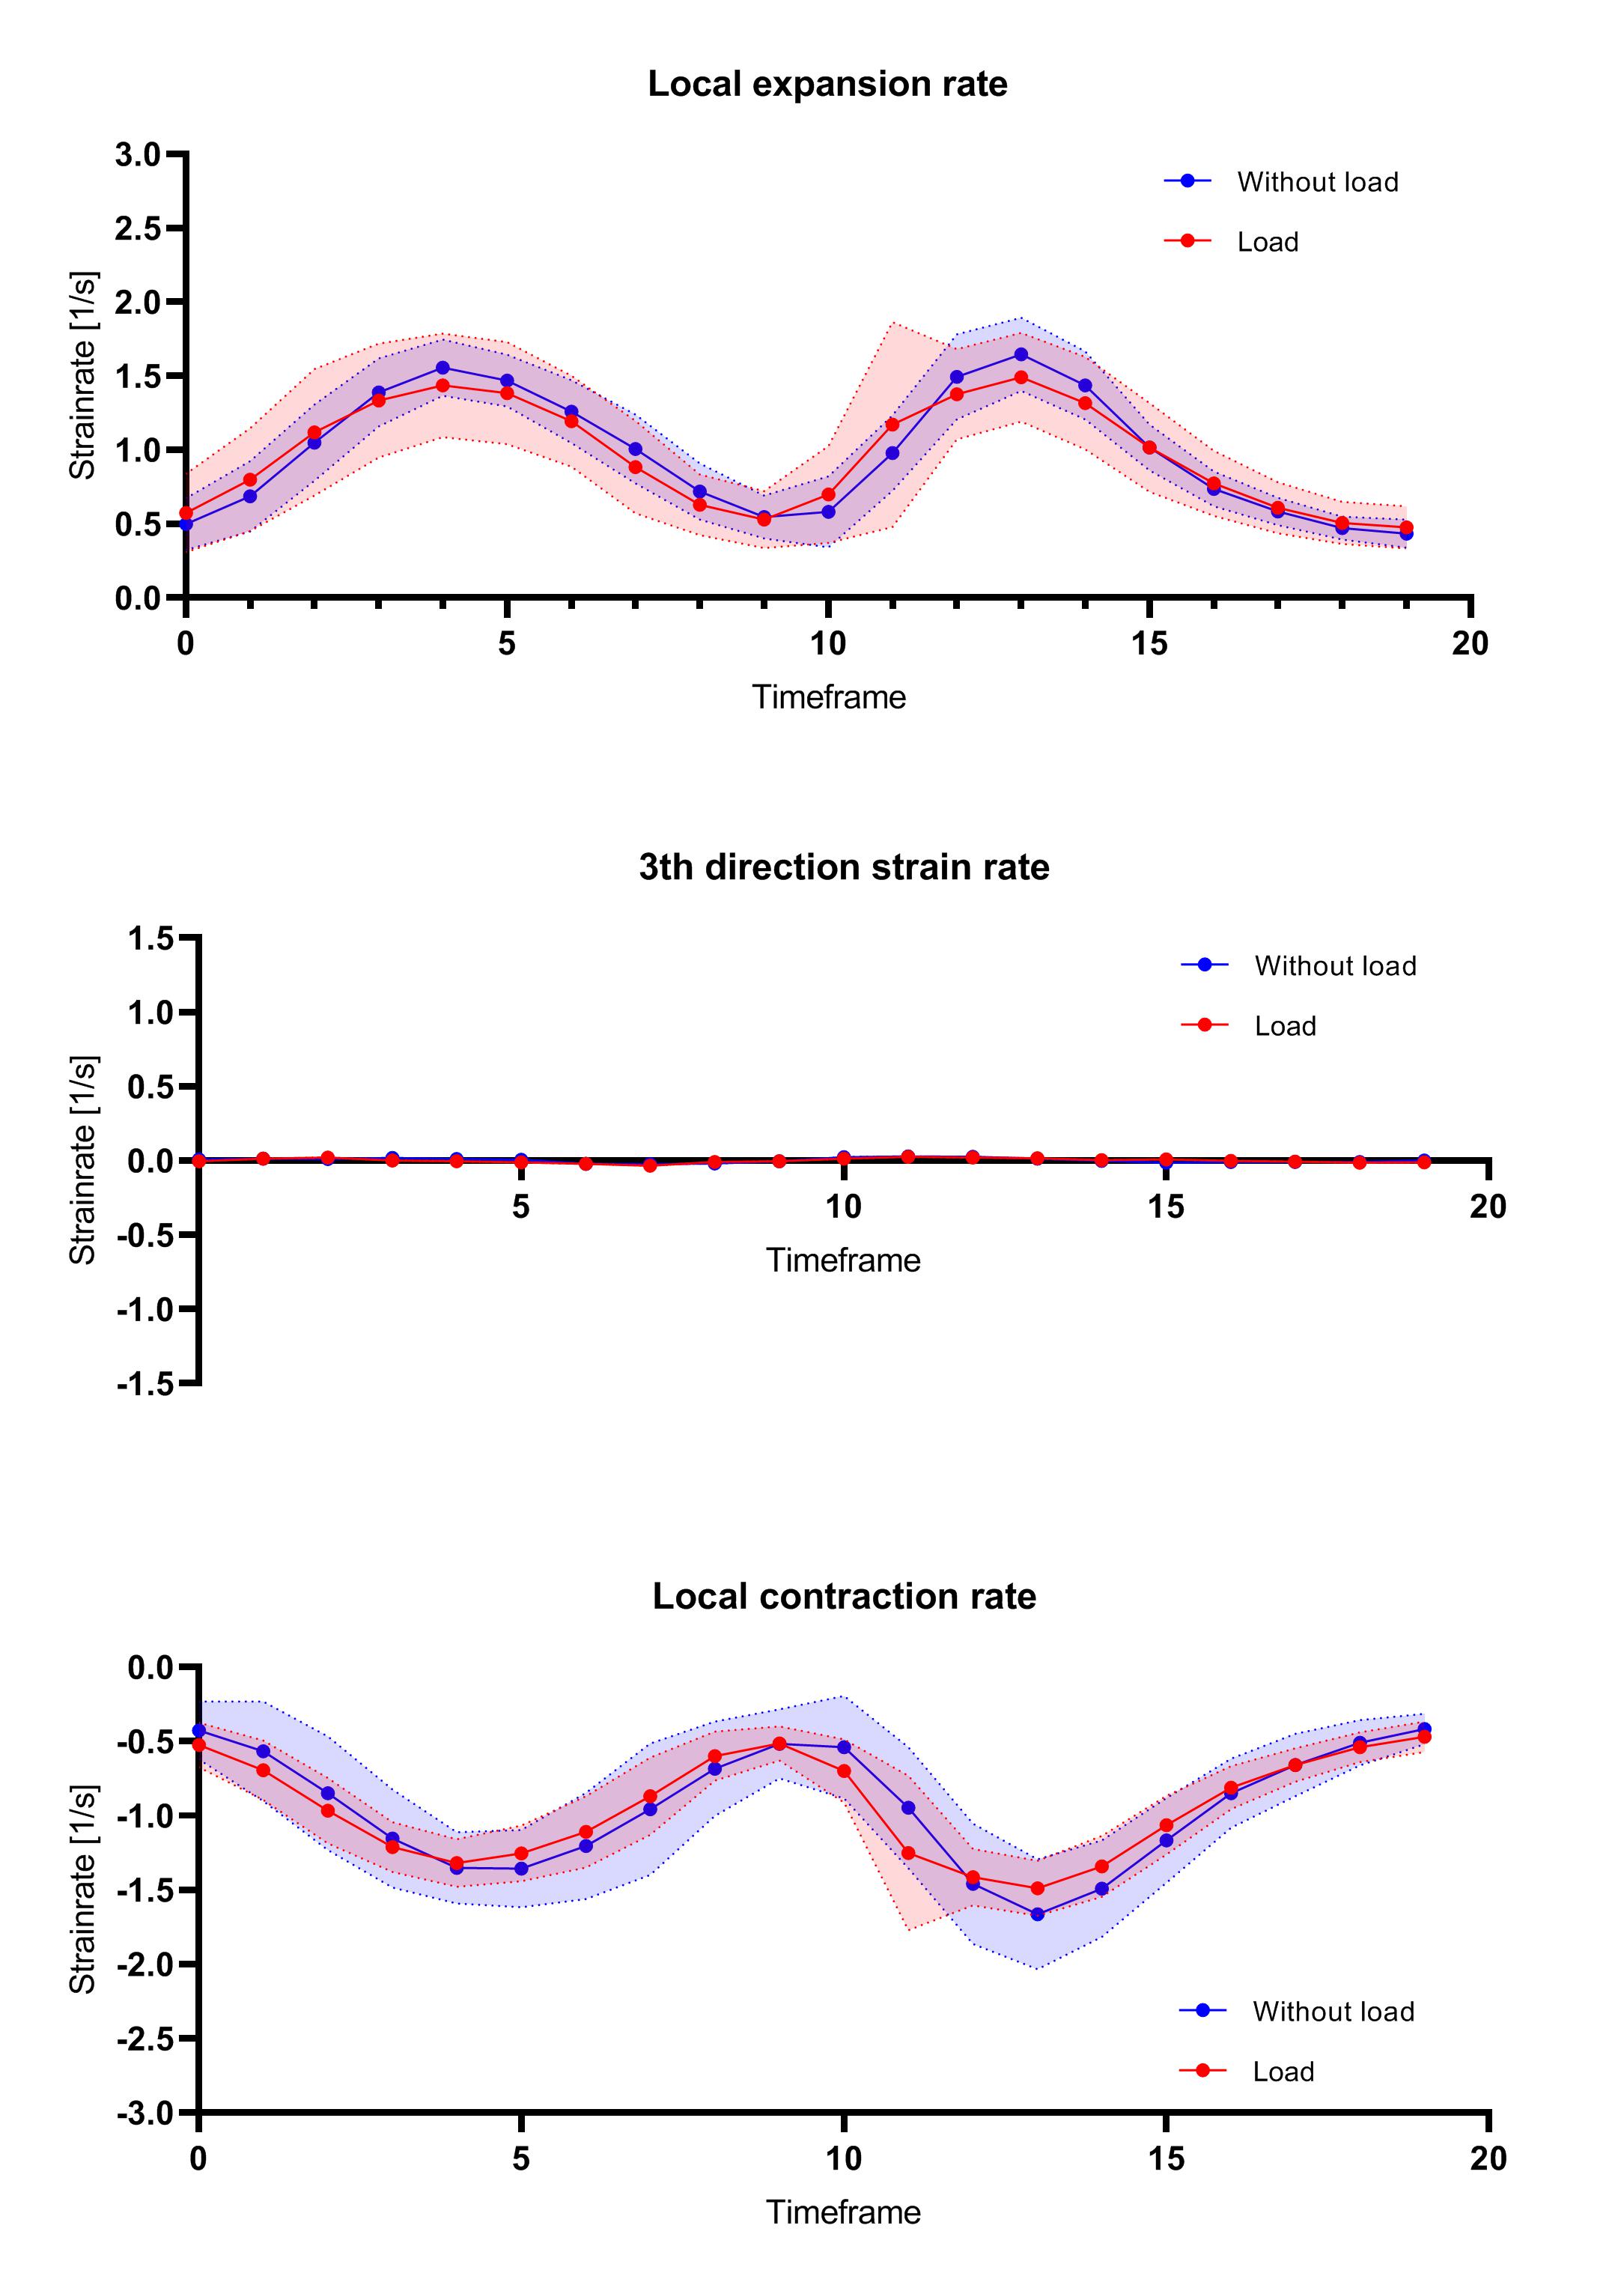
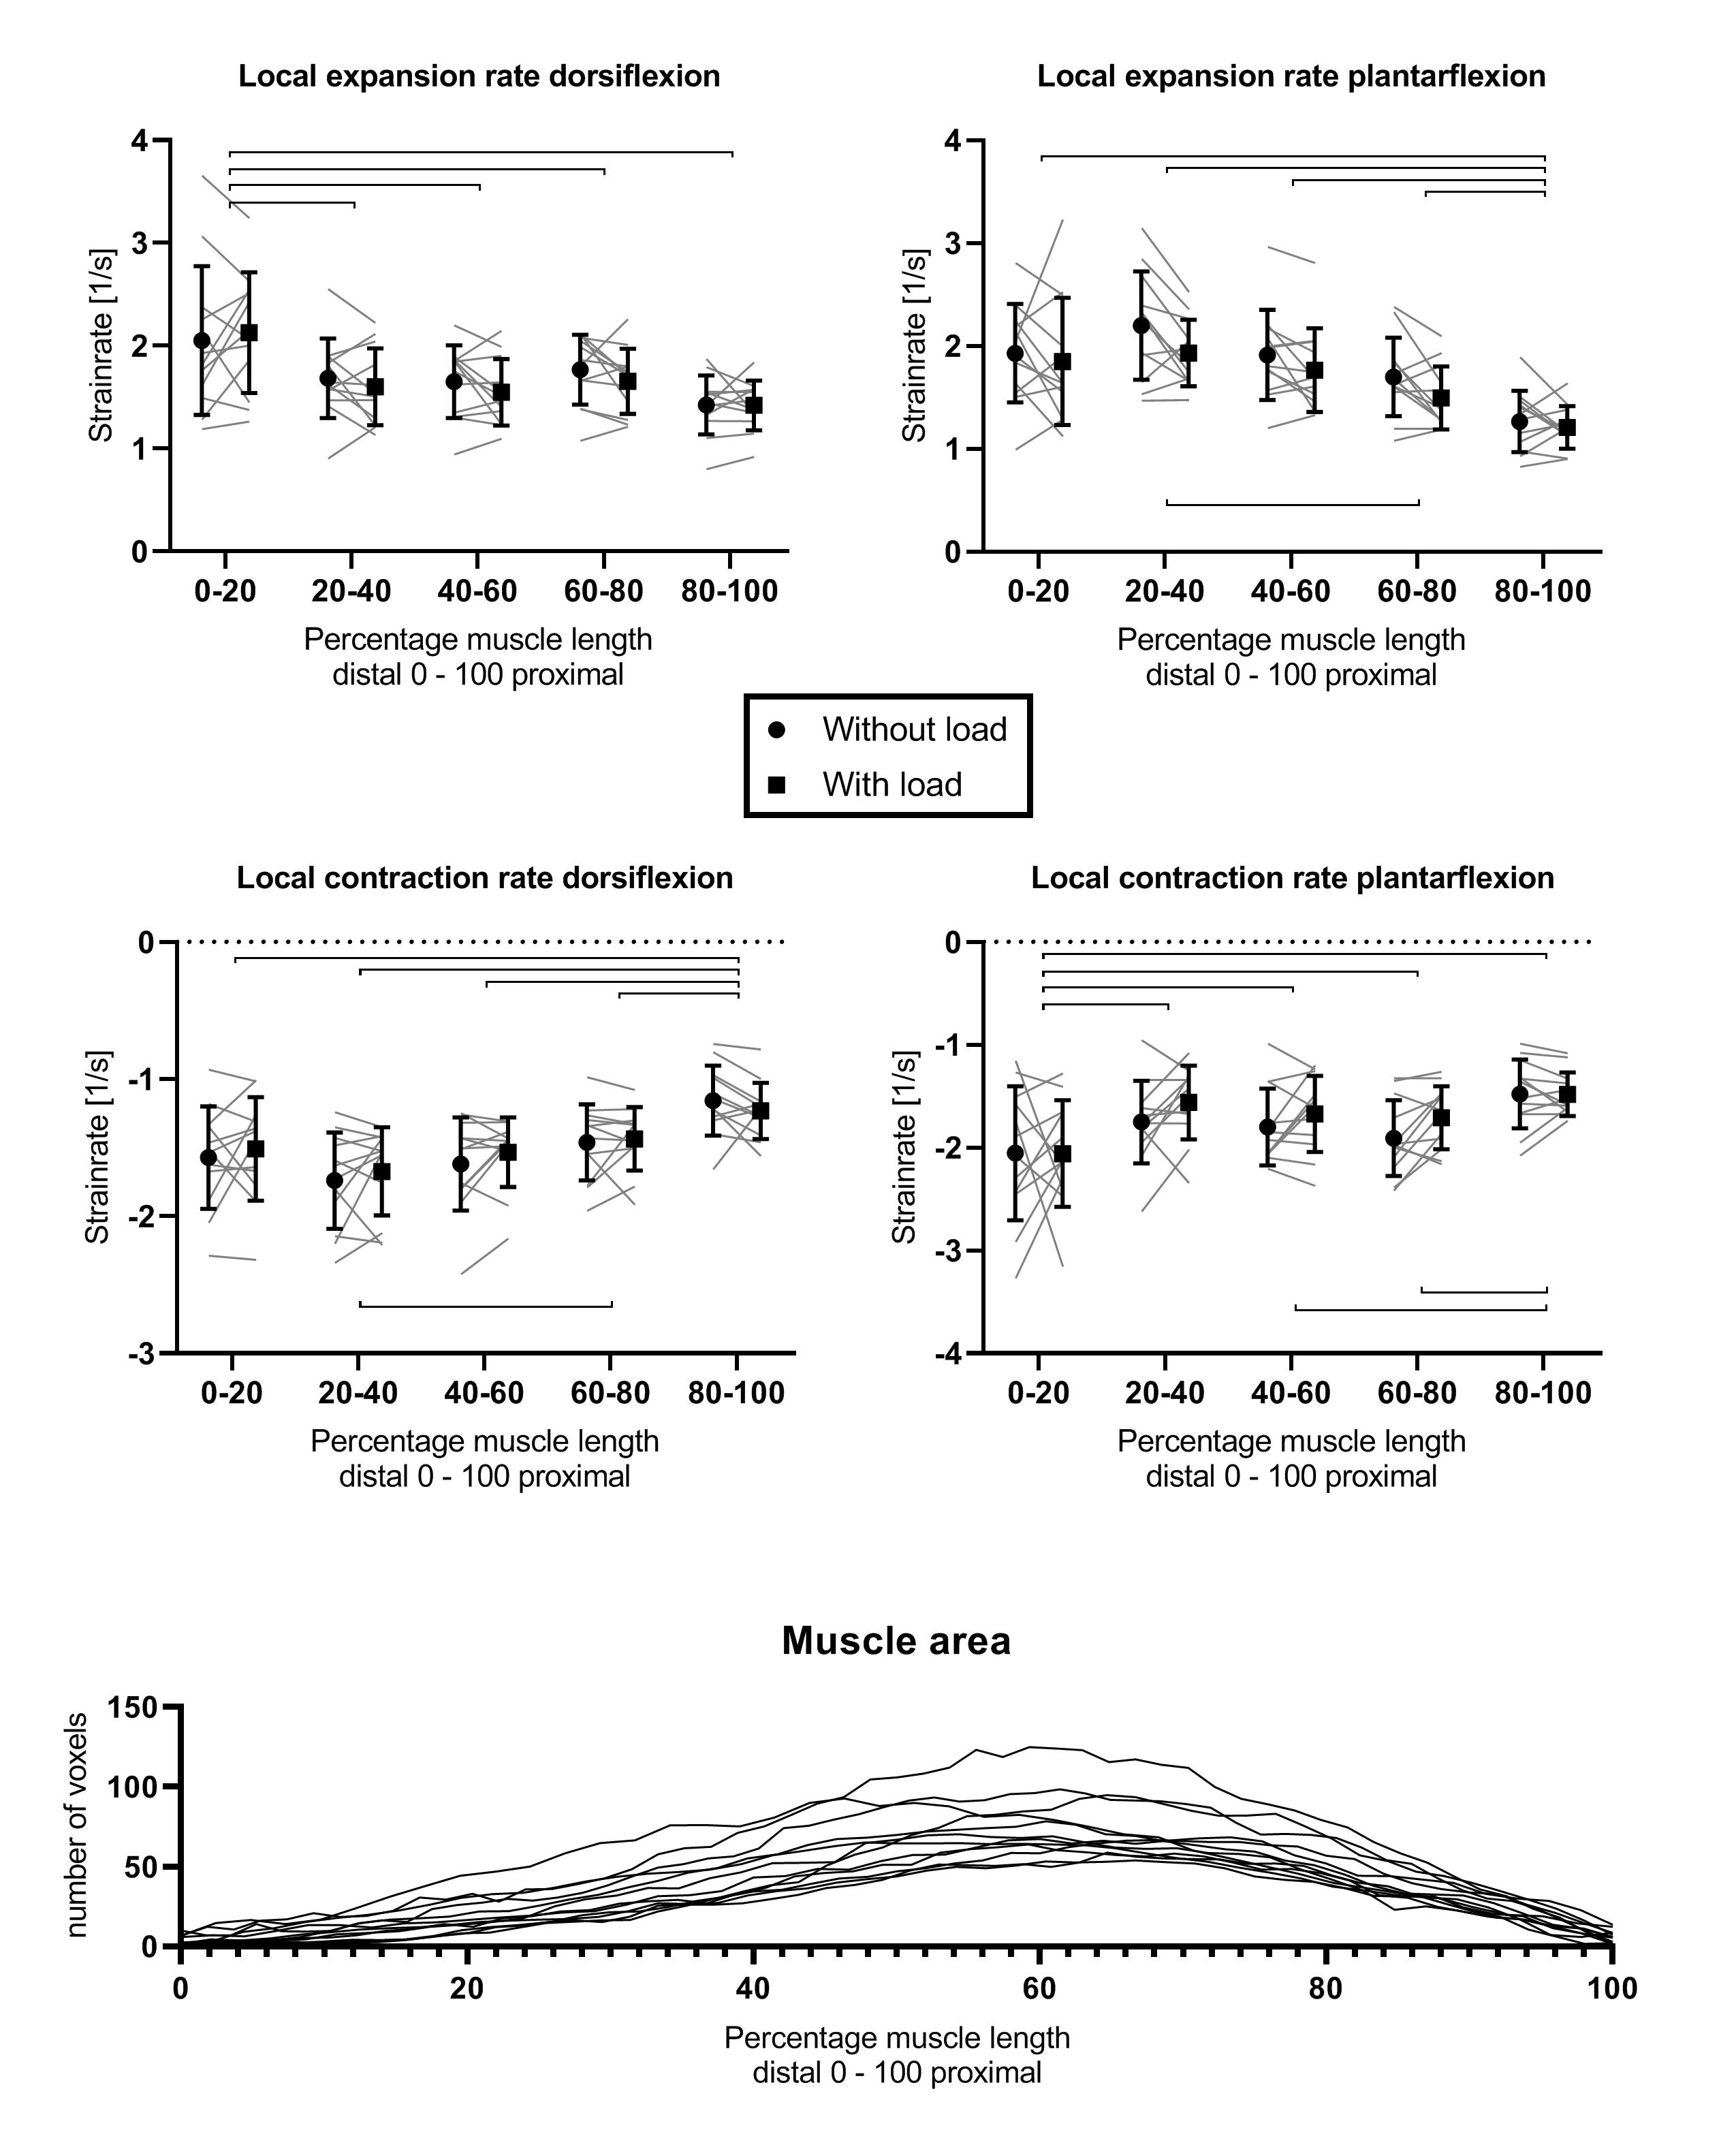
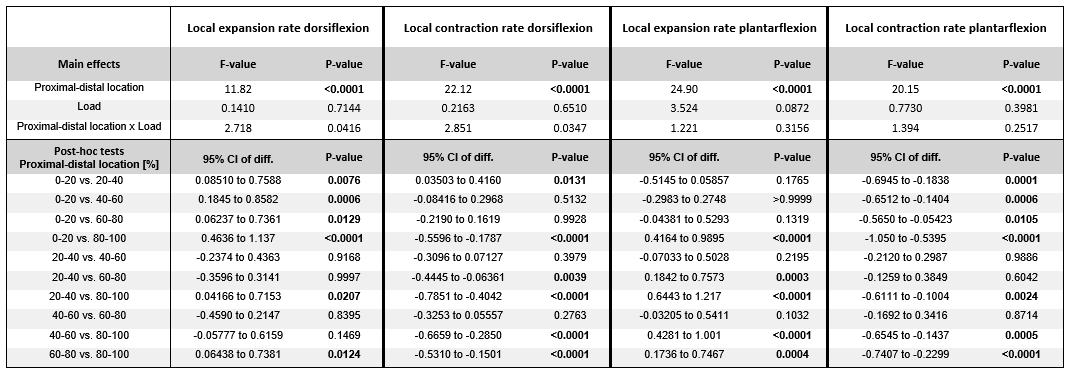
PC-MRI data was reconstructed using a Compressed Sensing pipeline9 using BART10. The infinitesimal strain rate tensor was calculated and diagonalized to obtain the principal eigenvectors and -values. Volumes of interest (VOIs) were drawn on the muscle border along the full length of the TA using scanner reconstructed water images of the Dixon. These images were subsequently registered to individual time-points of the PC-MRI data (magnitude images) using 3D-Demons11, and the deformation matrices were used to deform the VOIs. Full segmented muscle volumes were divided into five equal segments based on normalized muscle length (distal 0-100% proximal). Strain rate eigenvalues are reported as weighted mean and standard deviation for each of the individual segments and over the full volume for maximum dorsi-/plantarflexion position. Two-Way Repeated Measures ANOVAs with Bonferonni correction (p-value≤0.0125) was used to assess the effect of load and proximodistal location on strain rates.Results
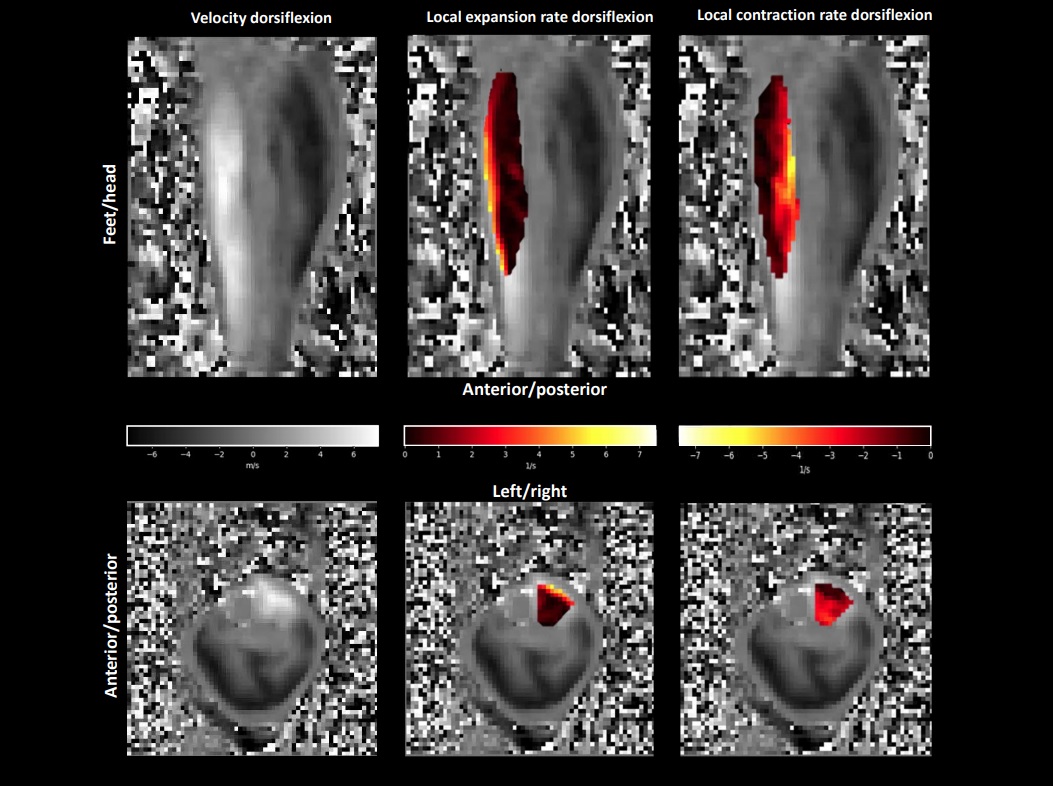
Representative velocity images and strain rate maps are shown for one subject during maximal dorsiflexion velocity with load (Figure 2). A consistent temporal pattern was found for strain rate eigenvalues during both load conditions, consisting of a large negative eigenvalue (local contraction, 1st-eigenvalue), large positive eigenvalue (local expansion, 2nd-eigenvalue) and one approximately zero eigenvalue (3rd-eigenvalue) (Figure 3). A main effect was found for proximodistal location for negative and positive strain rate eigenvalues during dorsi- and plantarflexion (Table 1; Figure 3). Post-hoc analysis showed that during dorsiflexion the smallest negative strain rates (contraction) (in first approximation) along the fiber were detected in the most proximal segment and the largest positive strain rates (expansion) (in first approximation) across the fiber in the most distal segment. During plantarflexion, the smallest positive strain rates (expansion) were detected in the most proximal segment (in first approximation) along the fiber and the largest negative strain rates in the most distal segment (in first approximation) across the fiber. No load effect was detected on strain rates (Figure 3-4).Discussion
This study revealed spatially heterogeneous strain rate patterns along the length of the TA muscle during dynamic dorsi-/plantarflexion contractions with and without load, with the smallest and largest strain rates in most proximal and distal segment, respectively. Observed strain rate eigenvalues agreed with both magnitude and temporal patterns reported in previous studies1,8. The observed spatial pattern is consistent with part of the 2D strain rate measurements in other muscles, where higher strain rates distally were attributed to the smaller CSA5,13. Other likely factors which may contribute to heterogeneity in strain rates are variations in fascicle lengths and curvature, extracellular matrix, motor unit activation and neural control14-17. No differences in principal strain rates were detected between the two load conditions. This is probably related to the relatively low load levels and fixed timing of the movement cycle13,18. We aim to combine strain rate eigenvectors with the acquired DTI data to improve our understanding of muscle contractile function.Conclusion
Spatially heterogeneous strain rates were detected along the length of the TA muscle indicating that 3D assessments are required for better understanding of muscle contractile function.Acknowledgements
This work was supported by the Netherlands Organization for Scientific Research (NWO), under research program VIDI, project "Similar but not thesame", number 917.164.90, and the Dutch Technology Foundation TTW (DIMASK #15500).References
1] Englund EK, Elder Cp, Xu Q et al. Combined diffusion and strain tensor MRI reveals a heterogeneous, planar pattern of strain development during isometric muscle contractions. Am J Physiol Regul Integr Comp Physiol 2011, Jan;26:1079-1090
2] Maeo S, Saito A, Otsuka S, Shan X, Kanehisa H, Kawakami Y. Localization of muscle damage within the quadriceps femoris induced by different types of eccentric exercises. Scand J Med Sci Sport. 2018; Jan;28(1):95-106. doi: 10.1111/sms.12880
3] Maeo S, Ando Y, Kanehisa H, Kawakami Y. Localization of damage in the human leg muscles induced by downhill running. Sci Rep. 2017; Jul 18;7(1):5769. DOI: 10.1038/s41598-017-06129-8
4] Sinha-u, Malis V. Caspo R Narici M Sinha S. Shear strain rate from phase contrast velocity encoded MRI: application to study effects of aging in the medial gastrocnemius muscle. J Magn Reson Imaging. 2018 Nov;48(5):1351-1357. Doi: 10.1002/jmri.26030
5] Malis V. Sinha U. Csapo R, Narici M, Sinha S. Relationship of changes in strain rate indices estimated from velcotiy encoded MR imaging to loss of muscle force following disuse atrophy. Magn Reson Med. 2018 Feb;79:912-922. Doi 10.1002/mrm/26759
6] Csapo R, Malis V, Hodgson J, Sinha S. Age-related greater achilles tendon compliance is not associated with larger plantar flexor mucle fascicle strains in senior woman. J Apply Physiol 2014; Febr 116, 961-969.
7] Drace JE, Pelc NJ. Measurement of Skeletal muscle motion in vivo with Phase-contrast MR imaging. J Magn Reson Imaging 1994, Mar-Apr;4(2):157-63
8] Mazzoli V, Gottwald LM, Peper ES et al. Accelerated 4D Phase Contrast MRI in skeletal muscle contractions. Magn Reson Med. 2018, Nov;80(5):1799- 1811
9] Gottwald LM, Peper ES, Zhang Q, Coolen BF, Strijkers GJ, Nederveen AJ, van Ooij P. Pseudo-sprial sampling and compressed sensing reconstruction in accelerated aortic 4D flow MRI: a comparison with k-t principal component analysis. NMR in Biomedicine 2020; Apr;33(4):e4255
10] Uecker, Martin, et al. "Berkeley advanced reconstruction toolbox." Proc. Intl. Soc. Mag. Reson. Med. 2015; Vol. 23
11] Thirion JP. Image matching as a diffusion process: an analogy with Maxwell’s Demons. Medical Image Analysis. 1998, Sep;2(3):243-60.
12] Pappas. GP. Asakawa DS. Delp SL. Zajac FE, Drace JE. Nonuniform shortening in the biceps brachii during elbow flexion. J Appl Physiol 2002 Jun;92(6):2381-9
13] Shin DD, Hodgson JA, Edgerton VR et al. In vivo intramuscular fascicle-aponeuroses dynamics of the human medial gastrocnemius during plantarflexion and dorsalflexion of the foot. J appl Physiol 2009, 107:1276-1284
14] Blemker SS; Pinsky PM, Delp SL. A 3D model of muscle reveals the causes of non-uniform strains in the Biceps Brachi. J Biomech 2005 38:657-665 2005
15] Connelly DM, Rice CL, Roos MR et al. Motor unit firing rates and contractile properties in tibialis anterior of young and old man. J appl physiol 1999, 87: 843-852
16] Wolf SL, Kim JH. Morphological analysis of the human tibialis anterior and medial gastrocnemius muscles. Acta Anat(basel) 1997, 159:287-295
17] Sinha U., Malis V., Chen J., Caspo R., Kinugasa R., Narici M.V., Sinha S. Role of the extracellular matrix in loss of muscle force with age and unloading using magnetic resonance imaging, Biochenmical Analysis and Computational Models. Front Physiol 2020, Jun, 18; 11:626
18] Hodgson J.A., Finni T., Lai A.M., Edgerton R.V., Sinha S. Influence of structure on the tissue dynamics of the human soleus muscle observed in MRI studies during isometric contractions. 2006 May; 267(5):584-601
Figures