0580
On the reconstruction of MR-fingerprinting with water and fat separation for quantitative skeletal muscle imaging1Neuromuscular Investigation Center, NMR Laboratory, Institute of Myology, Paris, France, 2NMR Laboratory, CEA, DRF, IBFJ, MIRCen, Paris, France, 3Support Center for Advanced Neuroimaging, Institute for Diagnostic and Interventional Neuroradiology, Inselspital, Bern University Hospital, University of Bern, Bern, Switzerland
Synopsis
Our objective was to determine the influence of the reconstruction parameters on fat fraction and water T1 estimated in the skeletal muscle using MR fingerprinting with water and fat separation, to propose an optimized reconstruction procedure maximizing the accuracy and precision of the MRI variables, and evaluate it on in vivo data. We show that aliasing artefacts generate a bias in the estimates that could be mitigated by introducing a simple correction factor. Then, the accuracy and precision were improved by reconstructing the frames using a single radial spoke, and by using 10 SVD components for dictionary matching.
INTRODUCTION
MR fingerprinting with water and fat separation (MRF T1-FF) has been recently proposed for fast and simultaneous measurements of fat fraction (FF) and water T1 (T1H2O) in fatty infiltrated muscles1. This approach can provide MRI biomarkers of fatty replacement and disease activity in clinical trials related to neuromuscular diseases (NMD)2. The MRF T1-FF sequence is based on the acquisition of a radial echo train with varying flip angle (FA), TE and TR after inversion. For reconstruction, the spokes are combined to form a series of undersampled images using non-uniform FFT. The quantitative maps are then generated using dictionary matching with SVD dimensionality reduction. So far, the impact of the reconstruction parameters on the precision and accuracy of the MRF T1-FF variables has not been explored. In particular, the number of spokes combined to reconstruct each frame and the number of SVD components used for matching could influence the results. Also, recent publications point out that the noise added by aliasing artifacts due to the important k-space undersampling, which is usually considered to have zero mean, might also bias the results of MRF reconstructions3,4. In this study, the goal was to determine the influence of the reconstruction parameters on FF and T1H2O estimated with MRF T1-FF, to propose an optimized reconstruction procedure maximizing the accuracy and precision of the NMR variables, and evaluate it on in vivo data.METHODS
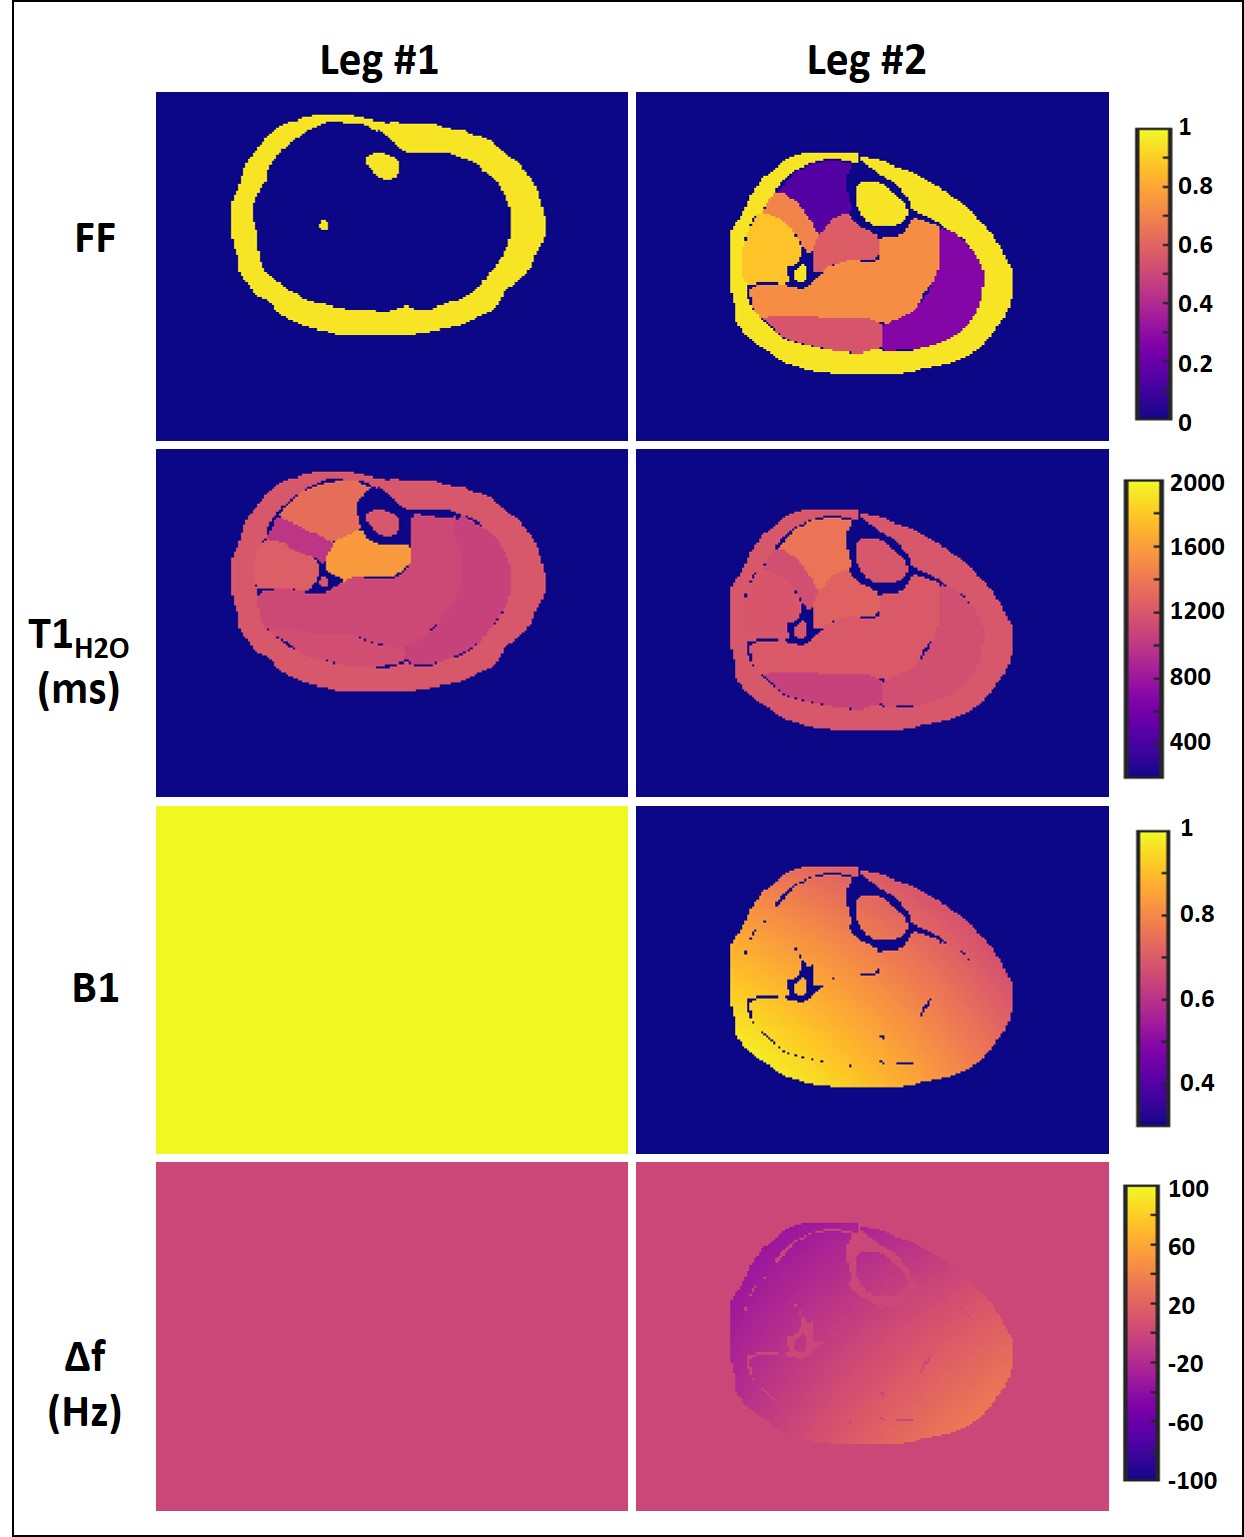
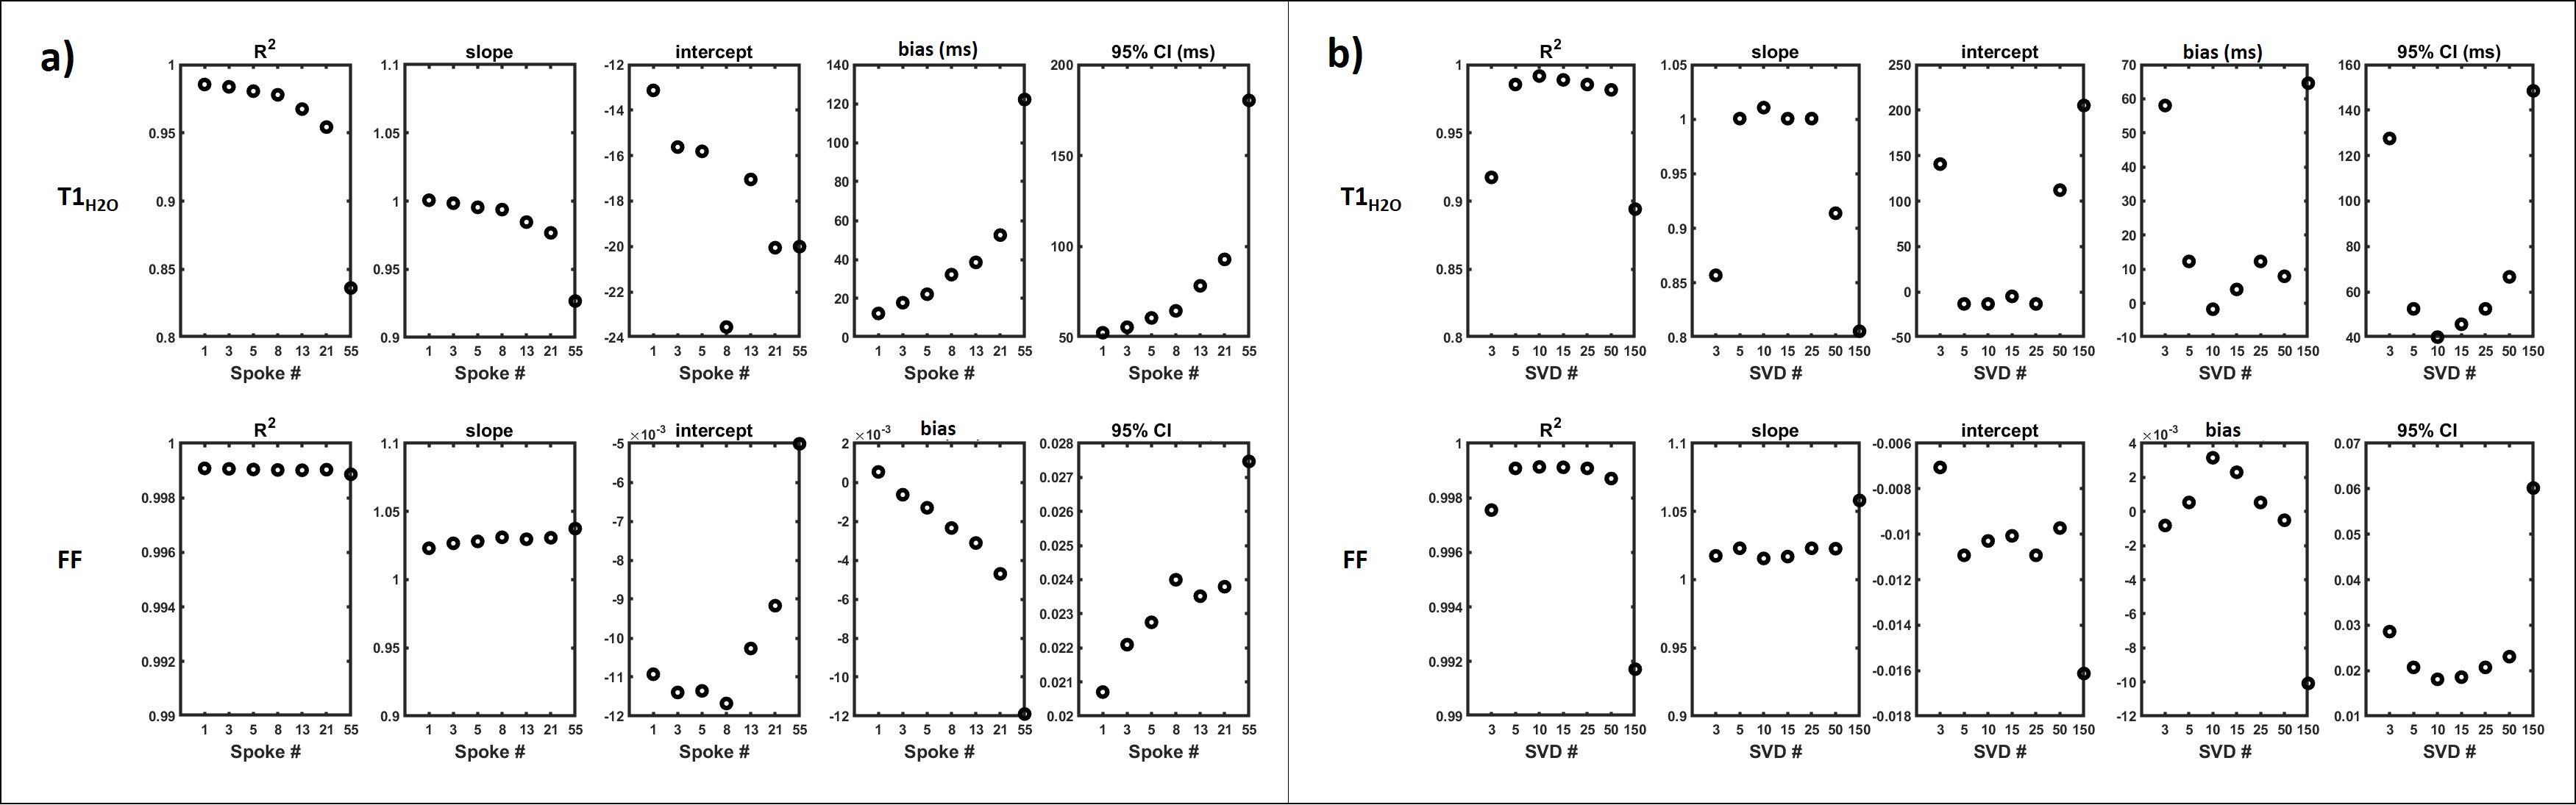
Numerical simulations:A dataset of 70 synthetic numerical legs, with theoretical value for FF, T1H2O, B1 and off-resonance (Δf) maps was generated (figure 1). We simulated the MRF T1-FF acquisition1 in each calf, and evaluated different reconstruction parameters to process the data. First, the effect of undersampling on the MRF signal was assessed and was approximated to a homogeneous spreading of the signal over the image. For this, the signal (Sig) of each pixel (i) at a particular timeframe (t) was corrected by subtracting the mean signal of the image frame before matching (Eq. 1): $$ Sig_{corr}(i,t)=Sig(i,t) - \cfrac{\sum_iSig(i,t)}{Nb_{pix}} $$ Then, the impact of the number of spokes used to reconstruct each frame (from 1 to 55) and the number of SVD components used to describe the dictionary elements (from 3 to 150) was also investigated. In each leg, 7 regions of interest (ROIs) were analyzed. For each reconstruction configuration, we reported different metrics between the theoretical and the computed variables in the ROIs (Pearson correlation coefficient (r2), slope and intercept of the linear correlation, bias and 95% confidence interval (CI)).
In vivo experiments:
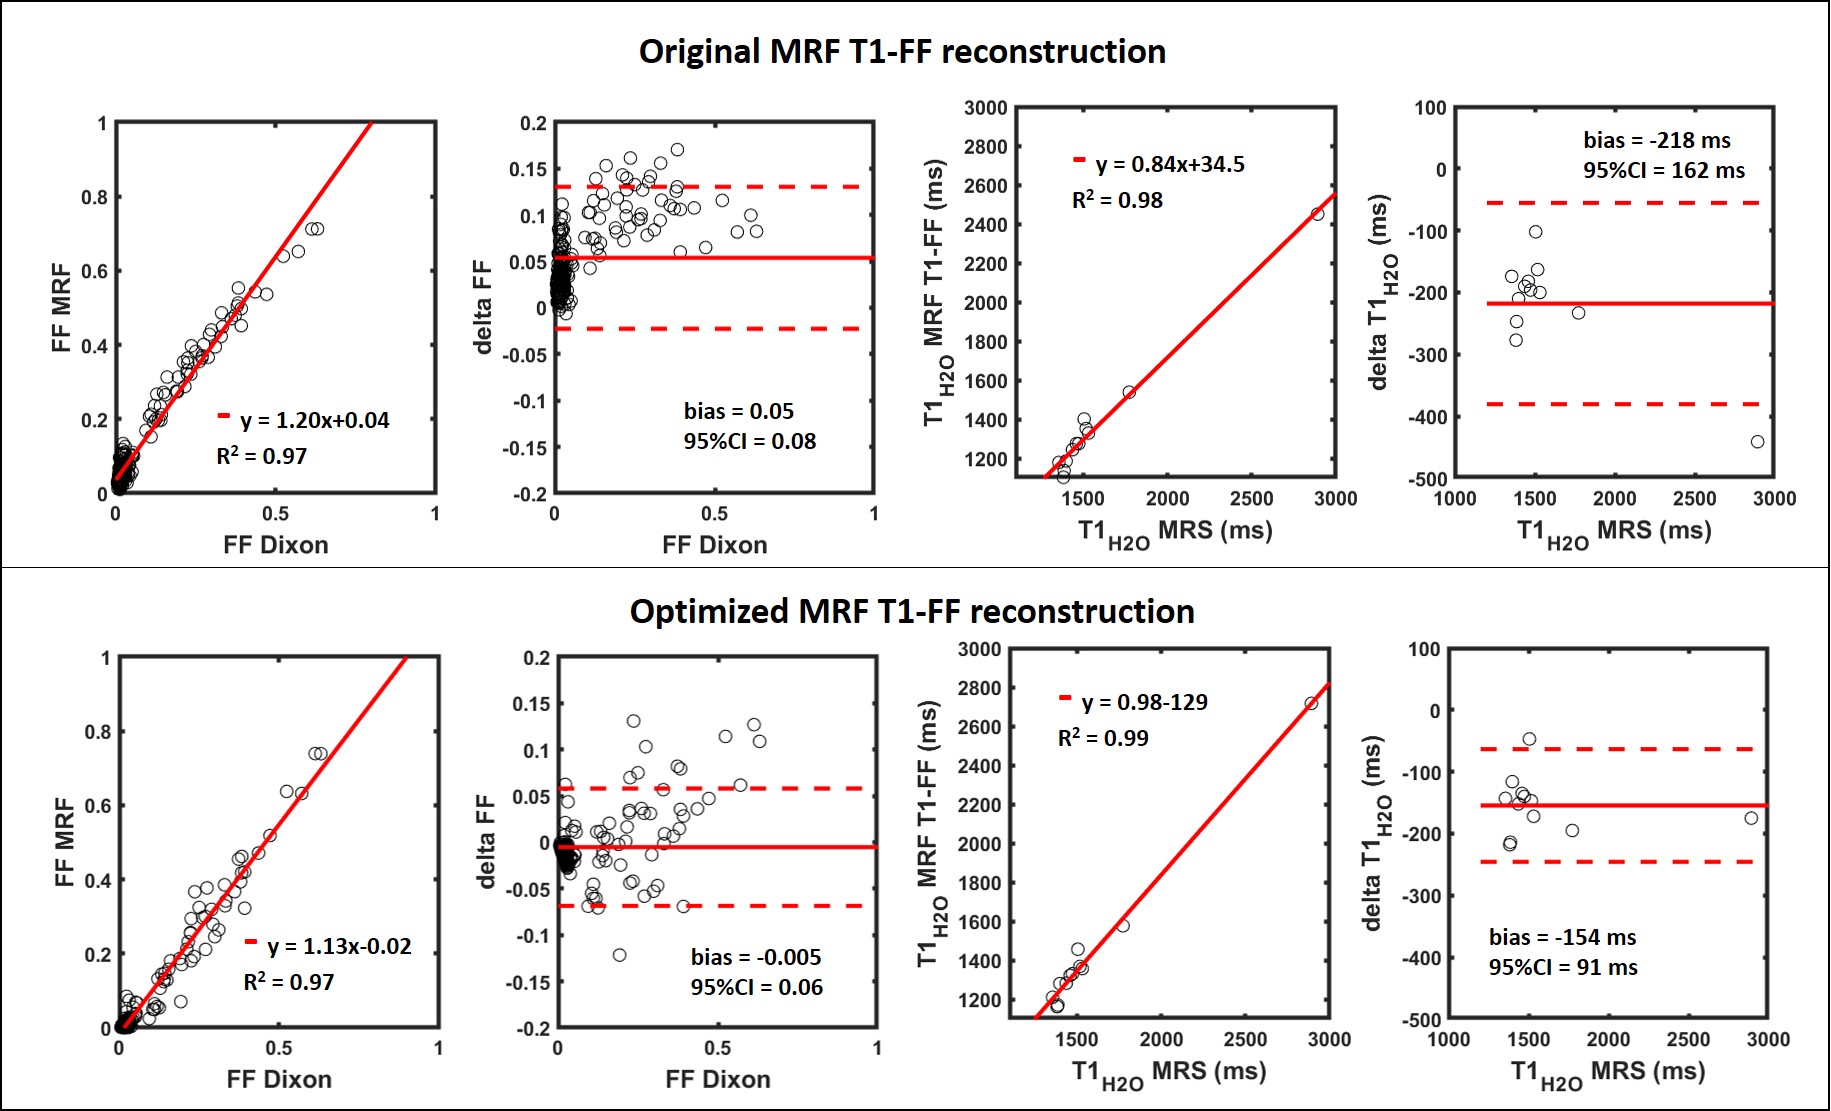
In vivo experiments were performed in the lower limbs of four healthy volunteers and five NMD patients. The MRF T1-FF sequence was acquired at 3T (Prisma, Siemens) using an echo train of 1400 spokes, golden angle sampling scheme, varying TE, TR and FA, 5 slices and a spatial resolution of 1x1x5mm3 (Tacq = 50 sec). Reference FF maps were obtained by 3-pt Dixon (3D GRE sequence with three TEs). Gold standard T1H2O values were obtained in one or two muscles (gastrocnemius medialis and/or tibialis anterior) using an IR-STEAM sequence (32 TI varying from 20 to 5000 ms, voxel size = 20 mm3, TE/TR = 20/10000 ms). In these data, the original MRF T1-FF reconstruction approach1 was compared to the best configuration obtained from the numerical simulations.
RESULTS
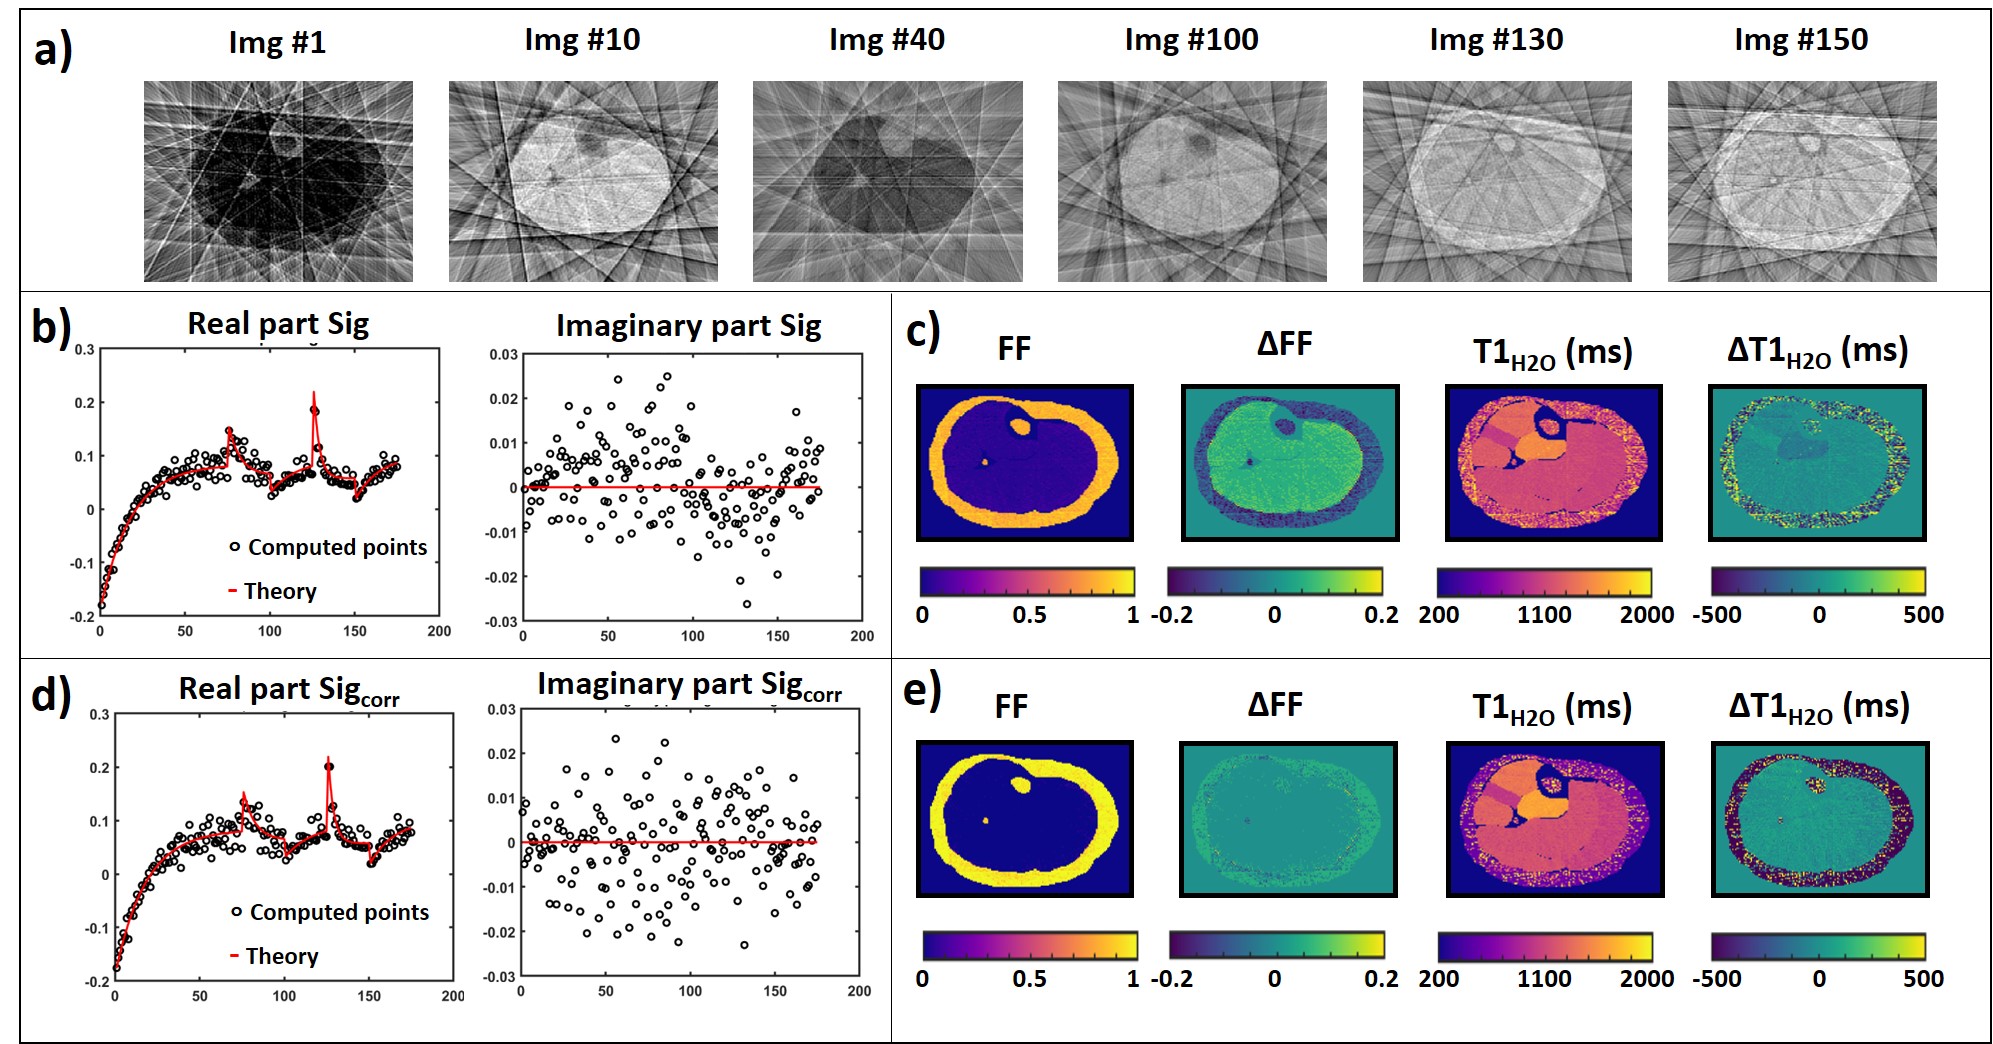
Figure 2-a shows a subset of the image series reconstructed in a numerical leg mimicking a subject without fatty replacement, using 8 spokes per frame, highlighting the aliasing artifacts due to undersampling. Figure 2-b depicts the simulated and theoretical signal evolutions in a small ROI. The imaginary component presented a bias compared to the theoretical signal, resulting in an overestimation of low FF and an underestimation of FF in the subcutaneous fat (figure 2-c). This bias disappeared after correction by Eq. 1 (figure 2-e-f). Pearson correlation coefficient, slope and intercept of the linear correlation, bias and 95% CI values improved when decreasing the number of spokes used to reconstruct each frame of the image series (figure 3-a). The number of SVD components used for dictionary matching also influenced the quality of T1H2O and FF estimates, and was optimal for 10 components (figure 3-b). In vivo, the agreement between MRF T1-FF derived variables and gold standard values was higher when data were reconstructed with the optimal parameters (i.e. signal aliasing correction, 1 spoke/frame, 10 SVD components) compared to the method proposed in the original publication1 (figure 4).DISCUSSION & CONCLUSION
We showed that the precision and accuracy of the variables derived by MRF T1-FF depend on the reconstruction parameters. First, aliasing artefacts generate a bias in the estimates that was mitigated by introducing a simple correction of the signal evolution. Then, the accuracy and precision were improved by reconstructing each frame using a single radial spoke, and by using 10 SVD components for dictionary matching. These results were obtained in a numerical database and the improvement was confirmed in vivo in a group of healthy volunteers and NMD patients. These improvements will certainly strengthen the position of MRF T1-FF as a fast and robust method to monitor simultaneously disease severity (FF) and activity (T1H2O) in NMD-related clinical trials.Acknowledgements
Part of this study was fund by ANR-20-CE19-0004References
1- Marty B, Carlier PG. MR fingerprinting for water T1 and fat fraction quantification in fat infiltrated skeletal muscles. Magn Reson Med. 2020 Feb;83(2):621-634.
2- Marty B, Reyngoudt H, Boisserie JM et al. Water T1: a quantitative biomarker of disease activity in neuromuscular disorders. Proc ISMRM 2020, 0340
3- Stolk CC, Sbrizzi A. Understanding the combined effect of k-space undersampling and transient states excitation in MR Fingerprinting reconstructions. IEEE Trans Med Imaging. 2019 Oct;38(10):2445-2455.
4- Kara D, Fan M, Hamilton J, et al. Parameter map error due to normal noise and aliasing artifacts in MR fingerprinting. Magn Reson Med. 2019 May;81(5):3108-3123.
Figures