0579
Diffusion MRI Fiber Diameter for Muscle Denervation Assessment1Radiology and Imaging, Hospital for Special Surgery, New York, NY, United States
Synopsis
Diffusion imaging may provide intracellular muscle denervation characterization complimentary to T2- and fat fraction (FF) mapping. Non-invasive muscle diameter assessment was performed using multi-shell diffusion MRI with a cylindrical model. The apparent fiber diameter (AFD) was obtained using a dictionary method mapping restricted and free fractions to AFD. 16 subjects with suspected muscle denervation involving the brachial plexus and 4 healthy control subjects were imaged. The denervated AFD was smaller than non-denervated and healthy controls by 11 µm and 23 µm respectively. AFD in healthy controls were 67-101 µm, which compare well against histology values from the literature (50-90 µm).
Introduction
Diffusion imaging is sensitive to microstructural muscle cell changes due to exercise(1) or disease(2,3). In muscle denervation, increase in extracellular fluid space(4) is accompanied by muscle atrophy(5) prior to chronic fatty infiltration. Morphological T2-weighted MRI(6), T2-mapping(7,8) and fat fraction (FF)-mapping(8,9) have been used to assess the extent of edema and fatty infiltration, which primarily characterize the extracellular edema and surrounding fascia. The goal is to develop a diffusion-based apparent fiber diameter (AFD) method for performing non-invasive muscle diameter assessment for intracellular characterization, complimentary to extracellular characterization via T2- and FF-mapping, and investigate AFD in evaluating denervated muscle in human subjects.Methods
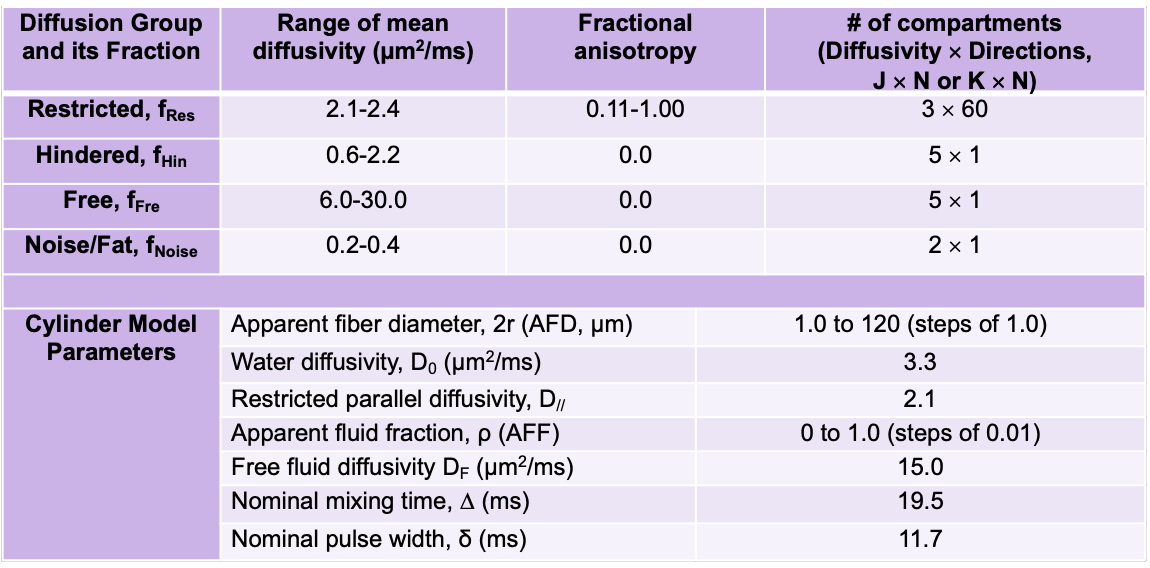
A cylindrical model(10) was used to model radial diffusivity in this work, similar to previous muscle diameter mapping approaches(11–13). Unlike previous approaches that utilized stimulated-echo diffusion tensor imaging (DTI) with a range of diffusion mixing times(11,12,14), spin-echo DTI with multiple b-values was utilized, which allowed for efficient multi-slice acquisition in under 5 minutes. To shorten TE without motion artifacts and minimize EPI distortion, multi-shot acquisition and reconstruction(15) were utilized. Rather than multi-exponential fitting(11), we adopted model-based denoising(16) to denoise as well as to generate a dictionary to map the AFD and apparent fluid fraction (AFF) from the restricted and free diffusivity fractions (parameters in Table 1).Under an institutional-approved protocol, we recruited 16 subjects with suspected muscle denervation involving the brachial plexus and shoulder muscles for imaging (total N=18, 14 unilateral, 2 with bilateral denervation), and 4 healthy subjects for bilateral imaging as controls. Imaging was performed on a 3T system (Signa Premier, GE Healthcare) with multi-shell DTI (FOV=27 cm, TR/TE/ESP=3300/56/0.6 ms, mixing time=19.5-22.7 ms, 2-shots, b-value (directions)=375 s/mm2 (13) and 750 s/mm2 (27), 3 mm-isotropic, 35-38 slices) and two 16-channel flexible coil arrays (Neocoil). PCA-denoising was applied in addition to model-based denoising(17). 2D T2-maps (with B1+ map for correction) and 3D two-point Dixon gradient echo were also acquired to compute T2 and fat fraction (FF) (adjusted for relaxation). Six muscles ROIs were selected (supraspinatus, infraspinatus, subscapularis, deltoid anterior/middle/posterior) on 3 or more slices. Excluding ROIs with artifacts and misalignment there were a total of 47 control, 36 un-denervated, and 68 denervated muscles. Denervation was assessed by one radiologist from 2D T2-weighted Dixon-FSE. 14 of the 18 patient scans (50/68 muscles) had electromyography confirmation of muscle denervation. Two-sample t-tests with Holm-Bonferroni correction (a=0.05) were used to compare between control, un-denervated and denervated muscles. The metrics compared included mean, axial, radial diffusivities (MD, AD, RD), AFD, AFF, T2 and FF.
Results
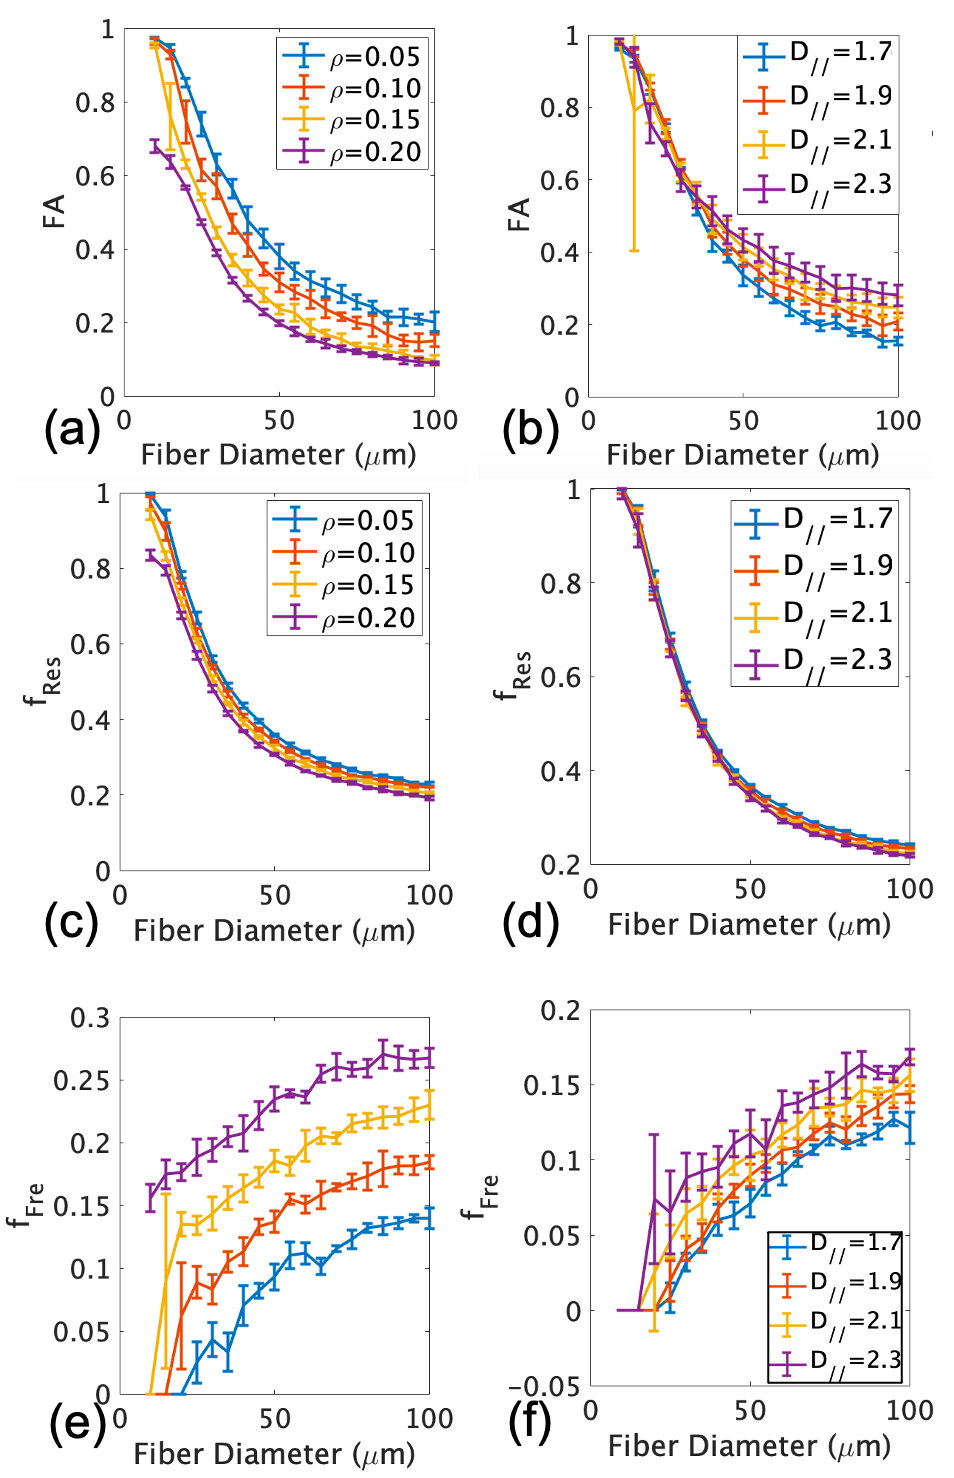
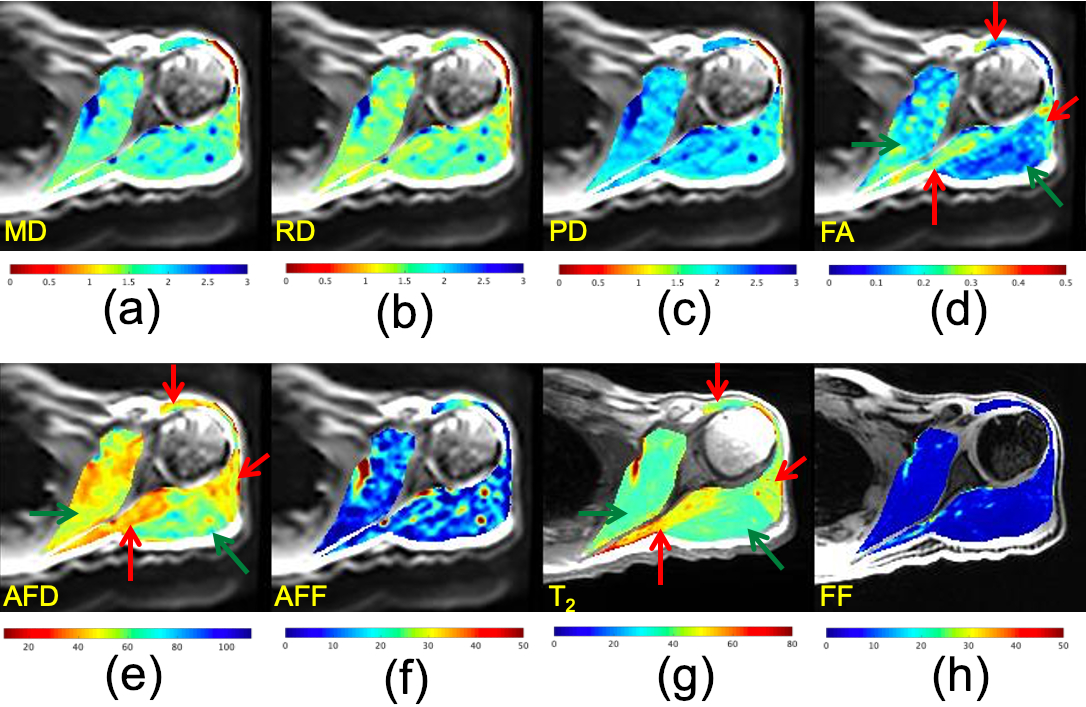
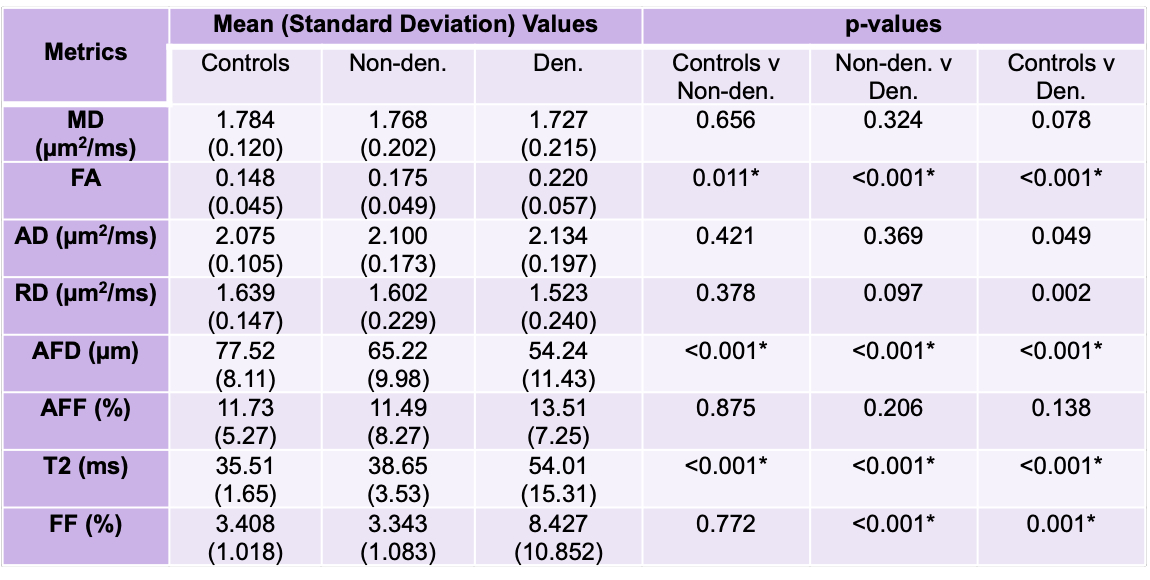
Simulations show that both FA (Fig.1a,c) and restricted fraction (Fig.1b,d) decreased with increased fiber diameter; however, restricted fraction had tighter distributions than FA and was more invariant to parallel diffusivity and presence of fluid. Hence, the restricted fraction was more robust than FA as a predictor of fiber diameter changes. Increased simulated fluid fraction and parallel diffusivity decreased the restricted fraction (Fig. 1b,d) but increased the free fraction (Fig. 1e,f). This implied both restricted and free fractions were required for the dictionary.Fig.2 shows maps from a patient with muscle denervation, demonstrating increased T2 and FA, but decreased AFD in denervated muscles. Table 2 summarizes group comparison results, which show significant differences in AFD (denervated<non-denervated<controls), FA and T2 (denervated>non-denervated>controls). When analyzed by muscle-type, there were more muscles with significantly different AFD than FA (results not shown).
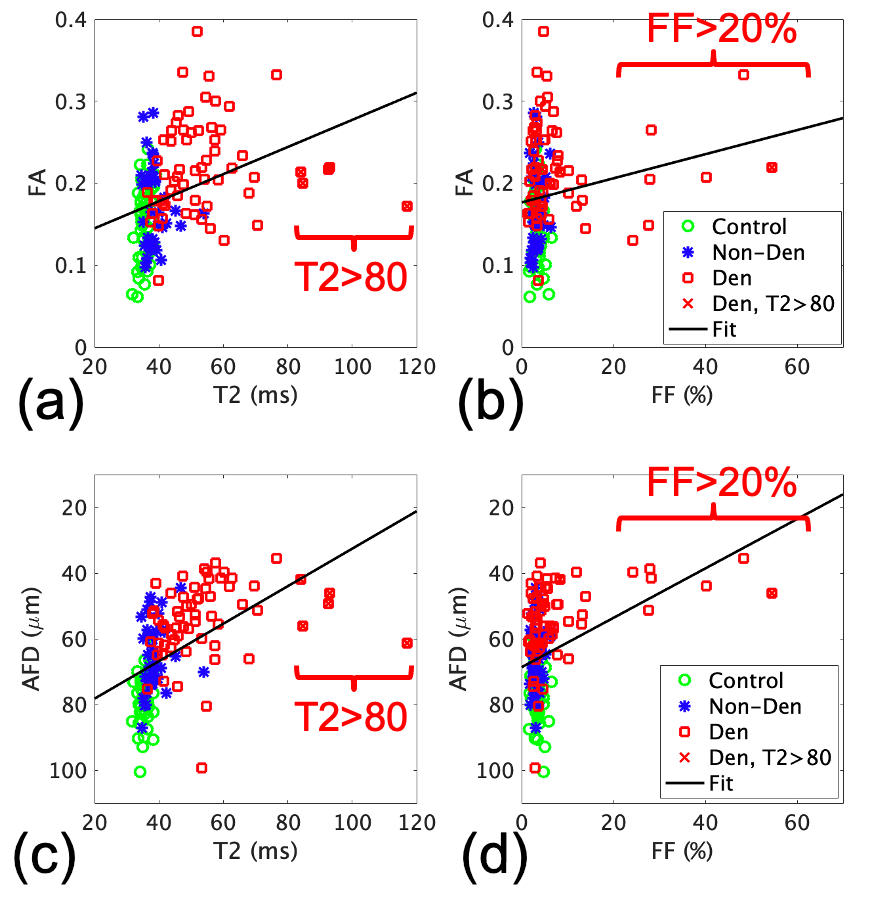
The correlation between AFD and T2 (r=-0.395, p<0.001, Fig. 3c) was stronger than that between FA and T2 (r=0.184, p=0.024, Fig. 3a). Some muscles with very high T2 (>80 ms) had smaller FA (0.17-0.22) and larger AFD (42-61µm), which may be indicative of biphasic behavior of AFD with T2. The correlation between AFD and FF (r=-0.532, p<0.001, Fig.3d) was stronger than the correlation between FA and T2 (r=0.365, p<0.001, Fig. 3b). The correlation between AFD and FA was low (-0.450, p<0.001).
Discussion
This study found a range of AFD of 67-101 µm in healthy shoulder muscles, which compare well with literature values from human limb muscle histology (50-90 µm(18), 62.4-72.2 µm(19)). Previous work using stimulated-echo diffusion and different mixing times (30-1500 ms) to map human muscle size had established correlation with histology and physiology, but underestimated muscle size vs. histology (~30-40 µm vs. ~50-70 µm in shoulder and calf (12), ~40-55 µm vs. ~55-70 µm in the calf(20)). We plan to validate AFD against human muscle biopsy results in the future.While Monte-Carlo simulations show correlation of DTI-based FA with different disease states affecting muscle diameter and permeability(21), animal studies had found varying changes in FA due to muscle denervation(22–24). In comparison, our study found that AFD correlated better with T2 and FF than standard FA. We speculate that AFD mapping may provide a more robust depiction of muscle fiber atrophy than standard FA.
Conclusion
Diffusion-based fiber diameter mapping may provide muscle cell characterization complimentary to T2- and FF-mapping of denervated muscle.Acknowledgements
This work was supported in part by NIH R21-TR003033. The opinions or assertions contained herein are the private views of the authors and are not to be construed as official or reflecting the views of the NIH. ETT and DBS receive research support from GE Healthcare. The authors thank Sophie Queler, Jaemin Shin and Maggie Fung for technical assistance.References
1. Hooijmans MT, Monte JRC, Froeling M, et al. Quantitative MRI Reveals Microstructural Changes in the Upper Leg Muscles After Running a Marathon. J Magn Reson Imaging 2020;52:407–417 doi: 10.1002/jmri.27106.
2. Sigmund EE, Sui D, Ukpebor O, et al. Stimulated echo diffusion tensor imaging and SPAIR T2‐weighted imaging in chronic exertional compartment syndrome of the lower leg muscles. J Magn Reson Imaging 2013;38:1073–1082 doi: 10.1002/jmri.24060.
3. Hooijmans MT, Damon BM, Froeling M, et al. Evaluation of skeletal muscle DTI in patients with duchenne muscular dystrophy. Nmr Biomed 2015;28:1589–1597 doi: 10.1002/nbm.3427.
4. Kamath S, Venkatanarasimha N, Walsh MA, Hughes PM. MRI appearance of muscle denervation. Skeletal Radiol 2008;37:397–404 doi: 10.1007/s00256-007-0409-0.
5. Eichelberger L, Akeson WH, Roma M. Effects of Denervation on the Histochemical Characterization of Skeletal Muscle During Growth. Am J Physiology-legacy Content 1956;185:287–298 doi: 10.1152/ajplegacy.1956.185.2.287.
6. Tepeli B, Karata M, Cokun M, Yemiçi OÜ. A Comparison of Magnetic Resonance Imaging and Electroneuromyography for Denervated Muscle Diagnosis. J Clin Neurophysiol 2017;34:248–253 doi: 10.1097/wnp.0000000000000364.
7. Ha D, Choi S, Kang E, Park HT. Diffusion tensor imaging and T2 mapping in early denervated skeletal muscle in rats. J Magn Reson Imaging 2015;42:617–623 doi: 10.1002/jmri.24818.
8. Sinclair CDJ, Morrow JM, Janiczek RL, et al. Stability and sensitivity of water T2 obtained with IDEAL‐CPMG in healthy and fat‐infiltrated skeletal muscle. Nmr Biomed 2016;29:1800–1812 doi: 10.1002/nbm.3654.
9. Janiczek RL, Gambarota G, Sinclair CDJ, et al. Simultaneous T₂ and lipid quantitation using IDEAL-CPMG. Magnet Reson Med 2011;66:1293–302 doi: 10.1002/mrm.22916.
10. Neuman CH. Spin echo of spins diffusing in a bounded medium. J Chem Phys 1974;60:4508 4511 doi: 10.1063/1.1680931.
11. Kim S, Chi‐Fishman G, Barnett AS, Pierpaoli C. Dependence on diffusion time of apparent diffusion tensor of ex vivo calf tongue and heart. Magnet Reson Med 2005;54:1387–1396 doi: 10.1002/mrm.20676.
12. Fieremans E, Lemberskiy G, Veraart J, Sigmund EE, Gyftopoulos S, Novikov DS. In vivo measurement of membrane permeability and myofiber size in human muscle using time‐dependent diffusion tensor imaging and the random permeable barrier model. Nmr Biomed 2017;30:e3612 doi: 10.1002/nbm.3612.
13. Vangelderen P, Despres D, Vanzijl PCM, Moonen CTW. Evaluation of Restricted Diffusion in Cylinders. Phosphocreatine in Rabbit Leg Muscle. J Magnetic Reson Ser B 1994;103:255–260 doi: 10.1006/jmrb.1994.1038.
14. Karampinos DC, Banerjee S, King KF, Link TM, Majumdar S. Considerations in high-resolution skeletal muscle diffusion tensor imaging using single-shot echo planar imaging with stimulated-echo preparation and sensitivity encoding. Nmr Biomed 2011;25:766 778 doi: 10.1002/nbm.1791.
15. Chen N, Guidon A, Chang H-C, Song AW. A robust multi-shot scan strategy for high-resolution diffusion weighted MRI enabled by multiplexed sensitivity-encoding (MUSE). Neuroimage 2013;72:41 47 doi: 10.1016/j.neuroimage.2013.01.038.
16. Sperl JI, Sprenger T, Tan ET, Menzel MI, Hardy CJ, Marinelli L. Model-based denoising in diffusion-weighted imaging using generalized spherical deconvolution. Magnet Reson Med 2017;78:2428–2438 doi: 10.1002/mrm.26626.
17. Sneag DB, Zochowski KC, Tan ET, et al. Denoising of diffusion MRI improves peripheral nerve conspicuity and reproducibility. J Magn Reson Imaging 2020;51:1128–1137 doi: 10.1002/jmri.26965.
18. Maier F, Bornemann A. Comparison of the muscle fiber diameter and satellite cell frequency in human muscle biopsies. Muscle Nerve 1999;22:578–583 doi: 10.1002/(sici)1097-4598(199905)22:5<578::aid-mus5>3.0.co;2-t.
19. Meznaric M, Cvetko E. Size and Proportions of Slow-Twitch and Fast-Twitch Muscle Fibers in Human Costal Diaphragm. Biomed Res Int 2016;2016:1–6 doi: 10.1155/2016/5946520.
20. Sigmund EE, Novikov DS, Sui D, et al. Time‐dependent diffusion in skeletal muscle with the random permeable barrier model (RPBM): application to normal controls and chronic exertional compartment syndrome patients. Nmr Biomed 2014;27:519–528 doi: 10.1002/nbm.3087.
21. Berry DB, Regner B, Galinsky V, Ward SR, Frank LR. Relationships between tissue microstructure and the diffusion tensor in simulated skeletal muscle. Magnet Reson Med 2018;80:317–329 doi: 10.1002/mrm.26993.
22. Holl N, Echaniz-Laguna A, Bierry G, et al. Diffusion-weighted MRI of denervated muscle: a clinical and experimental study. Skeletal Radiol 2008;37:1111–1117 doi: 10.1007/s00256-008-0552-2.
23. Zhang J, Zhang G, Morrison B, Mori S, Sheikh KA. Magnetic resonance imaging of mouse skeletal muscle to measure denervation atrophy. Exp Neurol 2008;212:448–457 doi: 10.1016/j.expneurol.2008.04.033.
24. Yamabe E, Nakamura T, Oshio K, Kikuchi Y, Toyama Y, Ikegami H. Line scan diffusion spectrum of the denervated rat skeletal muscle. J Magn Reson Imaging 2007;26:1585–1589 doi: 10.1002/jmri.21184.
Figures