0577
Resonant oscillatory modes in rat cortical activity revealed by ultra-fast fMRI1Champalimaud Research, Champalimaud Centre for the Unknown, Lisbon, Portugal, 2Life and Health Sciences Research Institute, University of Minho, Braga, Portugal
Synopsis
We provide evidence of the oscillatory nature of spontaneous BOLD signal fluctuations by performing a spectral analysis of fMRI signals recorded at unprecedented time resolution (TR = 38 ms) from a frontal brain slice of sedated and anesthetized rats. Oscillations peaking between 0.03 Hz and 0.25 Hz are detected in the cortex under sedation, drastically decreasing in power with deep anaesthesia. Notably, the power of BOLD signal oscillations is modulated in space and time, synchronizing in phase across distant bilateral brain areas, providing insights into the mechanisms underlying resting-state functional connectivity.
Introduction
The biophysical mechanisms mediating system-level integration in the brain remain unclear. Neuroimaging studies have demonstrated the relevance of large-scale correlation patterns detected in BOLD signal at rest, yielding so-called resting-state networks that appear disrupted in most psychiatric disorders.However, the origin and in particular the oscillatory nature of ultra-slow BOLD signal fluctuations remains elusive. Unlike the canonical event-related hemodynamic response function, oscillations are sinusoidal waves with a consistent periodicity resulting in a characteristic peak in the system’s frequency power spectrum. Recently, ultra-slow oscillations have been reported to emerge in fMRI signal, but their full characterization has been hindered by the limited temporal resolution of the acquisitions [1, 2]. Therefore, further investigating BOLD oscillations at high temporal resolution may shed light into the mechanisms coupling brain areas together.
Methods
A frontal slice of the brain was scanned from 3 female rats under 3 different conditions: Medotomidine, Isoflurane 1% and Isoflurane 3% (two scans per rat in each condition). A fourth dead rat was scanned twice with the same parameters to serve as control.Ultra-fast resting-state fMRI acquisitions:
GE-EPI: TR/TE=38/11ms, FOV=21x21mm^2, in-plane resolution=250x250um^2, slice thickness=1.2mm, tacq=10m8s, flip angle=15 degrees, Nreps=16000, matrix size=84x84).
Anatomical image acquisitions:
MGE: TE = 2.5:5:97.5 ms, TR = 300ms, flip angle = 40degrees, FOV = 21x21 mm^2, in-plane resolution = 100x100um^2, slice thickness =1.2 mm.
Spectral analysis of fMRI data:
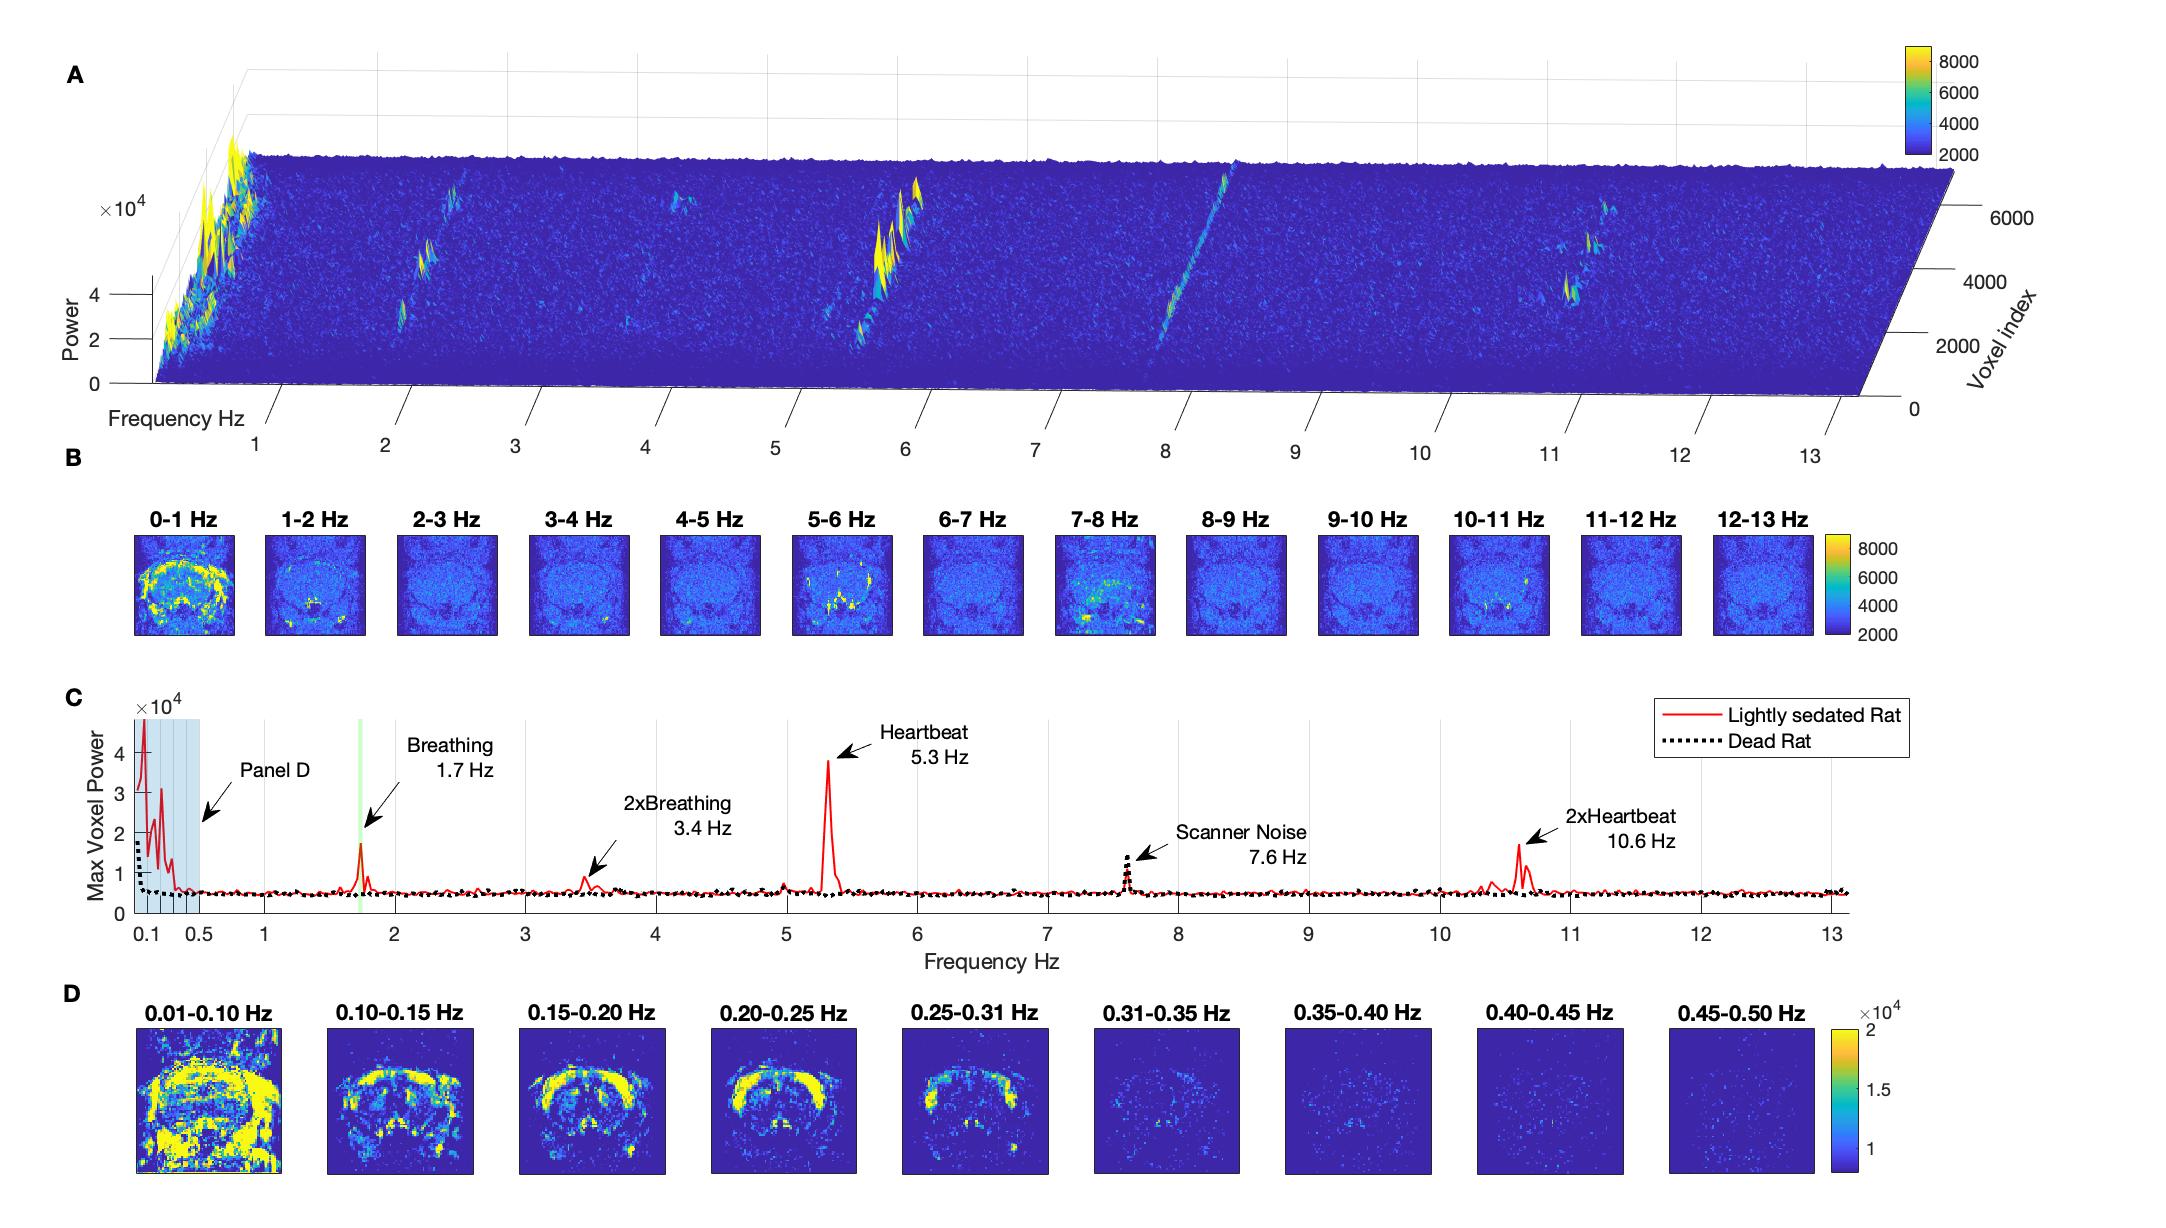
Power spectra were computed on each of the 84x84=7056 voxels, after ghost correcting, detrending and removing the first 500 frames. Voxel-wise power spectra were obtained up to the Nyquist frequency of (2TR)-1=13.1579 Hz with 1000 frequency bins of 0.0263 Hz each (Figure 1A). Spectral power maps report the power in each voxel averaged across frequency bins (Figures 1, 2 and 3). All spectral analyses were performed at the single scan level. Beyond the expected differences in physiological rhythms, with breathing and heartbeat frequencies – and corresponding harmonics - decreasing with the depth of anaesthesia, no other frequencies above 0.25 Hz were found to differentiate between conditions or resonate above control-levels.
Results
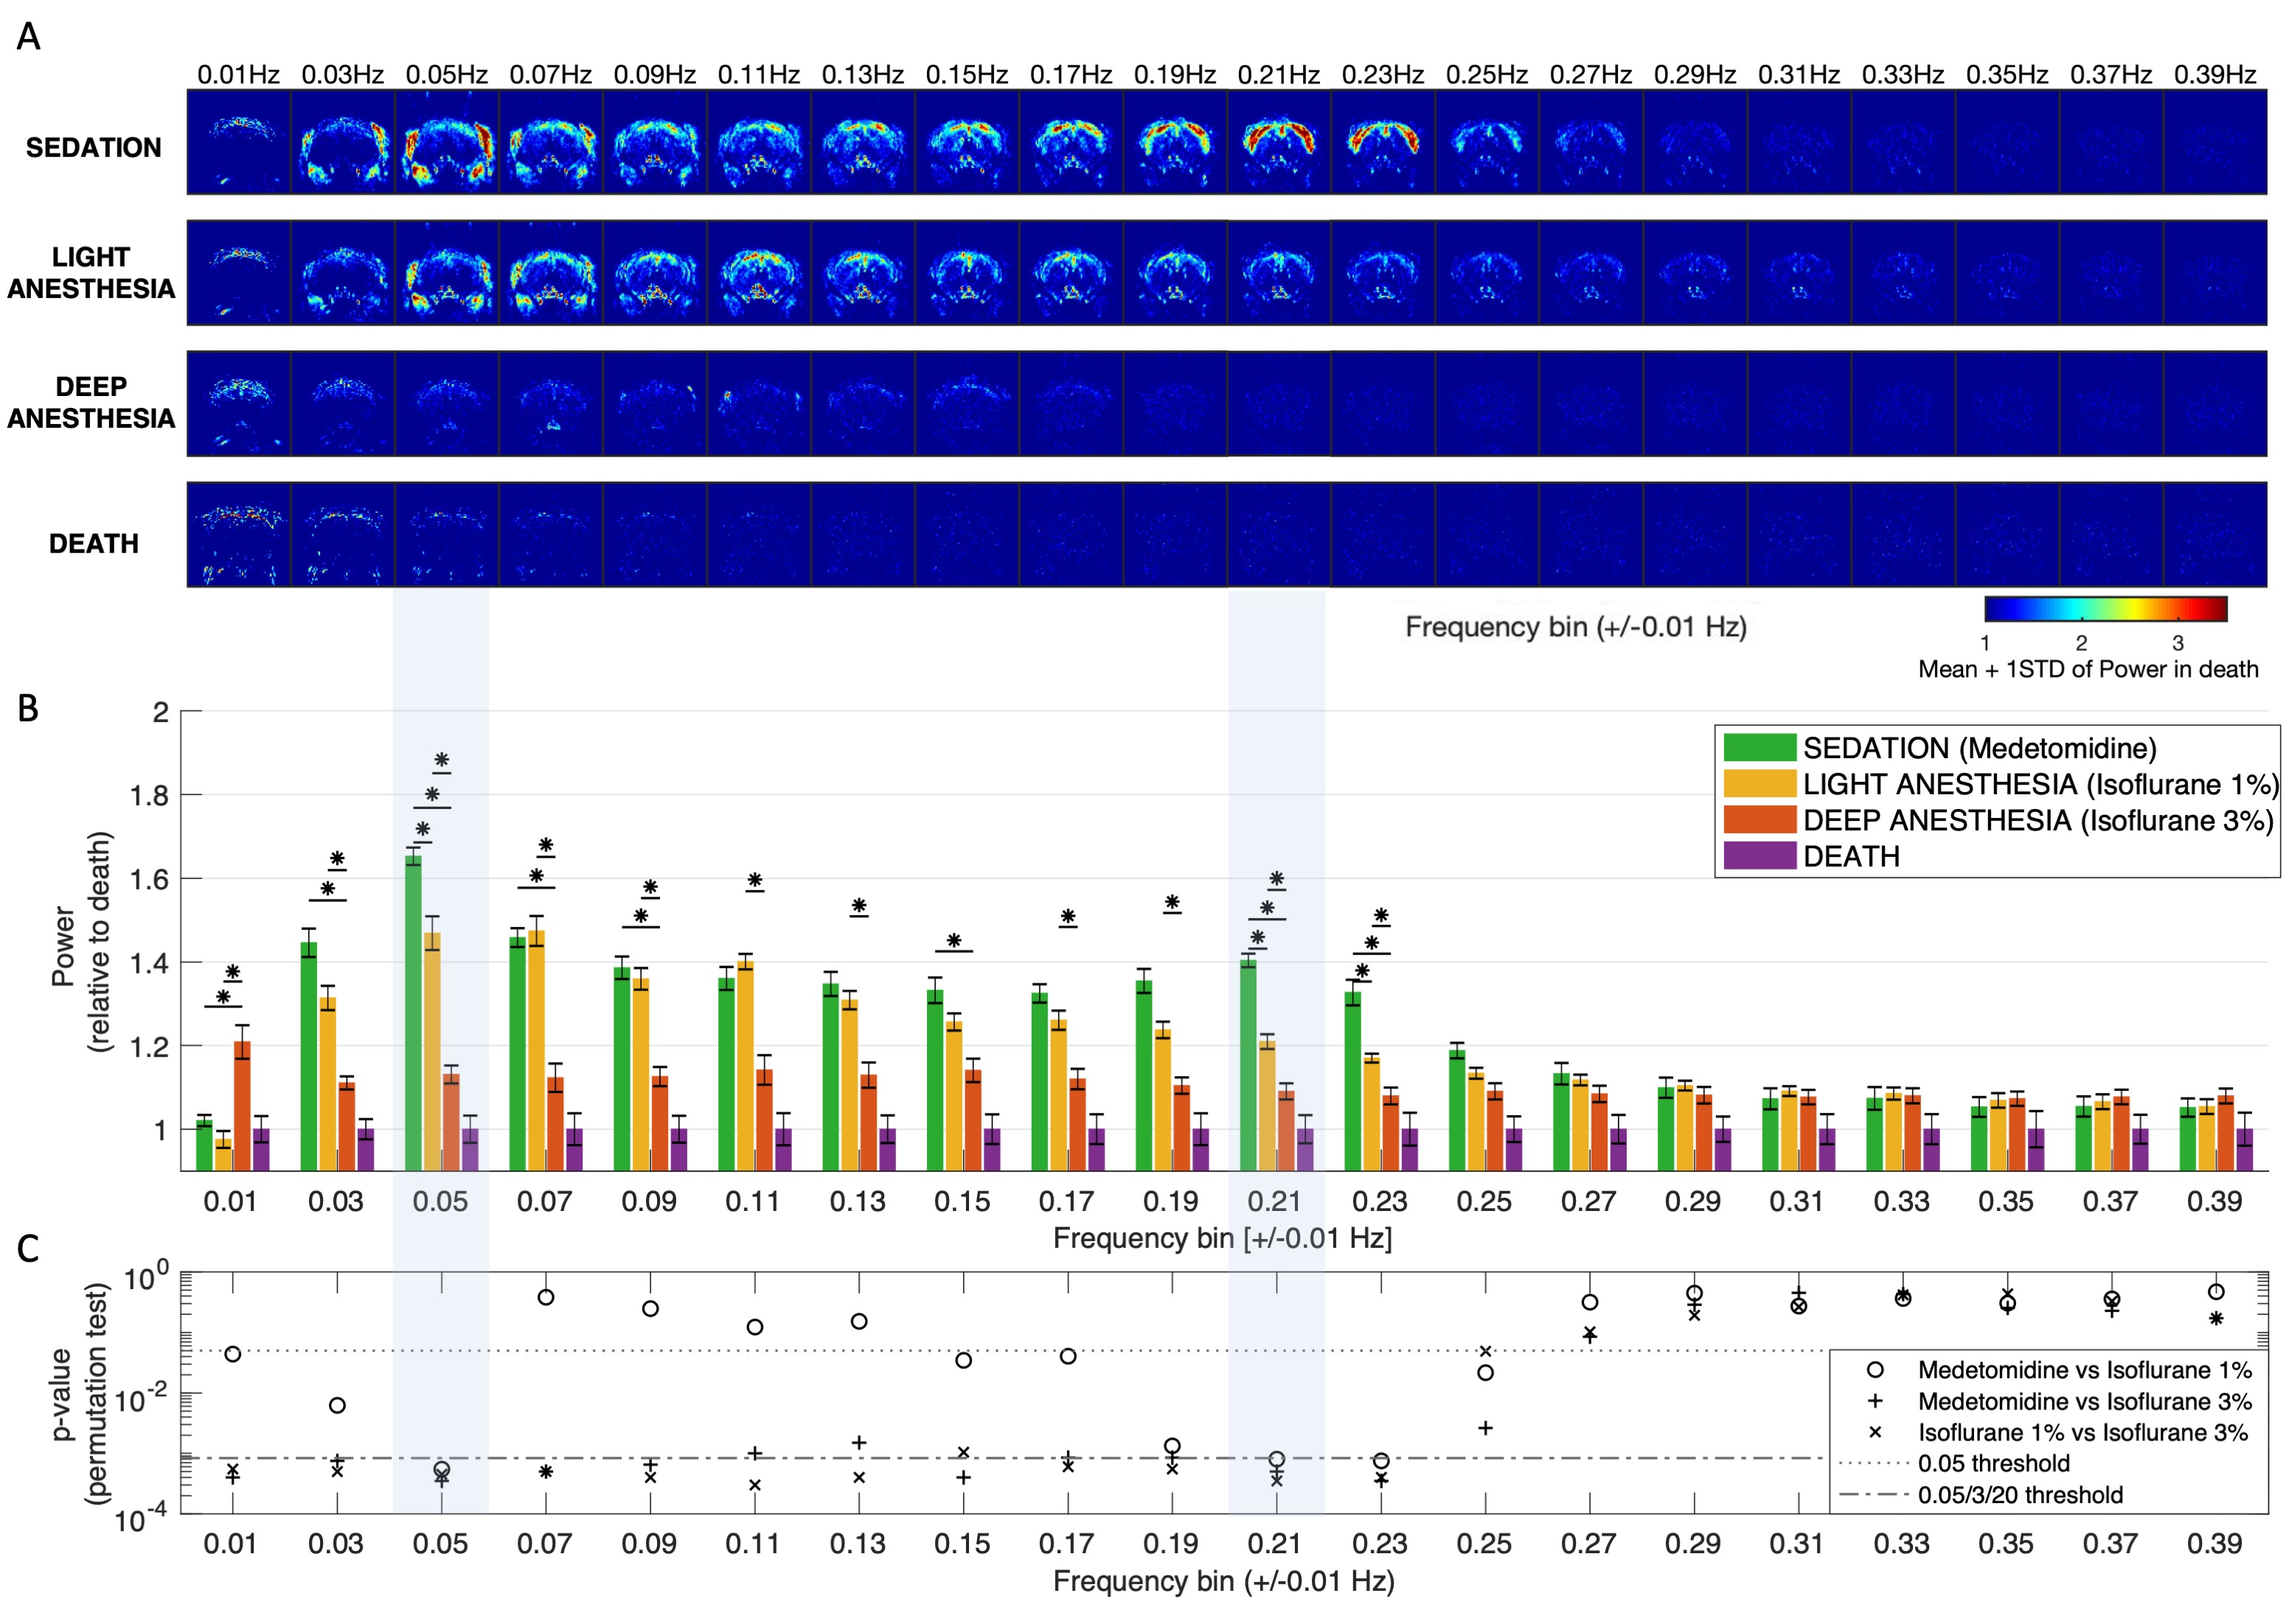
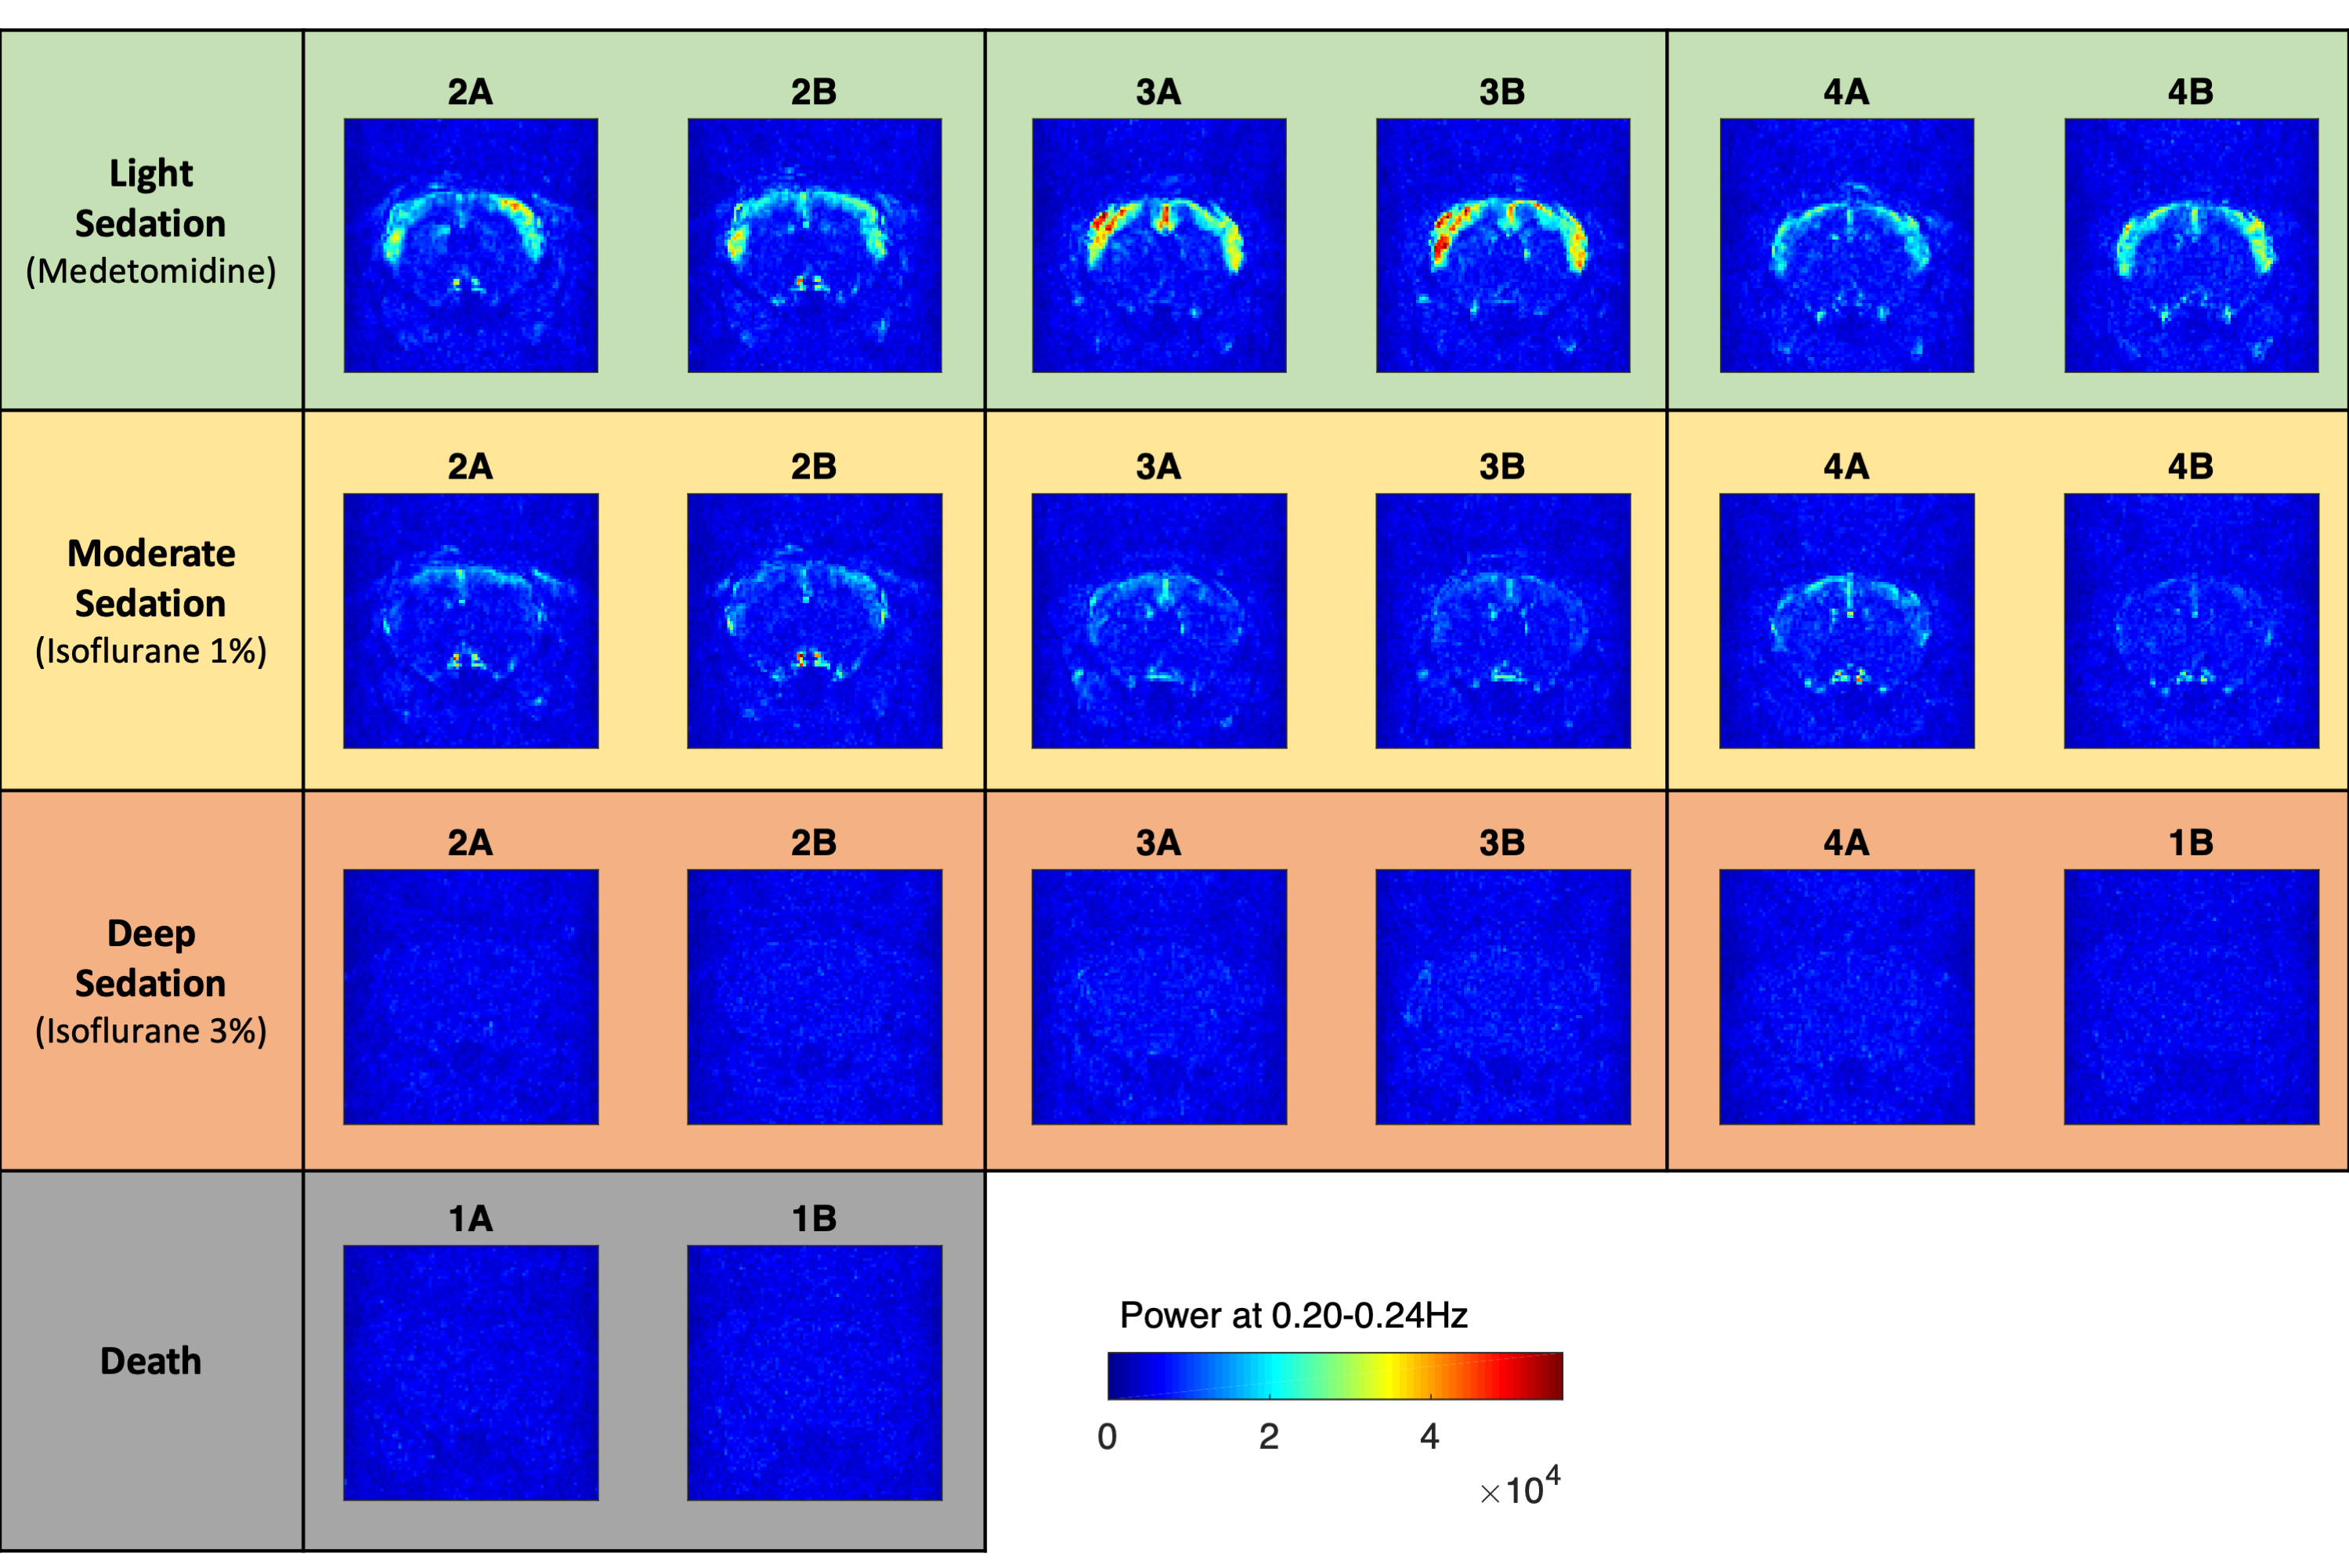
All frequencies between 0.02Hz and 0.24Hz were found to resonate above control levels in live animals (Figure 2). Importantly, the spatial distribution of power is found to be different across frequencies, with slower components (peaking at 0.05Hz) being detected both in the brain and muscles, whereas faster components (peaking at 0.21 Hz) are detected mostly within the cortex. Notably, these two spatially- and frequency-distinct resonant modes are the ones that most significantly differentiate between all 3 conditions (p<0.00083, surviving Bonferroni correction). The power in these frequencies is the highest in sedated rats (under Medetomidine) and decreases with Isoflurane concentration. These differences are detected not only at the group level but are also clearly visible in individual scans (Figure 3).Oscillations were also detected between 0.06 and 0.20 Hz in cortical and subcortical structures, present with similar power both in sedation and light anaesthesia (p>0.03), but vanishing sharply with deep anaesthesia (all p<0.001, Figure 2). Notably, while oscillations between 0.02 and 0.24 Hz were found to decrease in power with isoflurane concentration, oscillations below 0.02 Hz were found to increase concomitantly in cortical areas under deep anaesthesia.
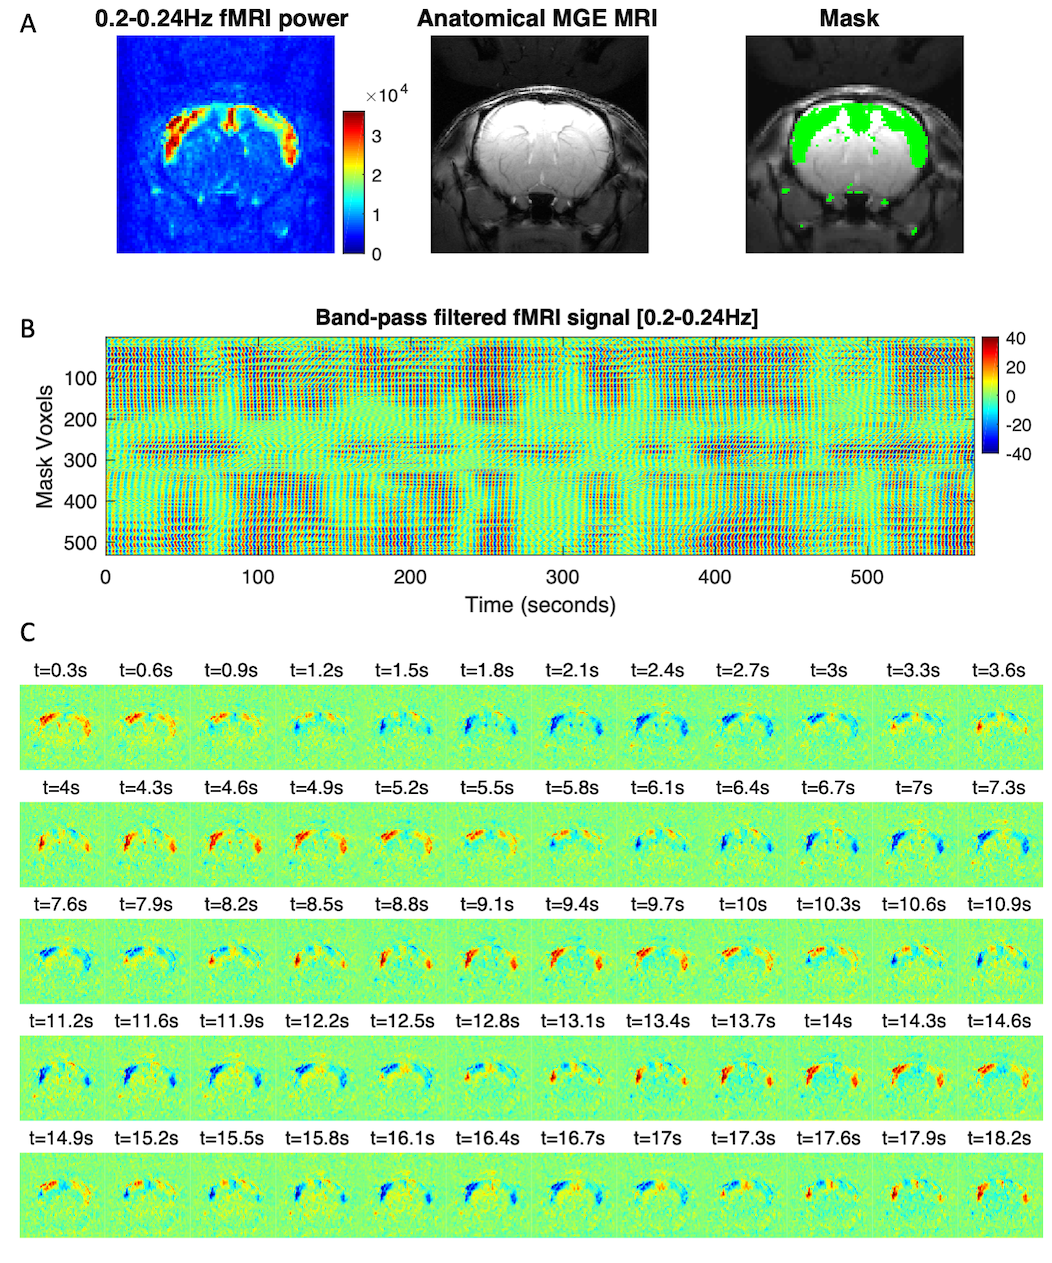
Filtering the fMRI signal in the 0.20-0.24Hz band reveals oscillations organized both in space and in time (Figure 4). Beyond emerging within spatially defined cortical boundaries (see Figure 4A), we find that the power of the oscillations fluctuates over time (Figure 4B), and their phases are locked across space, exhibiting in-phase synchronization between bilateral cortical areas (Figure 4C).
Discussion
Our results provide insights into the mechanisms orchestrating the collective behaviour of billions of neurons together through the engagement into rhythmic activity patterns. Overall, these results align with the proposed mechanistic scenario that resting-state networks emerge from metastable cluster synchronization, obeying to universal laws governing the behaviour of coupled oscillators in Nature across a range of scales and fields, from animal swarms to electron clouds [3-5]. In this scenario, each cortical column resonating in the gamma-frequency band represents an oscillatory unit, which, when coupled in the brain network structure may be transiently engaged into macroscopic oscillations emerging at substantially slower collective frequencies [6, 7].Conclusion
These results provide evidence of resonant oscillations occurring at ultra-slow frequencies in the brain, bringing fresh insights into the principles governing collective integration in the nervous system.Acknowledgements
This study was funded by the European Research Council (ERC) (agreement No. 679058). JC was supported by Portuguese Foundation for Science and Technology (CEECIND/03325/2017, UIDB/50026/2020 and UIDP/50026/2020) and by the European Regional Development Fund (ERDF) project NORTE-01-0145-FEDER-000013.References
1. Gutierrez-Barragan, D., et al., Infraslow state fluctuations govern spontaneous fMRI network dynamics. Current Biology, 2019. 29(14): p. 2295-2306. e5.
2. Drew, P.J., et al., Ultra-slow oscillations in fMRI and Resting-State connectivity: neuronal and vascular contributions and technical confounds. Neuron, 2020.
3. Cabral, J., et al., Role of local network oscillations in resting-state functional connectivity. Neuroimage, 2011. 57(1): p. 130-9.
4. Deco, G., et al., Key role of coupling, delay, and noise in resting brain fluctuations. Proc Natl Acad Sci U S A, 2009. 106(25): p. 10302-7.
5. Cabral, J., M. Kringelbach, and G. Deco, Functional Connectivity dynamically evolves on multiple time-scales over a static Structural Connectome: Models and Mechanisms. Neuroimage, 2017. 160: p. 84-96.
6. Cabral, J., et al., Exploring mechanisms of spontaneous functional connectivity in MEG: how delayed network interactions lead to structured amplitude envelopes of band-pass filtered oscillations. Neuroimage, 2014. 90: p. 423-35.
7. Niebur, E., H.G. Schuster, and D.M. Kammen, Collective frequencies and metastability in networks of limit-cycle oscillators with time delay. Phys Rev Lett, 1991. 67(20): p. 2753-2756.
Figures