0575
Power and Frequency Fluctuations of Gastric Electrical Activity Modulate fMRI Activity in Rat Brains1Biomedical Engineering, University of Michigan, ANN ARBOR, MI, United States, 2Electrical Engineering and Computer Science, University of Michigan, ANN ARBOR, MI, United States
Synopsis
The stomach-brain interaction is critical for regulating gastric function. Prior studies suggest that the brain maintains a slow rhythm coupled to the gastric slow wave – a rhythmic activity that paces the stomach. Here, we find a brain network encodes the frequency and power fluctuations of gastric rhythms in the resting state. Rhythmic activity of the stomach primarily engages the NTS-insula-somatosensory network. Dysrhythmic activities, such as bradygastria and tachygastria engage additional regions in the anterior cingulate cortex, prelimbic cortex, and infralimbic cortex. The alternation of dysrhythmic and pace-making activity in the stomach causes activity fluctuations across a central gastric network.
Purpose
The stomach-brain interaction is critical for regulating gastric function. Prior studies suggest that the human brain maintains a slow rhythm coupled to the gastric slow wave – a rhythmic activity that paces the stomach [1][2]. Here, we test an alternative hypothesis that the brain, instead of maintaining neural copies of gastric rhythms, encodes their frequency and power fluctuations. To test this hypothesis, we acquired concurrent fMRI and electrogastrogram (EGG) from rats and assessed the relationship between the fMRI signal and the frequency or power fluctuation of EGG.Method
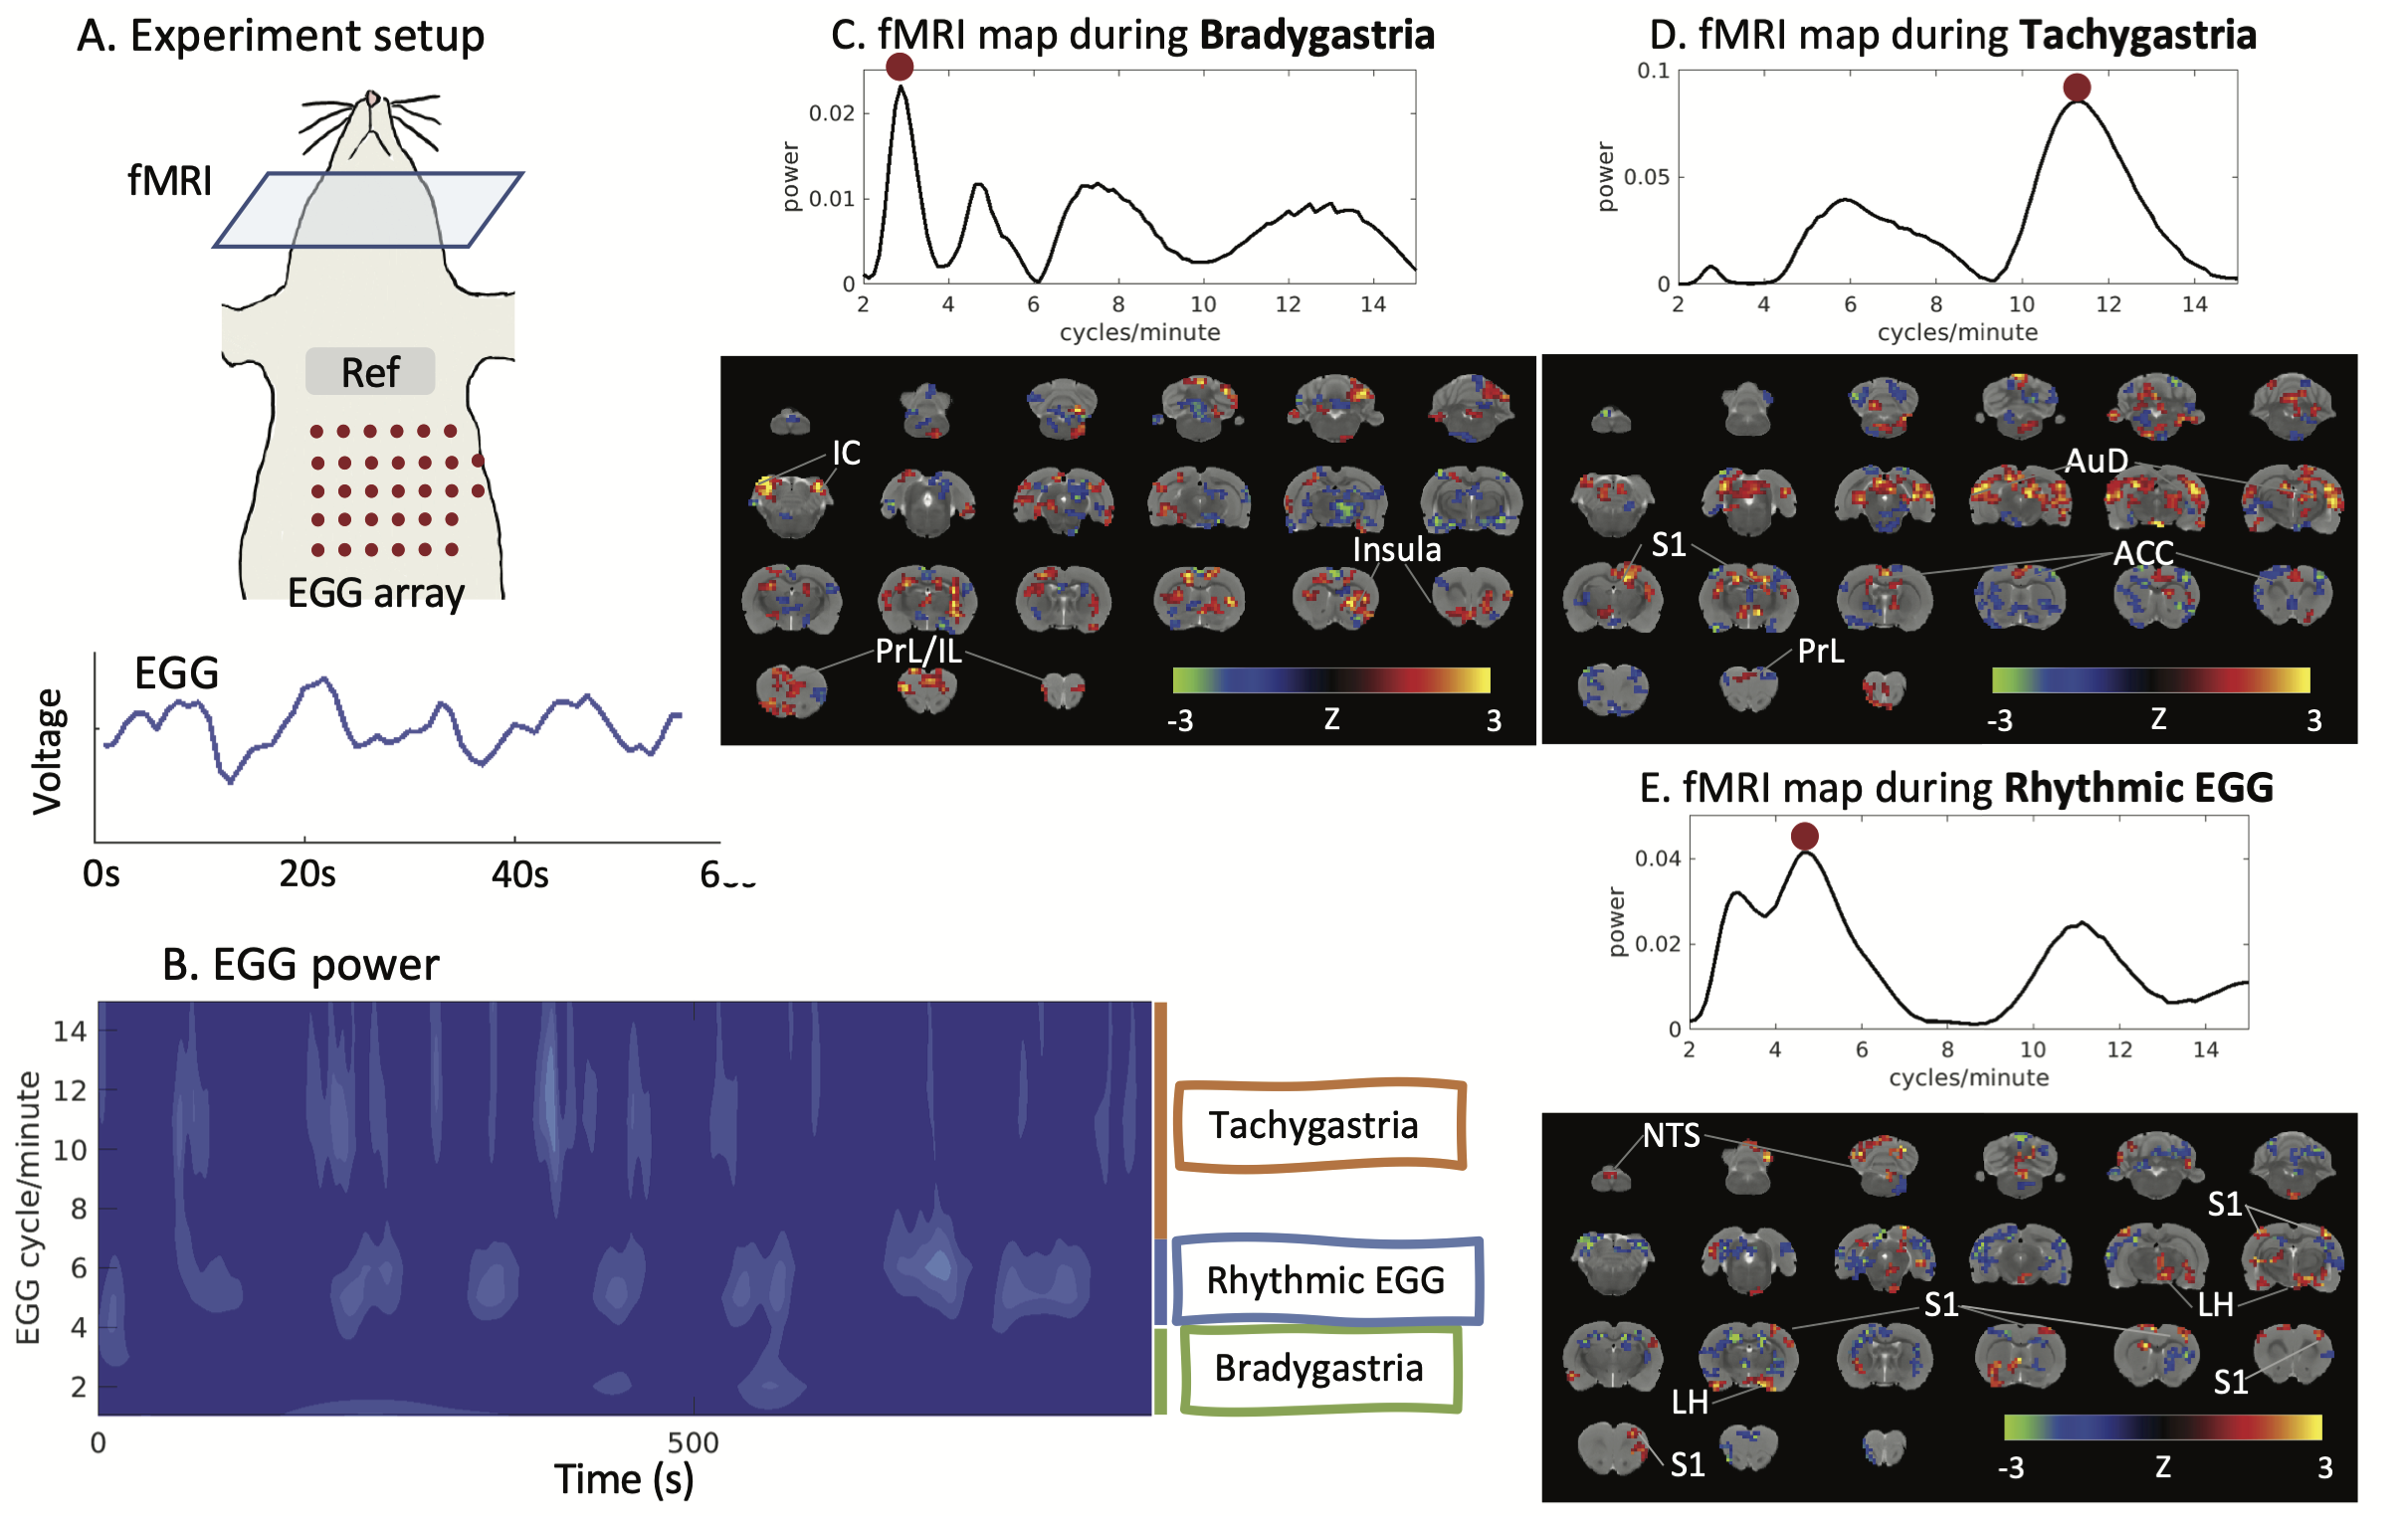
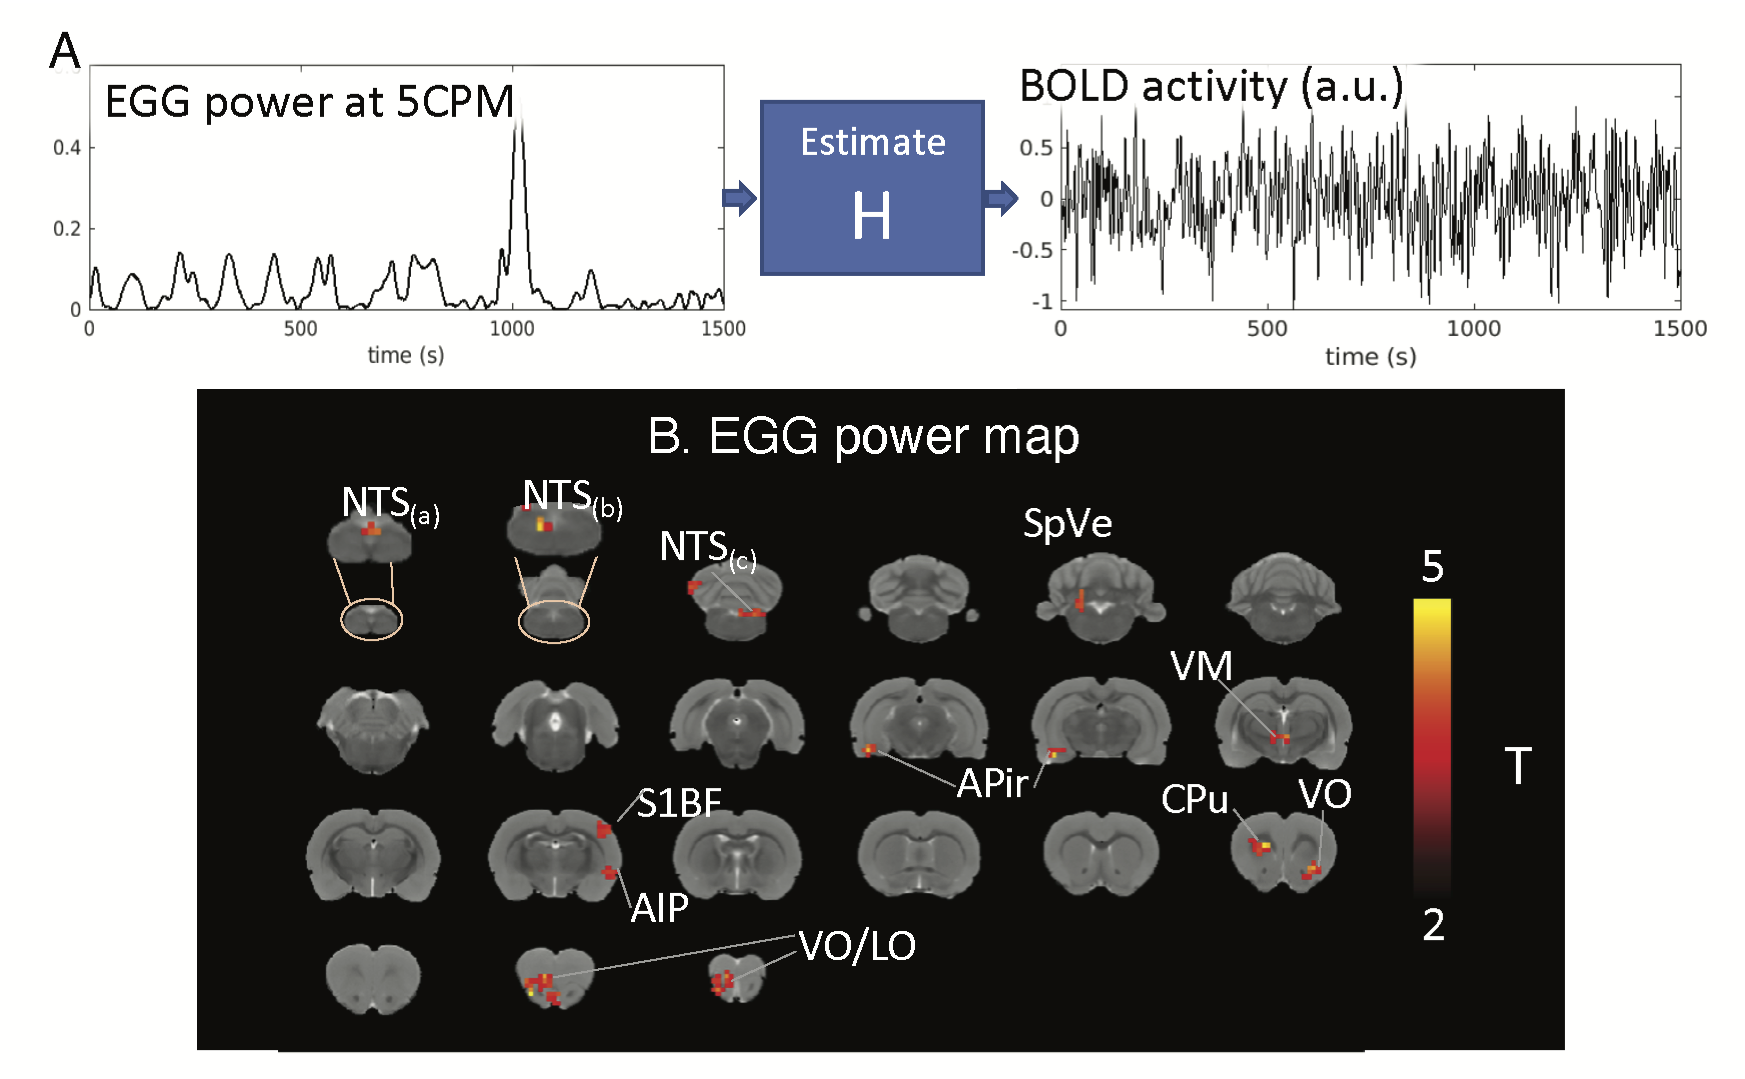
We performed MRI together with EGG on eight Sprague Dawley rats. Each animal was trained to voluntarily consume 5g Gd-DPTA labeled dietgel, and then was anesthetized with continuous dexmedetomidine (SC-infusion, 0.015 mg/Kg/h) and isoflurane (0.1-0.5% mixed in O2). A multi-channel electrode array was placed on the body surface for EGG recording (Fig. 1A). EGG was recorded using an electrophysiological recording system (Tucker Davis Technologies Inc.). The rat’s brain was scanned with 2-D single-shot gradient-echo echo-planar imaging (EPI, TR=1s, TE=16.5ms, FA=60°, in-plane resolution=0.5×0.5×1 mm3) in a 7-tesla small-animal MRI system (BioSpec 70/30, Bruker). Two imaging sessions were acquired for each rat.In the off-line analysis, EGG signal was filtered (0.45Hz low-pass filter) and downsampled to match the sampling rate of fMRI. Wavelet analysis was applied to extract power fluctuations of EGG at multiple frequencies from one cycle per minute (CPM) to 15 CPM. The frequency-power relationship was assessed at individual time points. When the peak frequency of maximal power was between 4-7CPM, EGG reflected the normal pace-making activity, whereas bradygastria (or tachygastria) was when the peak frequency was lower than 4CPM (or higher than 7CPM). FMRI signals were first preprocessed with a standard routine and then used for combined analyses with EGG. Instantaneous fMRI maps, occurred during bradygastria, tachygastria, or normal pace-making activity, were averaged, resulting in a co-activation pattern evoked by each type of gastric events. Then, we randomly separated data into training and testing dataset. The training dataset included 13944 time points from eight imaging sessions; the testing dataset included 1743 time points from one session. In the training dataset, we used EGG power at individual frequencies and the BOLD activity to estimate the response function H for each voxel (refer to Fig.2A). Robustness of H was evaluated in the testing dataset by calculating the Pearson correlation between the measured BOLD activity and the estimated BOLD activity obtained from H. Correlation was converted to z-score for further statistical analysis to map the BOLD correlates to the EGG power.
Results
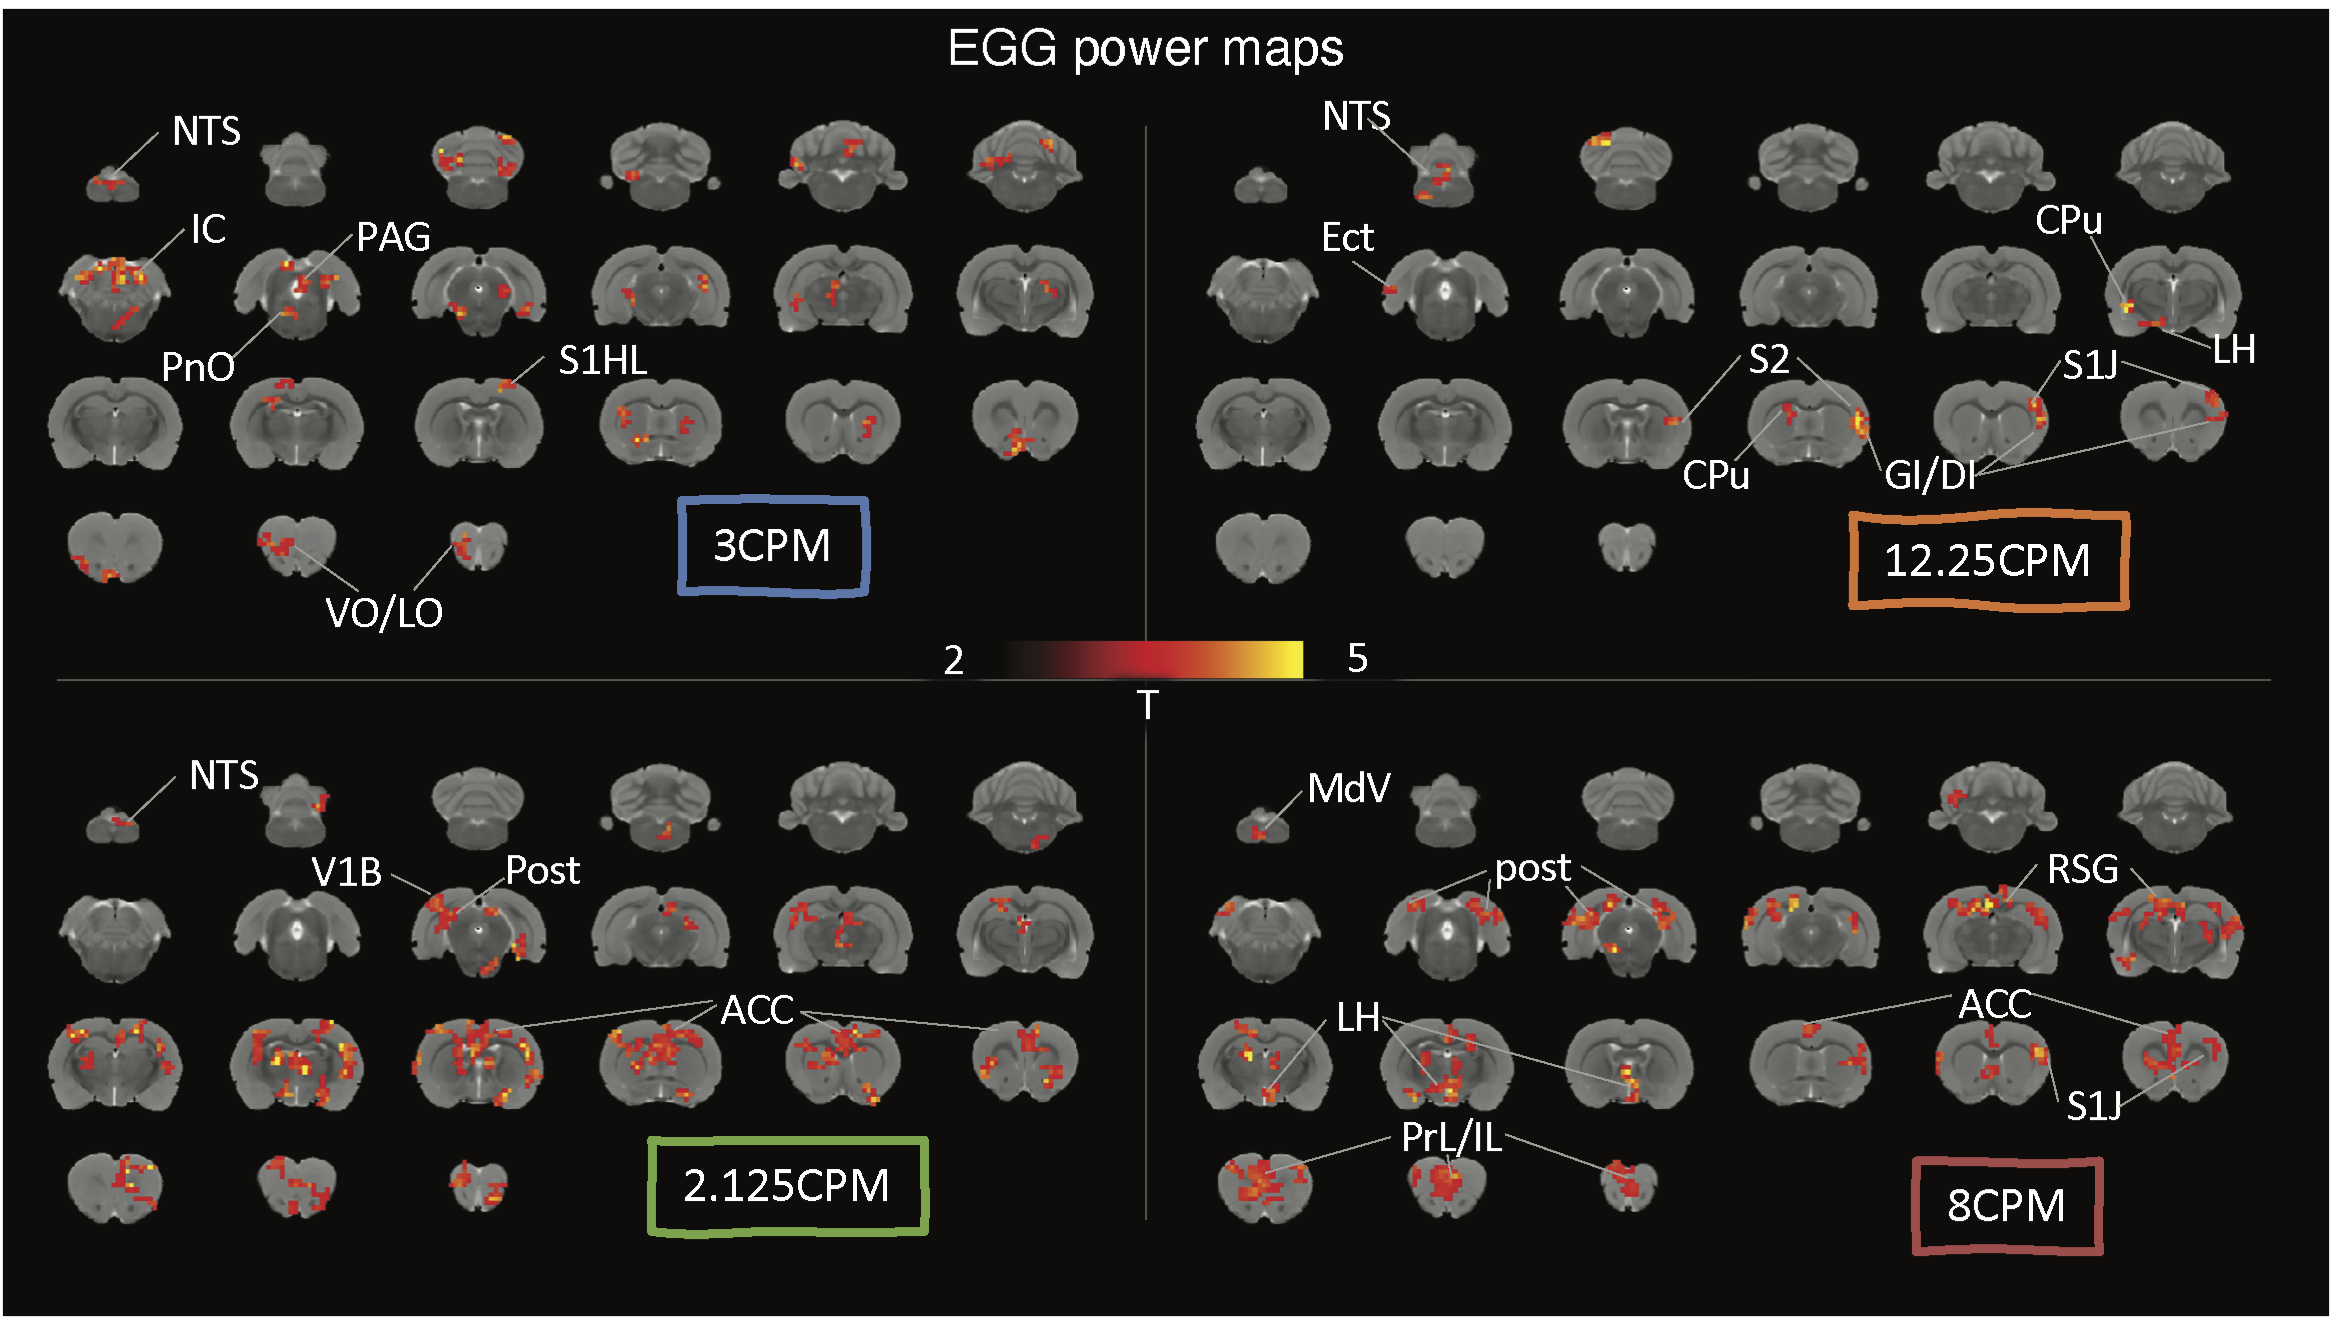
With simultaneous recordings of EGG and fMRI, we were able to assess the relationship between the BOLD activity and various features of EGG. We first focused on the EGG frequency. Depending on the dominant frequency, gastric activity at individual time points fell into three conditions, bradygastria, tachygastria, and pace-making activity (Fig.1B). Following changes of gastric activity, the brain-wide fMRI map also varied. The somatomotor area was more active during pace-making activity. So was the nucleus of the solitary tract (NTS), the relay nuclei between the stomach and the brain (Fig.1E). The pattern changed during dysrhythmic activity. The inferior colliculus and the prefrontal cortex were more active at bradygastria (Fig.1C), and the auditory cortex and primary somatosensory cortex at tachygastria (Fig.1D). In brief, fluctuations of gastric frequency had distinctive network signatures in the brain. We also targeted temporal fluctuations of EGG power and tested their relationship with the BOLD activity. Using this analysis, we mapped the EGG power network at various frequencies. The NTS was clearly identified in the network at 5CPM, within the normal frequency range. Some gastric related regions in the forebrain were also observed, such as the ventromedial thalamic nucleus, insular cortex, and orbital cortex (Fig.2B). EGG power analysis also revealed distinct networks beyond normal EGG frequency, suggesting a complex impact of EGG power. Some identical patterns were shown in Fig.3. Networks for 2.125 CPM and 8 CPM included both the prefrontal area, but with subtle differences. The network at 2.125CPM involved more of the anterior cingulate cortex and insula, while its 8CPM counterpart involved more of the prelimbic and infralimbic cortex. The influence at 3CPM was mainly restricted in the hindbrain, involving the inferior colliculus and periaqueductal gray, while EGG power at 12.25CPM might regulate the forebrain and target focally in the somatosensory cortex and insula. The somatosensory cortex was presence across these networks, but different subfields were observed at different frequencies. The low-frequency networks primally involved the limb field, and the high-frequency networks were more in the jaw and lip regions.Conclusion
The brain encodes the frequency and power fluctuations of gastric activity in the resting state. The pace-making activity of the stomach primarily engages the NTS-insula-somatosensory network. Dysrhythmic activities, such as bradygastria and tachygastria engage additional regions in the anterior cingulate cortex, prelimbic cortex, and infralimbic cortex. The alternation of dysrhythmic and pace-making activity in the stomach causes activity fluctuations across a central gastric network in the brain.Acknowledgements
No acknowledgement found.References
[1] Richter CG, Babo-Rebelo M, Schwartz D, Tallon-Baudry C. Phase-amplitude coupling at the organism level: The amplitude of spontaneous alpha rhythm fluctuations varies with the phase of the infra-slow gastric basal rhythm. NeuroImage. 2017 Feb 1;146:951-8.
[2] Rebollo I, Devauchelle AD, Béranger B, Tallon-Baudry C. Stomach-brain synchrony reveals a novel, delayed-connectivity resting-state network in humans. Elife. 2018 Mar 21;7:e33321.
Figures