0571
Salience network modulation leads a sequence of brain activity that causes resting-state fMRI correlations with EEG and physiological signals1Pennsylvania State Universitya, University Park, PA, United States
Synopsis
Correlations of resting-state fMRI (rsfMRI) with various neural and physiological signals have been observed and interpreted as distinct sources of contributions. Here, we found these rsfMRI-EEG and rsfMRI-physio correlations are similarly characterized by distinct network patterns at different time lags. A similar sequence of fMRI changes led by the salience network modulation is found in resting-state fMRI signals, and removing this sequence significantly diminished the rsfMRI-EEG and rsfMRI-physiology correlations. The results suggest that the rsfMRI correlations with the EEG alpha power and physiological signals originate from a sequence of brain dynamics led by salience network changes.
Introduction
Correlations of resting-state fMRI (rsfMRI) signals with various neural and physiological signals have been reported and regarded as different sources of contributions to their spontaneous fluctuations 1–3. However, the rsfMRI correlations with EEG alpha-band (8-12 Hz) power, photo-plethysmography (PPG) amplitude, heart rate, and respiratory volumes all showed a similar spatial pattern with larger amplitude in sensory modalities 1–4. Moreover, the rsfMRI-physiology correlations are strongly dependent on EEG alpha power, as well as brain conditions, and significant only under sleep-conducive eye-close condition but not so with subjects opening their eyes 5. Thus, the rsfMRI correlations with neural and physiological signals may not be separate processes but arise from certain brain-state-dependent event associated with strong co-modulations of various neural and physiological signals. A possible candidate is a recently discovered sequential spectral transition (SST) event that underlies the global mean rsfMRI signal and represents transient arousal modulations of ~10-20 seconds 6, which would likely affect cardiac and respiratory functions through autonomic regulation.Another intriguing feature of the rsfMRI-EEG correlations are region-specific delays. The thalamus rsfMRI reached its peak positive correlations with EEG alpha power with a much shorter delay than the negative correlations at sensory/motor regions 7. Large global rsfMRI peaks, which was linked to SST, showed a sensory-dominant co-activation pattern that is preceded by significant thalamic de-activations by a few seconds 6. These findings not only provided further evidence linking rsfMRI-EEG correlations and SST event, but also suggested the existence of a specific sequence of fMRI dynamics. Here, we investigate the rsfMRI dynamics underlying its correlations with neural and physiological signals.
Methods
We simultaneously collected EEG and fMRI signals from 27 subjects at the resting state. Each scanning session lasted for 10 min. The alpha-band power was extracted within 8-12 Hz from three occipital electrodes. Heart rate (HR) and respiratory volume (RV) were calculated. The EEG alpha power/HR/RV was correlated with the voxel-wise rsfMRI signals with different time shifts to obtain rsfMRI correlation maps at different lags. Then the lag-dependent correlation maps were averaged across sessions and converted to z-score maps with reference to control maps, which were computed in a similar way but with reversing rsfMRI time course. The time points with sensory-dominant pattern were selected based on a point process analysis 8. Specifically, for each session, we derived averaged time courses of fMRI signals within sensorimotor, auditory, and visual cortices, respectively and normalized by its own standard deviation (SD). The time points with sensory-dominant pattern were defined at which the amplitude of all the three was larger than 1SD.Results
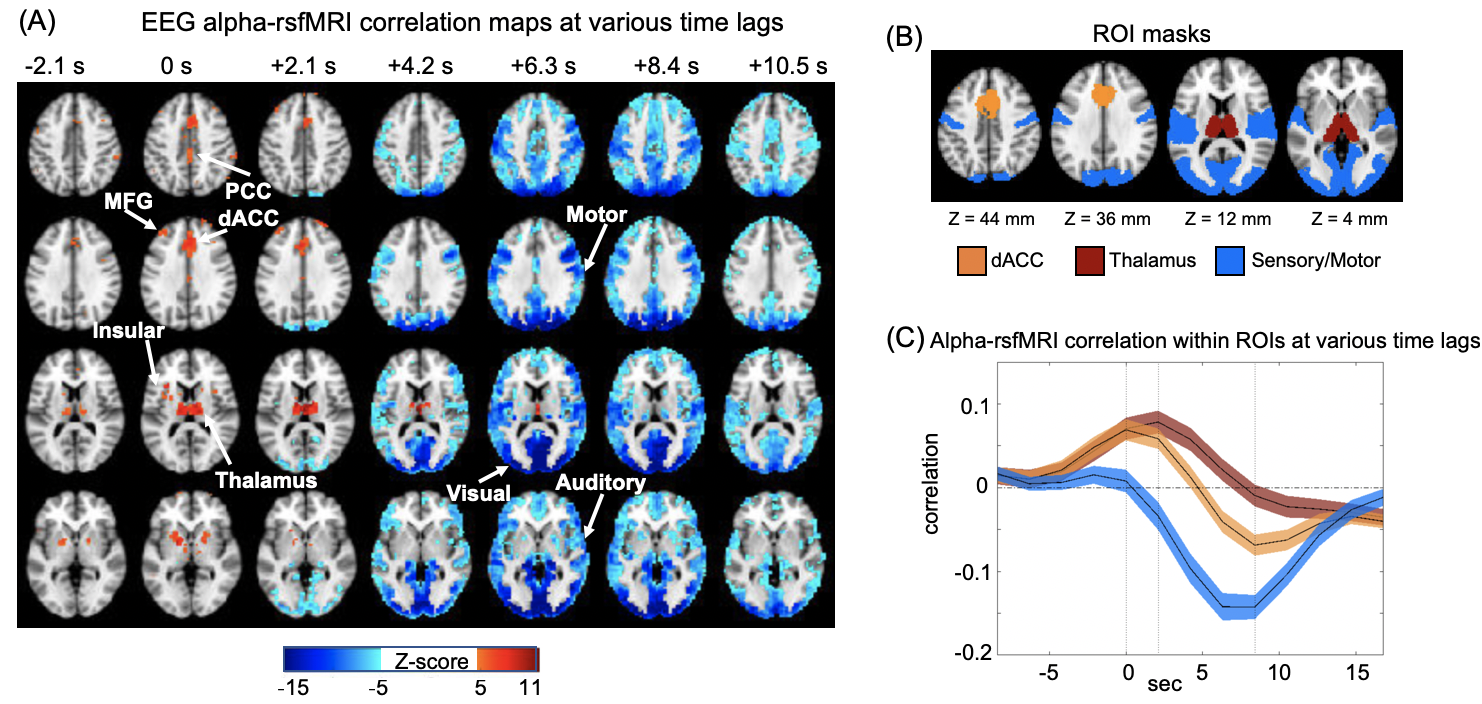
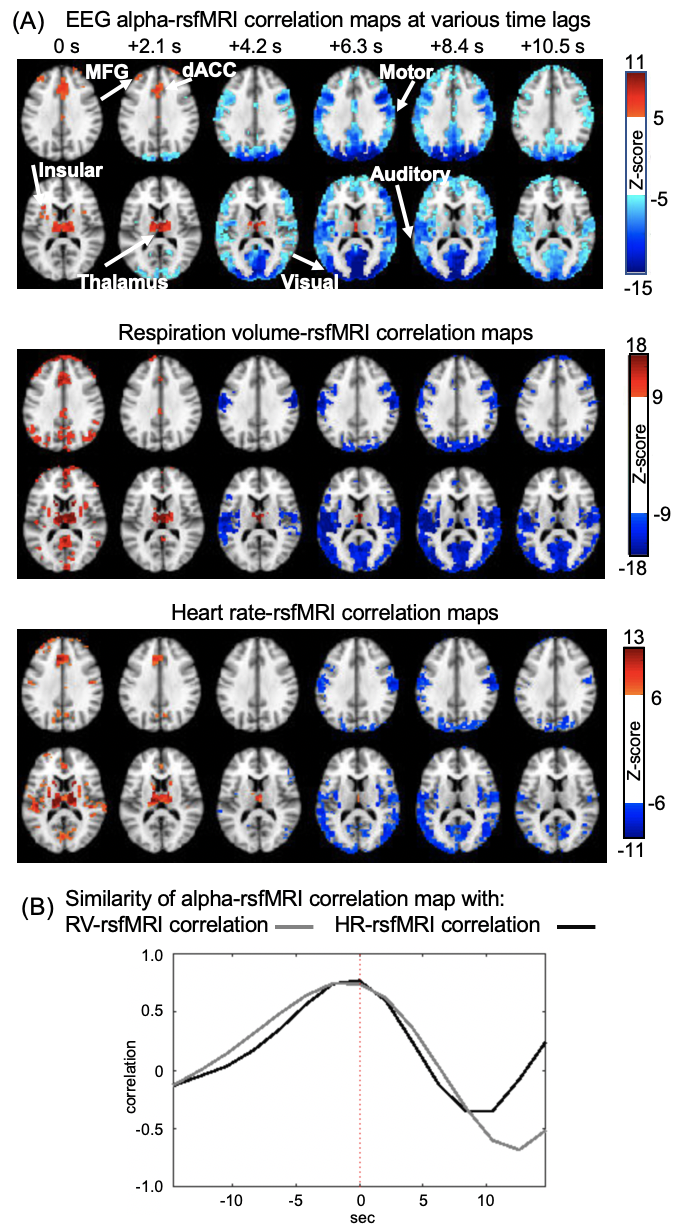
Correlation between EEG alpha power and fMRI signals showed distinct patterns at various time lags (Fig. 1A). Specifically, the salience network, which mostly encompasses the thalamus, dorsal anterior cingulate cortex (dACC), and insular, showed a peak positive correlation with the EEG alpha at the time lag of 0 and 2.1 seconds (note: rsfMRI as the reference). In contrast, strong negative correlations were observed mostly in the sensory/motor regions at the 6-7 seconds lag consistent with the typical hemodynamic delay 9(Fig. 1B).RsfMRI correlations with the heart rate (HR) and respiratory volume (RV) at different time lags showed similar spatiotemporal patterns as the alpha-rsfMRI correlation. The positive correlations were also observed in the key nodes of the salience network, including thalamus, dACC, and insular, at 0 and 2.1-second lags, whereas negative correlations are mostly in the sensory/motor regions at 6.3 seconds lag (Fig. 2A). These two sequences of correlation maps are similar to that of the alpha-rsfMRI correlations as shown by their peak cross-correlations of 0.77 and 0.74 respectively (Fig. 2B).
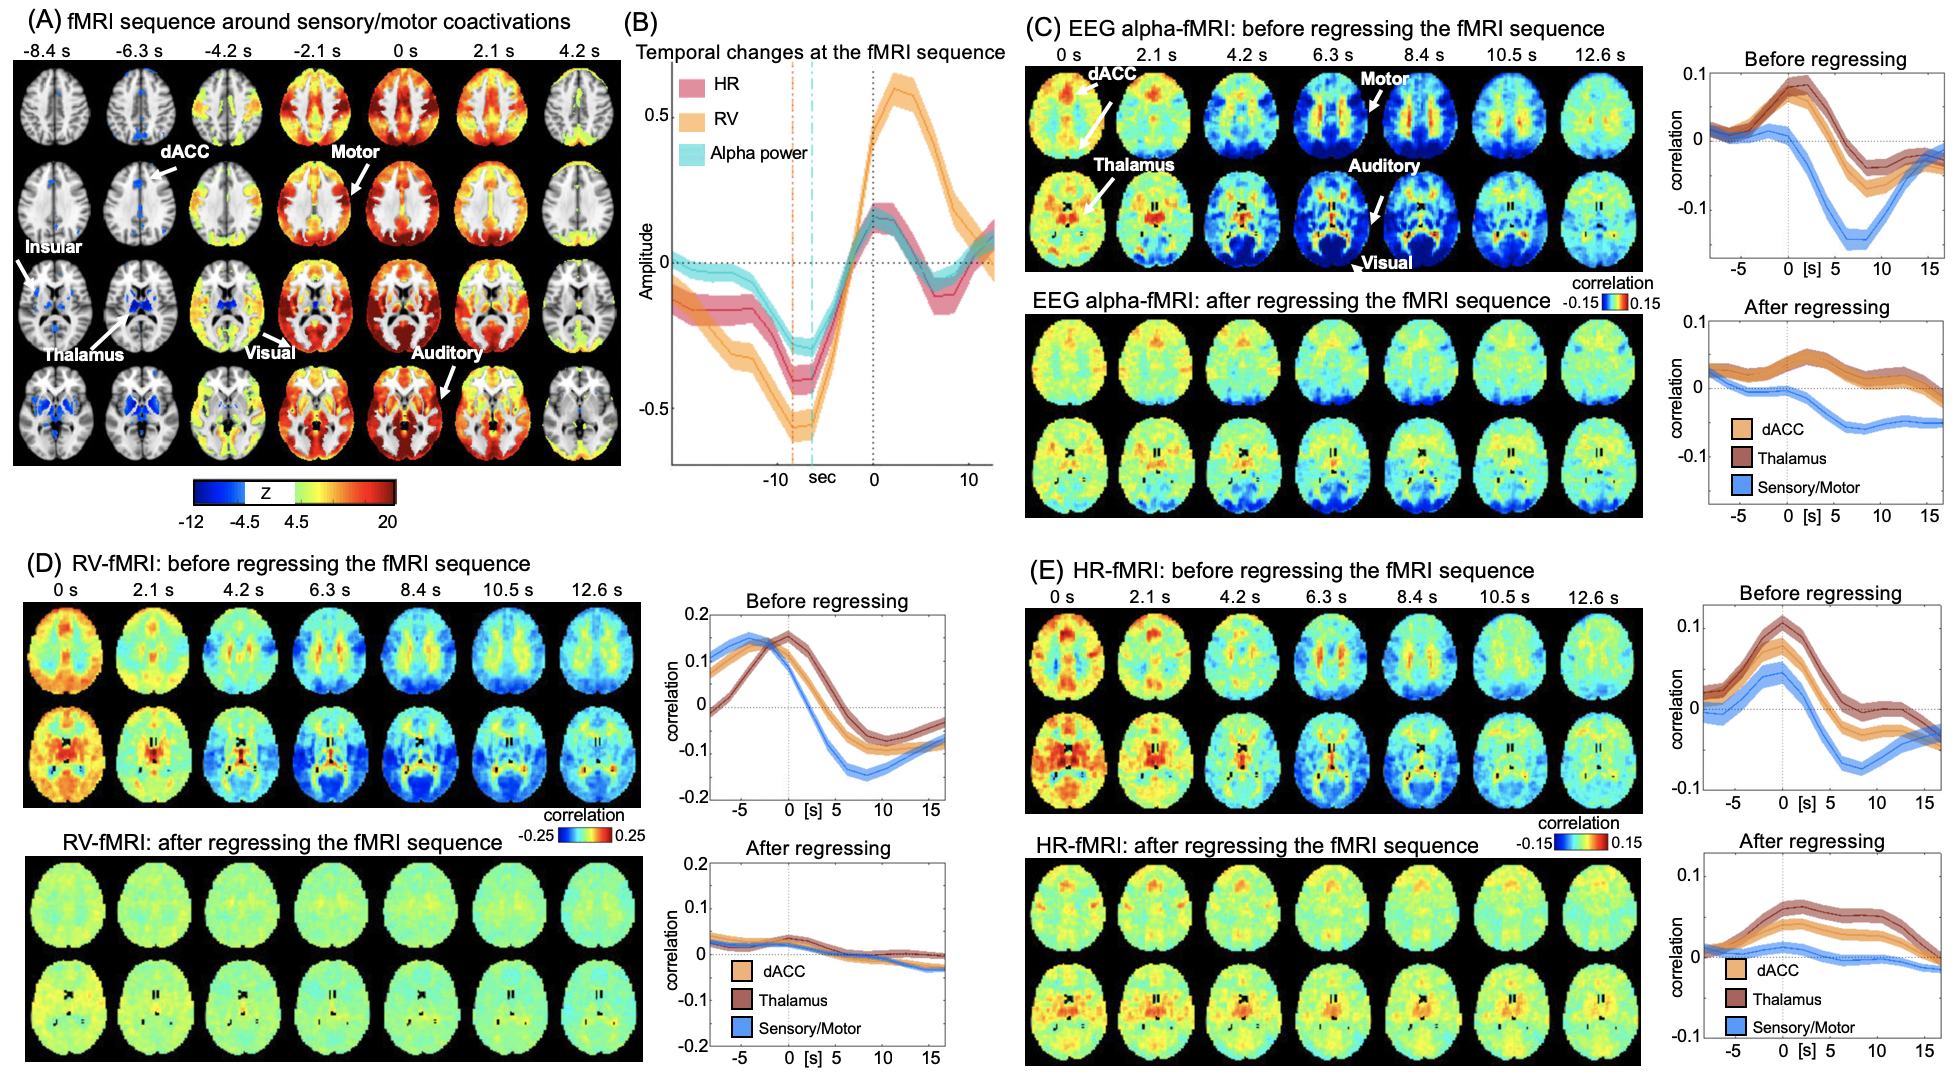
We then tested whether a similar sequence of fMRI changes may exist since the correlations at different time lags may result from distinct brain processes not necessarily related to each other. To achieve this goal, we averaged rsfMRI time segments around time points showing a strong sensory-dominant co-activation, a pattern similar to the alpha-rsfMRI correlation at the time lag of 6.3 sec. Consistent with our hypothesis, significant de-activation of the salience network occurred ~6 seconds before the sensory/motor coactivation, forming a sequence of fMRI patterns spanning ~10 seconds (Fig. 3A). In addition, the EEG alpha power, HR, and RV all showed strong modulations across the cycle of this fMRI sequence (Fig. 3B). More importantly, the rsfMRI correlations with EEG and physiological signals are largely diminished after regressing out this sequence from rsfMRI signals (Fig. 3C-E).
Discussion
Here we found that rsfMRI signals showed similar correlations with EEG alpha power and physiological signals, which are featured by distinct network patterns at different time lags. A similar sequence of fMRI changes led by the salience network modulation exists in rsfMRI signals, and removing this sequence significantly diminished the rsfMRI-EEG and rsfMRI-physiology correlations. Altogether, these findings suggested that the widely observed rsfMRI correlations with various neural and physiological signals may result from a specific sequence of brain dynamics and associated physiological modulations. Moreover, the changes in salience network, with taking into consideration the hemodynamic delays, lead the entire process.Conclusion
The rsfMRI correlations with the EEG alpha power and physiological signals originate from a sequence of brain dynamics that is led by changes in the salience network.Acknowledgements
This research was supported by the National Institutes of Health (NIH) Pathway to Independence Award (K99/R00) 5R00NS092996-03, the NIH Brain Initiative award (1RF1MH123247-01), and the NIH R01 award (1R01NS113889-01A1).References
1. Birn, R. M., Murphy, K., Handwerker, D. A. & Bandettini, P. A. fMRI in the presence of task-correlated breathing variations. Neuroimage47, 1092–1104 (2009).
2. Shmueli, K. et al.Low-frequency fluctuations in the cardiac rate as a source of variance in the resting-state fMRI BOLD signal. Neuroimage38, 306–320 (2007).
3. Goldman, R. I., Stern, J. M., Engel, J. & Cohen, M. S. Simultaneous EEG and fMRI of the alpha rhythm. Neuroreport13, 2487–2492 (2002).
4. Özbay, P. S. et al.Contribution of systemic vascular effects to fMRI activity in white matter. Neuroimage176, 541–549 (2018).
5. Yuan, H., Zotev, V., Phillips, R. & Bodurka, J. Correlated slow fluctuations in respiration, EEG, and BOLD fMRI. Neuroimage79, 81–93 (2013).
6. Liu, X. et al.Subcortical evidence for a contribution of arousal to fMRI studies of brain activity. Nat. Commun.9, 1–10 (2018).
7. Feige, B. et al.Cortical and subcortical correlates of electroencephalographic alpha rhythm modulation. J. Neurophysiol.93, 2864–2872 (2005).
8. Tagliazucchi, E., Balenzuela, P., Fraiman, D. & Chialvo, D. R. Criticality in large-scale brain fmri dynamics unveiled by a novel point process analysis. Front. Physiol.3 FEB, 1–12 (2012).
9. Buxton, R. B., Uludaǧ, K., Dubowitz, D. J. & Liu, T. T. Modeling the hemodynamic response to brain activation. Neuroimage23, 220–233 (2004).
Figures