0570
Functional connectome of autonomic, limbic, nociceptive, and sensory brainstem nuclei using 7 Tesla resting-state fMRI in living humans1Life Sciences Institute, Sant'Anna School of Advanced Studies, Pisa, Italy, 2Brainstem Imaging Laboratory, Department of Radiology, Athinoula A. Martinos Center for Biomedical Imaging, Massachusetts General Hospital and Harvard Medical School, Boston, MA, United States, 3Dipartimento di Ingegneria dell’Informazione, University of Pisa, Pisa, Italy, 4Fondazione Toscana Gabriele Monasterio, Pisa, Italy, 5Department of Psychiatry and Psychology, Mayo Clinic, Rochester, MN, United States, 6Department of Otorhinolaryngology – Head and Neck Surgery, Mayo Clinic, Rochester, MN, United States, 7Department of Biomedical and Dental Sciences and Morphofunctional Imaging, University of Messina, Messina, Italy, 8Laboratory of Neuromotor Physiology, IRCCS Santa Lucia Foundation, Roma, Italy
Synopsis
With the goal of bridging the gap between cortical and subcortical (e.g. brainstem) functional connectomes and of defining a baseline for clinical studies, we computed the resting-state functional connectivity maps of 15 brainstem nuclei involved in central autonomic, limbic, nociceptive and sensory functions. We used images acquired with 7 Tesla MRI on a group of 20 healthy subjects and a recently generated probabilistic atlas of brainstem nuclei. We obtained highly significant and stable links with a good overlap with the literature. Our results also provide favorable results on the translatability of our brainstem connectome approach to conventional 3 Tesla data-sets.
Introduction
Investigation of the in-vivo functional diagrams (‘connectome’) of cortical regions in humans helps unravelling alterations involved in several brain pathologies1–4. The main processing units of autonomic, limbic, nociceptive and sensory functions are located in tiny deep brainstem nuclei5,6. Nevertheless, the functional connectome of brainstem nuclei is currently understudied due to the difficulty of localizing these small nuclei in-vivo and the need of adequate sensitivity, spatial resolution and physiological noise reduction to observe functional responses from these regions7.Purpose
We exploited 7 Tesla fMRI and a recently-generated brainstem probabilistic atlas8 to map the resting-state functional connectome of 15 brainstem nuclei involved in autonomic, limbic, nociceptive, and sensory function. We inspected the feasibility/limitations of mapping a similar brainstem connectome using conventional 3 Tesla data.Methods
Population: 20 healthy volunteers (10m/10f; age 29.5±1.1years, under IRB approval).7 Tesla MRI: Three resting-state (eyes-closed) fMRI runs: gradient-echo EPI, isotropic voxel-size/matrix-size/GRAPPA factor/nominal echo-spacing/bandwidth/N. slices/slice orientation/slice-acquisition order/echo-time (TE)/repetition-time (TR)/flip angle (FA)/simultaneous-multi-slice factor/N. repetitions/phase-encoding direction/acquisition-time per-run=1.1 mm/180×240/3/0.82ms/“1488Hz/Px”/123/sagittal/interleaved/32ms/2.5s/75°/3/210/anterior-posterior/10’07”. Fieldmap: isotropic voxel-size/matrix-size/bandwidth/N. slices/slice orientation/slice-acquisition order/TE1/TE2/TR/FA/simultaneous-multi-slice factor/phase-encoding direction=2.0mm/116x132/”1515Hz/Px”/80/sagittal/interleaved/3.00ms/4.02ms/570.0ms/36°/3/anterior-posterior.
3 Tesla MRI: T1-weighted MEMPRAGE image: isotropic voxel-size/TR/TEs/inversion-time/FA/FOV/bandwidth/GRAPPA-factor/slice orientation/slice-acquisition order/acquisition time=1mm/2.53s/1.69,3.5,5.3,7.2ms/1.5s/7°/256×256×176mm3/“650Hz/pixel”/3/sagittal/anterior-posterior/4′28”. One resting-state fMRI run: isotropic voxel-size/matrix-size/GRAPPA factor/nominal echo-spacing/readout bandwidth/N. slices/slice orientation/slice-acquisition order/TE/TR/FA/GRAPPA factor/N. repetitions/phase-encoding direction/acquisition-time=2.5mm/100×215/2/0.5ms/“2420Hz/Px”/64/transversal/interleaved/30ms/3.5s/85°/2/150/anterior-posterior/9’06”. Fieldmap: isotropic voxel-size/FOV/bandwidth/N. slices/slice orientation/slice-acquisition order/TE1/TE2/TR/FA/simultaneous-multi-slice factor/phase-encoding direction=2.5mm/215x215/“300Hz/Px”/128/sagittal/interleaved/4.92ms/4.02ms/849.0ms/85°/2’19’’/anterior-posterior.
Preprocessing: We adopted the same preprocessing for 7 Tesla and 3 Tesla fMRI data.
MEMPRAGEs: We computed the root-mean-square MEMPRAGE across echo-times, rotated it to standard “RPI” orientation, performed bias-field correction (SPM) and cropping. Then, we computed (ANTs9) a group-average MEMPRAGE template as an intermediate step to coregister single-subject MEMPRAGEs to Montreal-Neurological-Institute (MNI) space. The pre-processed T1-weighted images were parcellated using Freesurfer to generate cortical and subcortical targets.
fMRIs: To remove physiological noise we applied RETROICOR10 to fMRI data. Images were slice-timing corrected, reoriented to “RPI” orientation, and cropped. Then, we computed the transformations to correct for geometric distortions (using the fieldmap) and for rigid-body motion. The bias-field-corrected time-averaged fMRI of the first run was used to compute a linear affine transformation and a nonlinear warp for coregistration to the MEMPRAGE. After concatenating and applying transformations relative to distortion-, motion-correction and coregistration to the MEMPRAGE, we regressed out nuisance time-series due to motion, cardiac rate and respiratory-volume-per-unit-time fluctuations, as well as signal in the cerebro-spinal fluid neighboring the brainstem. We scaled the signal to percent signal change, removed the temporal mean, and performed band-pass filtering (cut-off 0.01-0.1 Hz). Finally, we concatenated the runs and applied the MEMPRAGE-to-MNI transformations.
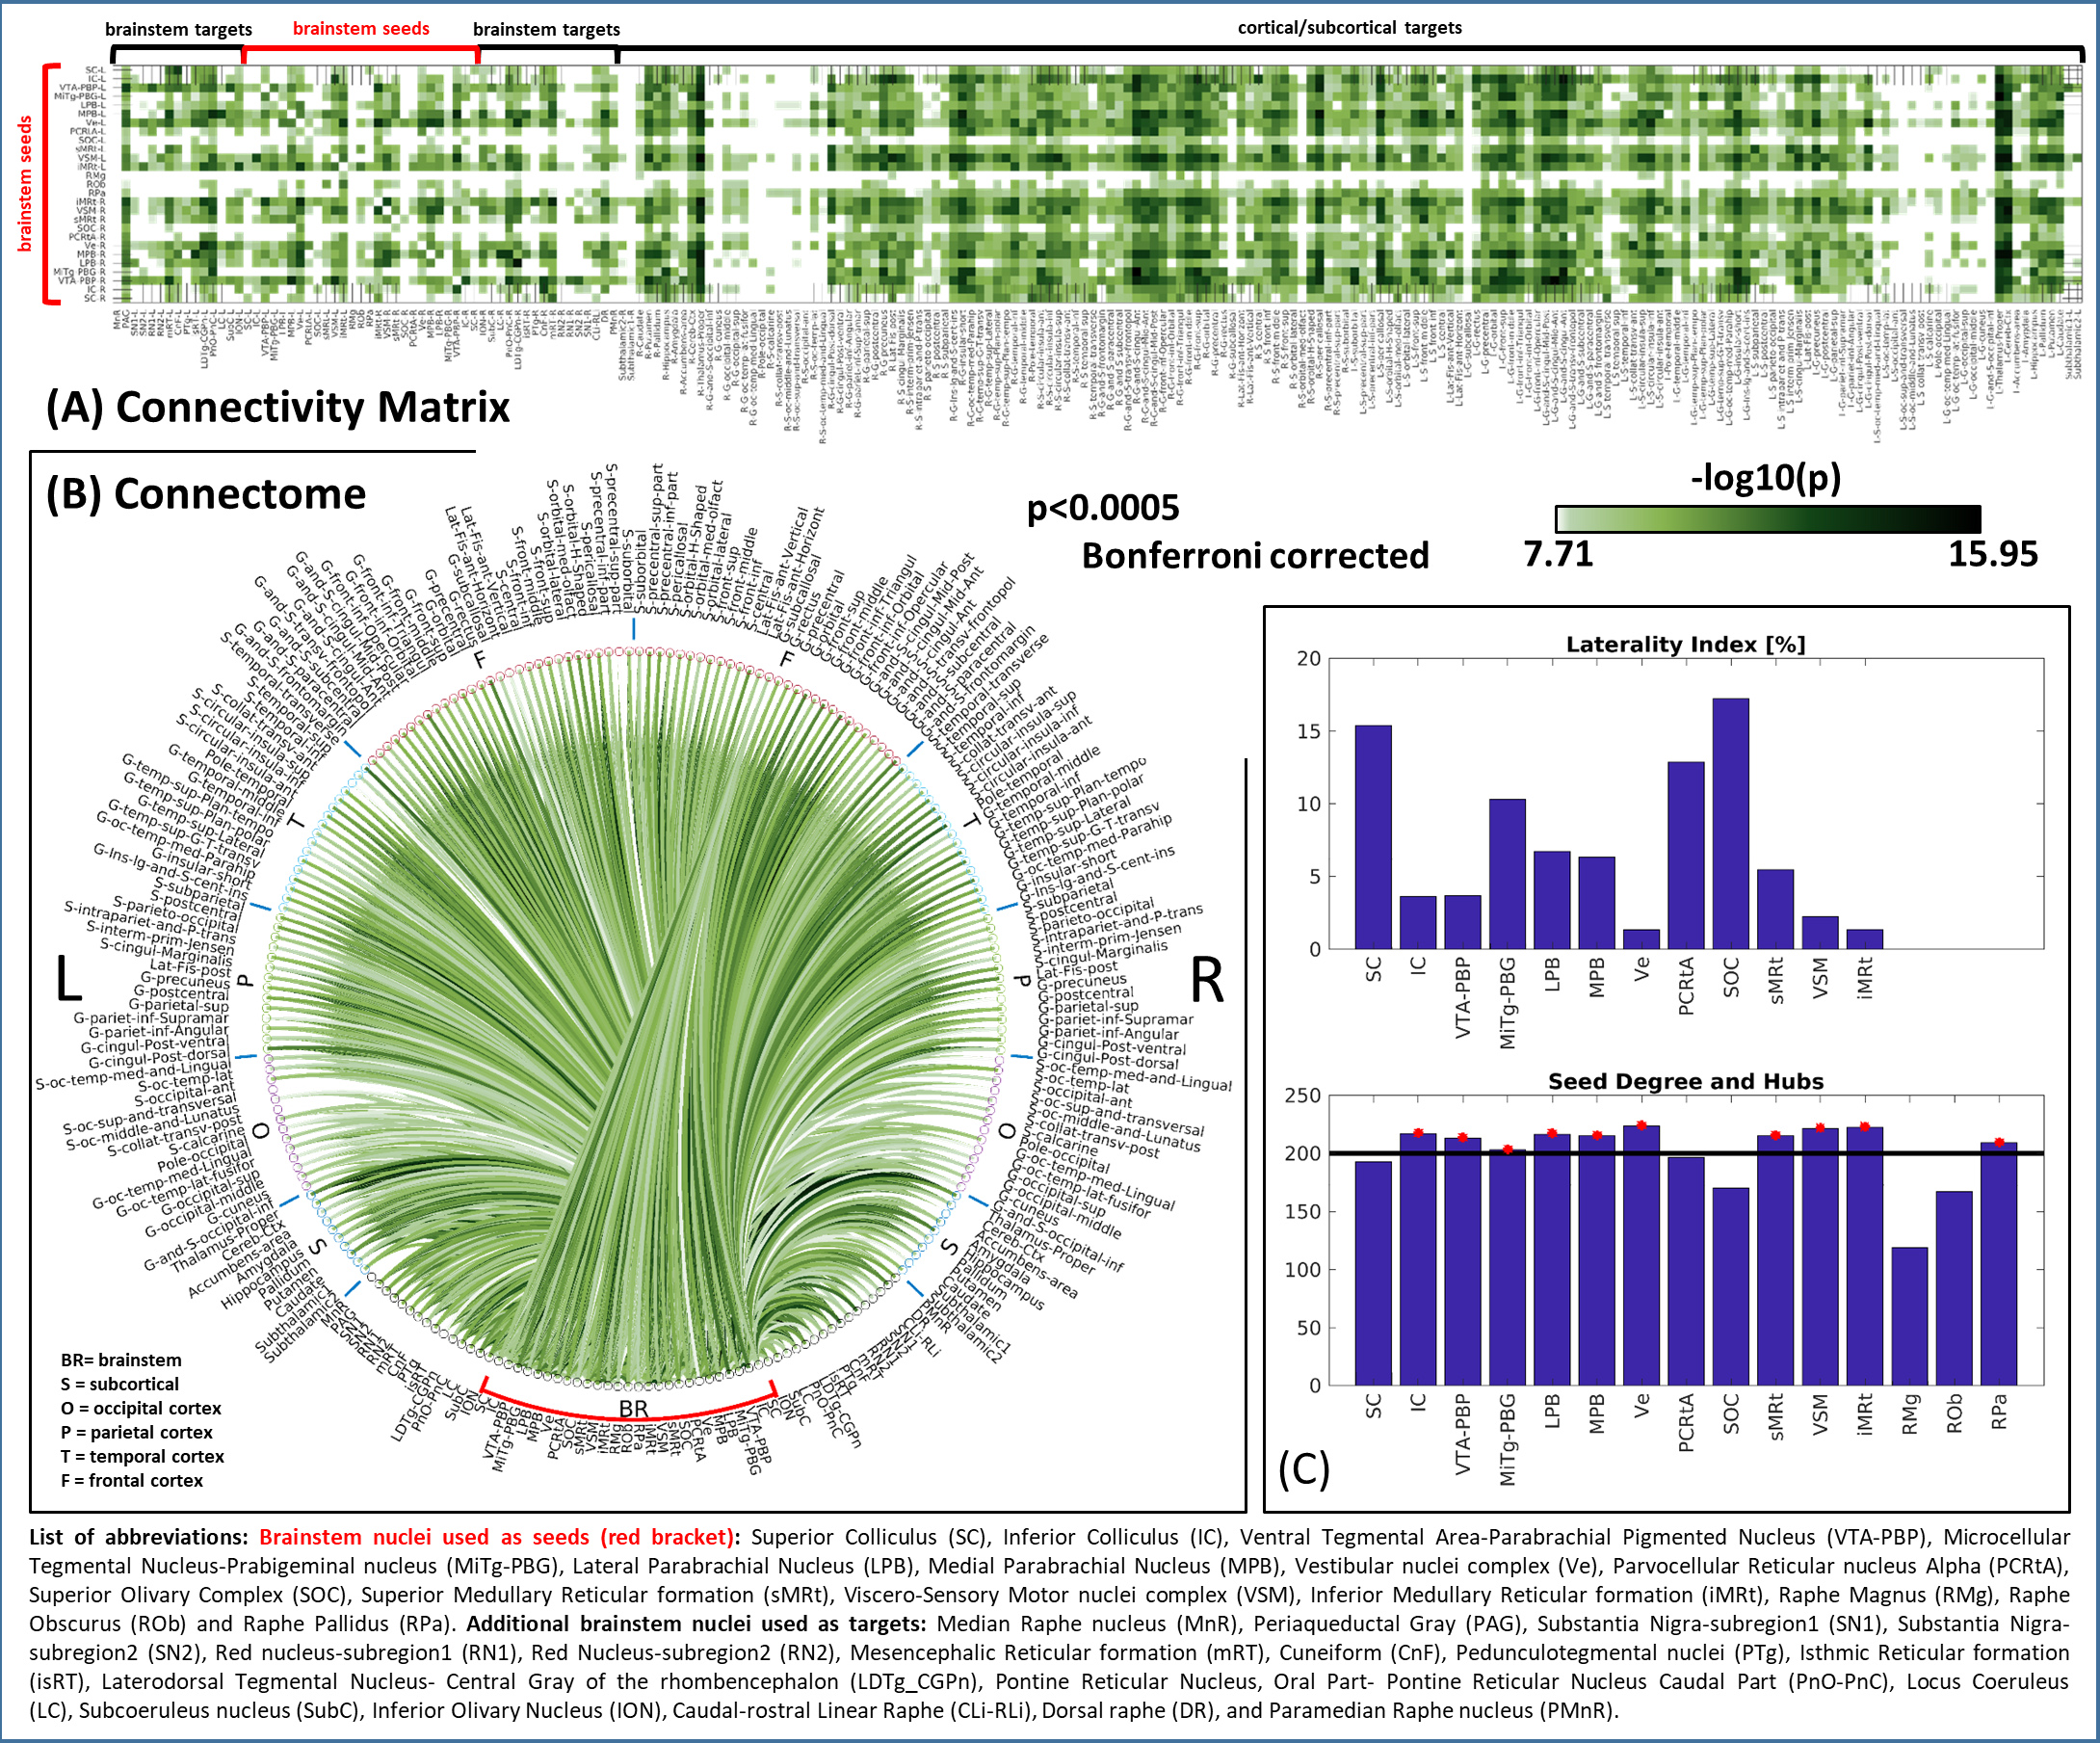
Seed and target regions: We used as seeds the probabilistic atlas of 15 brainstem nuclei8 (27 structures, counting 12 bilateral and 3 medial regions) thresholded at 35%. As targets we used a collection of 199 target cortical and subcortical masks (Freesurfer parcellations), as well as the seeds.
Region based connectivity analysis: At the subject level, the Pearson’s correlation coefficient was computed between average time-courses extracted from seeds and targets. At the group level, we performed a one-sample t-test on the Fisher-transformed correlation coefficients and defined ‘links’ as significant connections (p < 0.05 Bonferroni corrected) To describe the amount of symmetry for each pair of bilateral nuclei, a laterality index (0%=symmetry; 100%=asymmetry) was computed as the difference between binary links of left and right (mirrored) seeds divided by the number of active links. In addition, we computed the connectivity degree of each seed as the number of links (averaged across left and right nuclei for bilateral ones), and defined as ‘hubs’ seeds with a degree exceeding the mean degree across seeds.
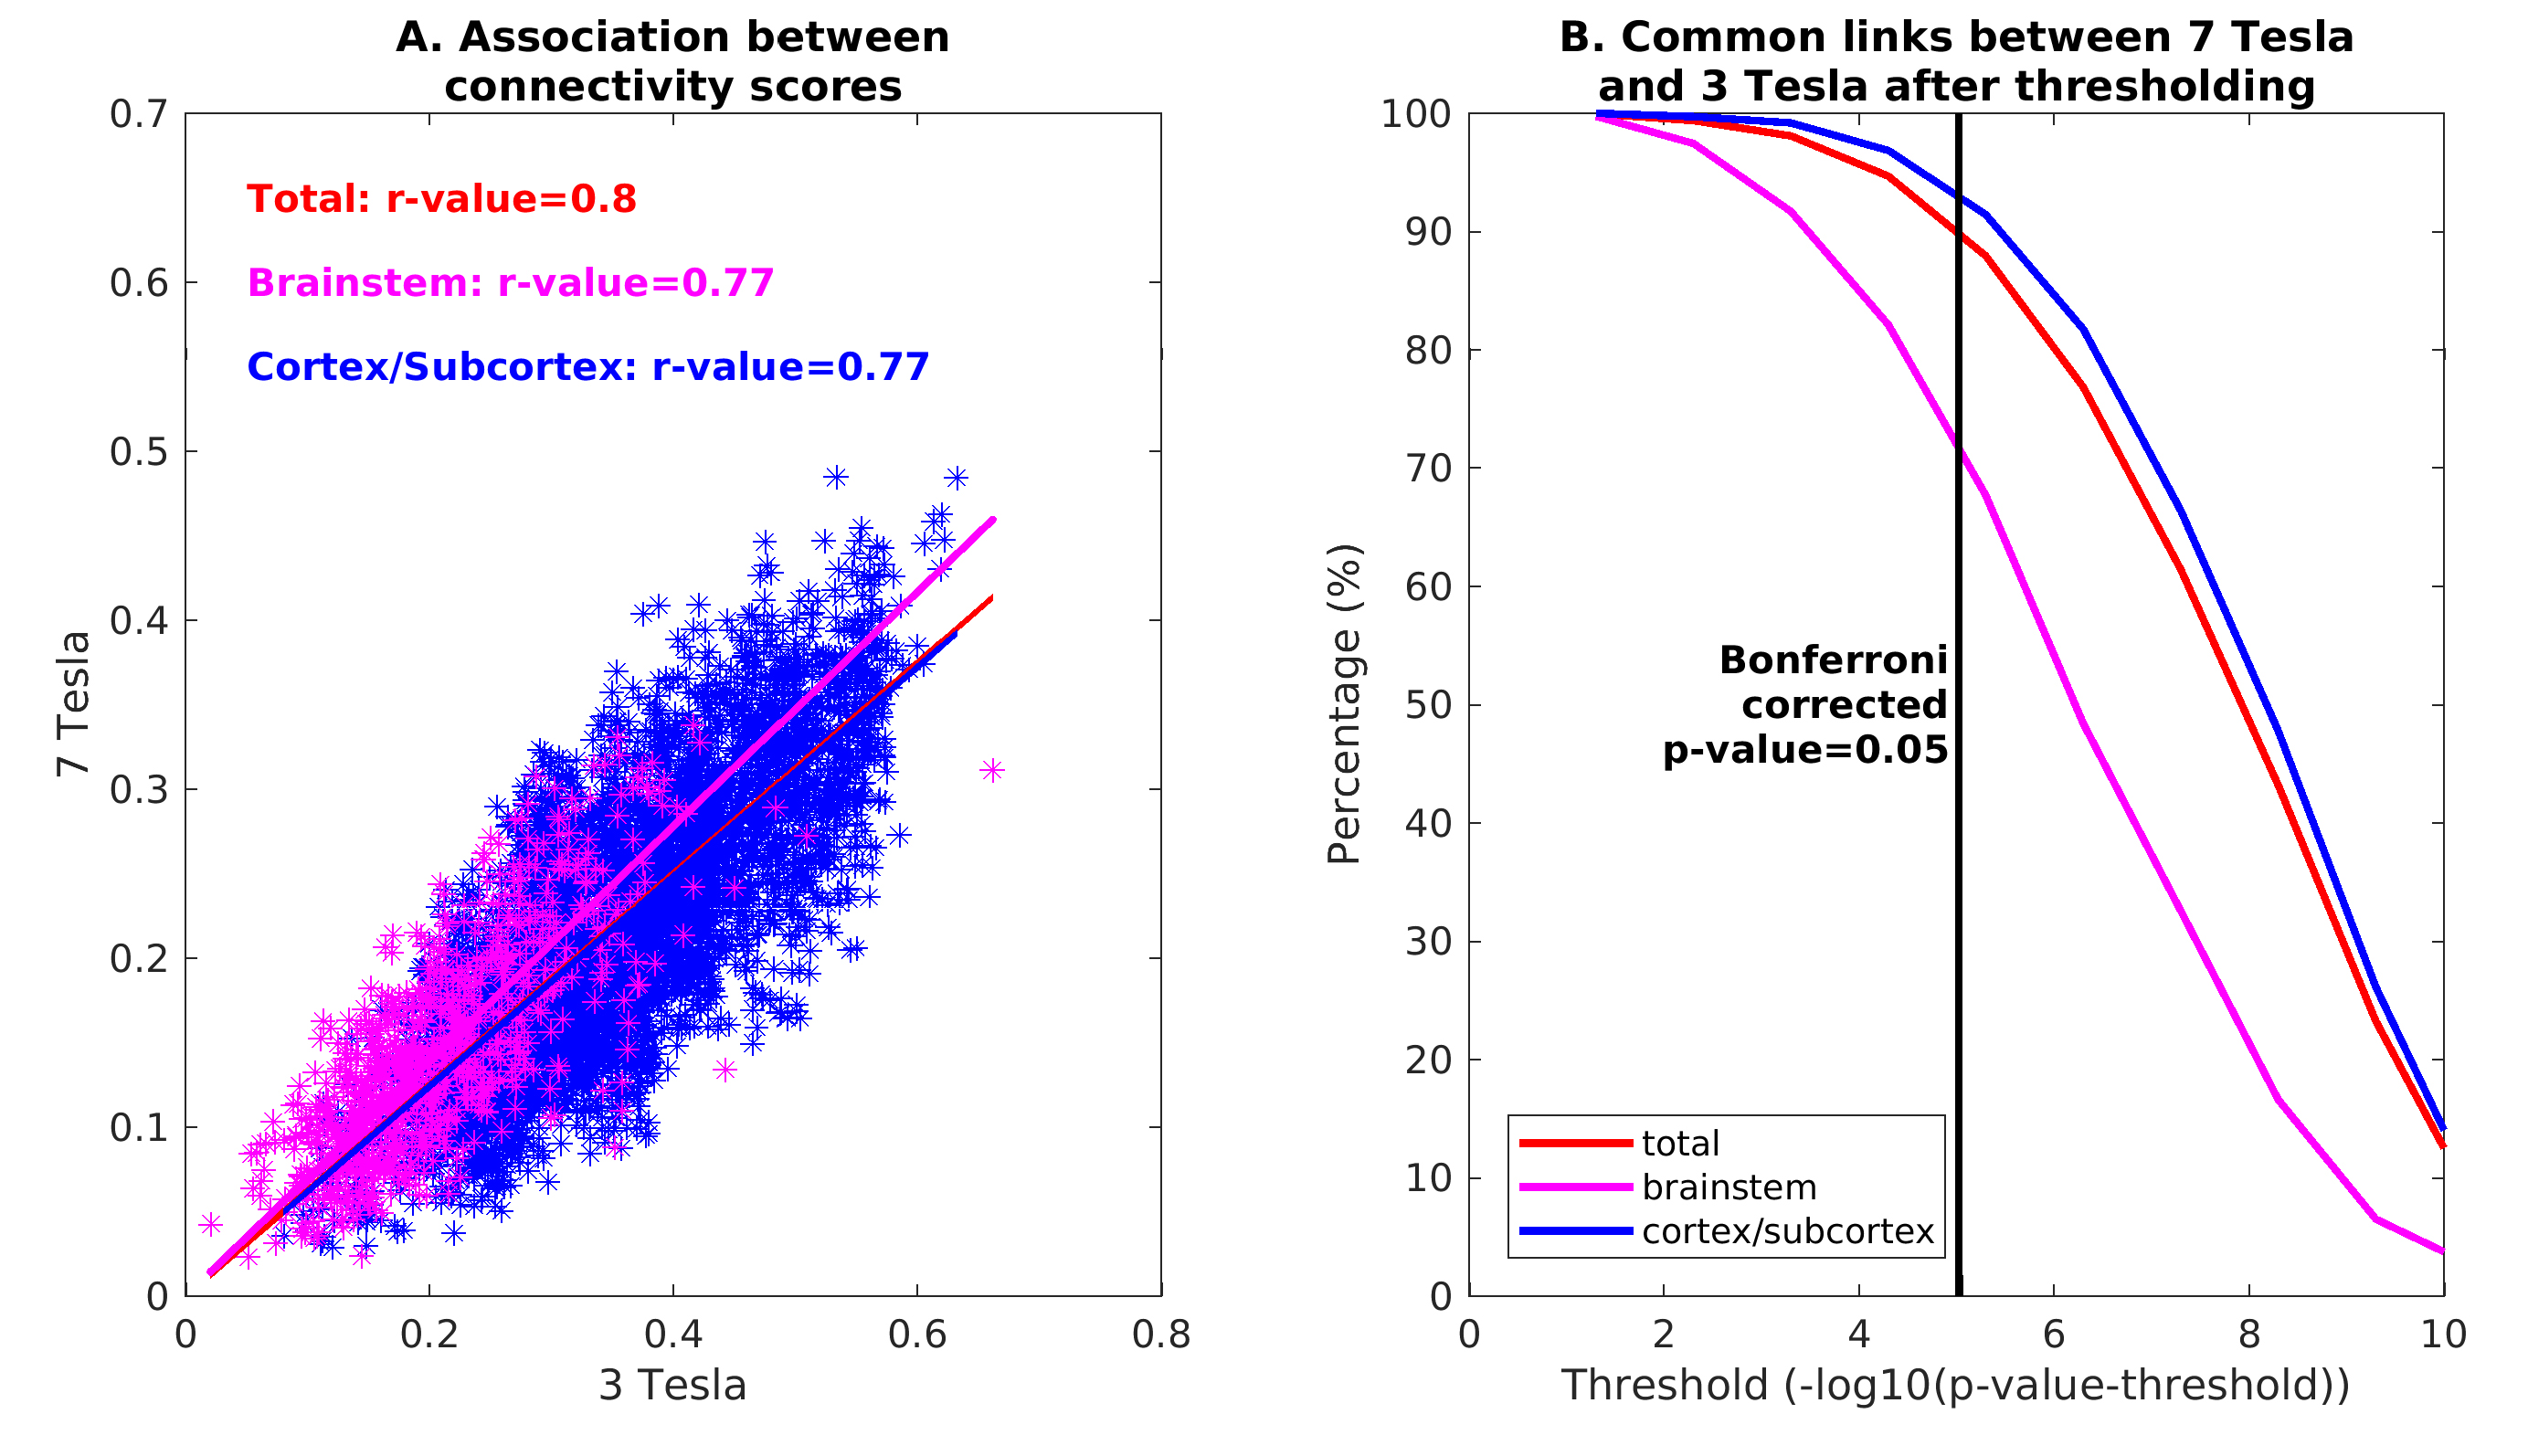
Comparison of 7 Tesla and 3 Tesla results: We measured the association of the correlation coefficients (mean across subjects) across scanners. We also counted the percentage of common links across scanners for different statistical thresholds.
Results
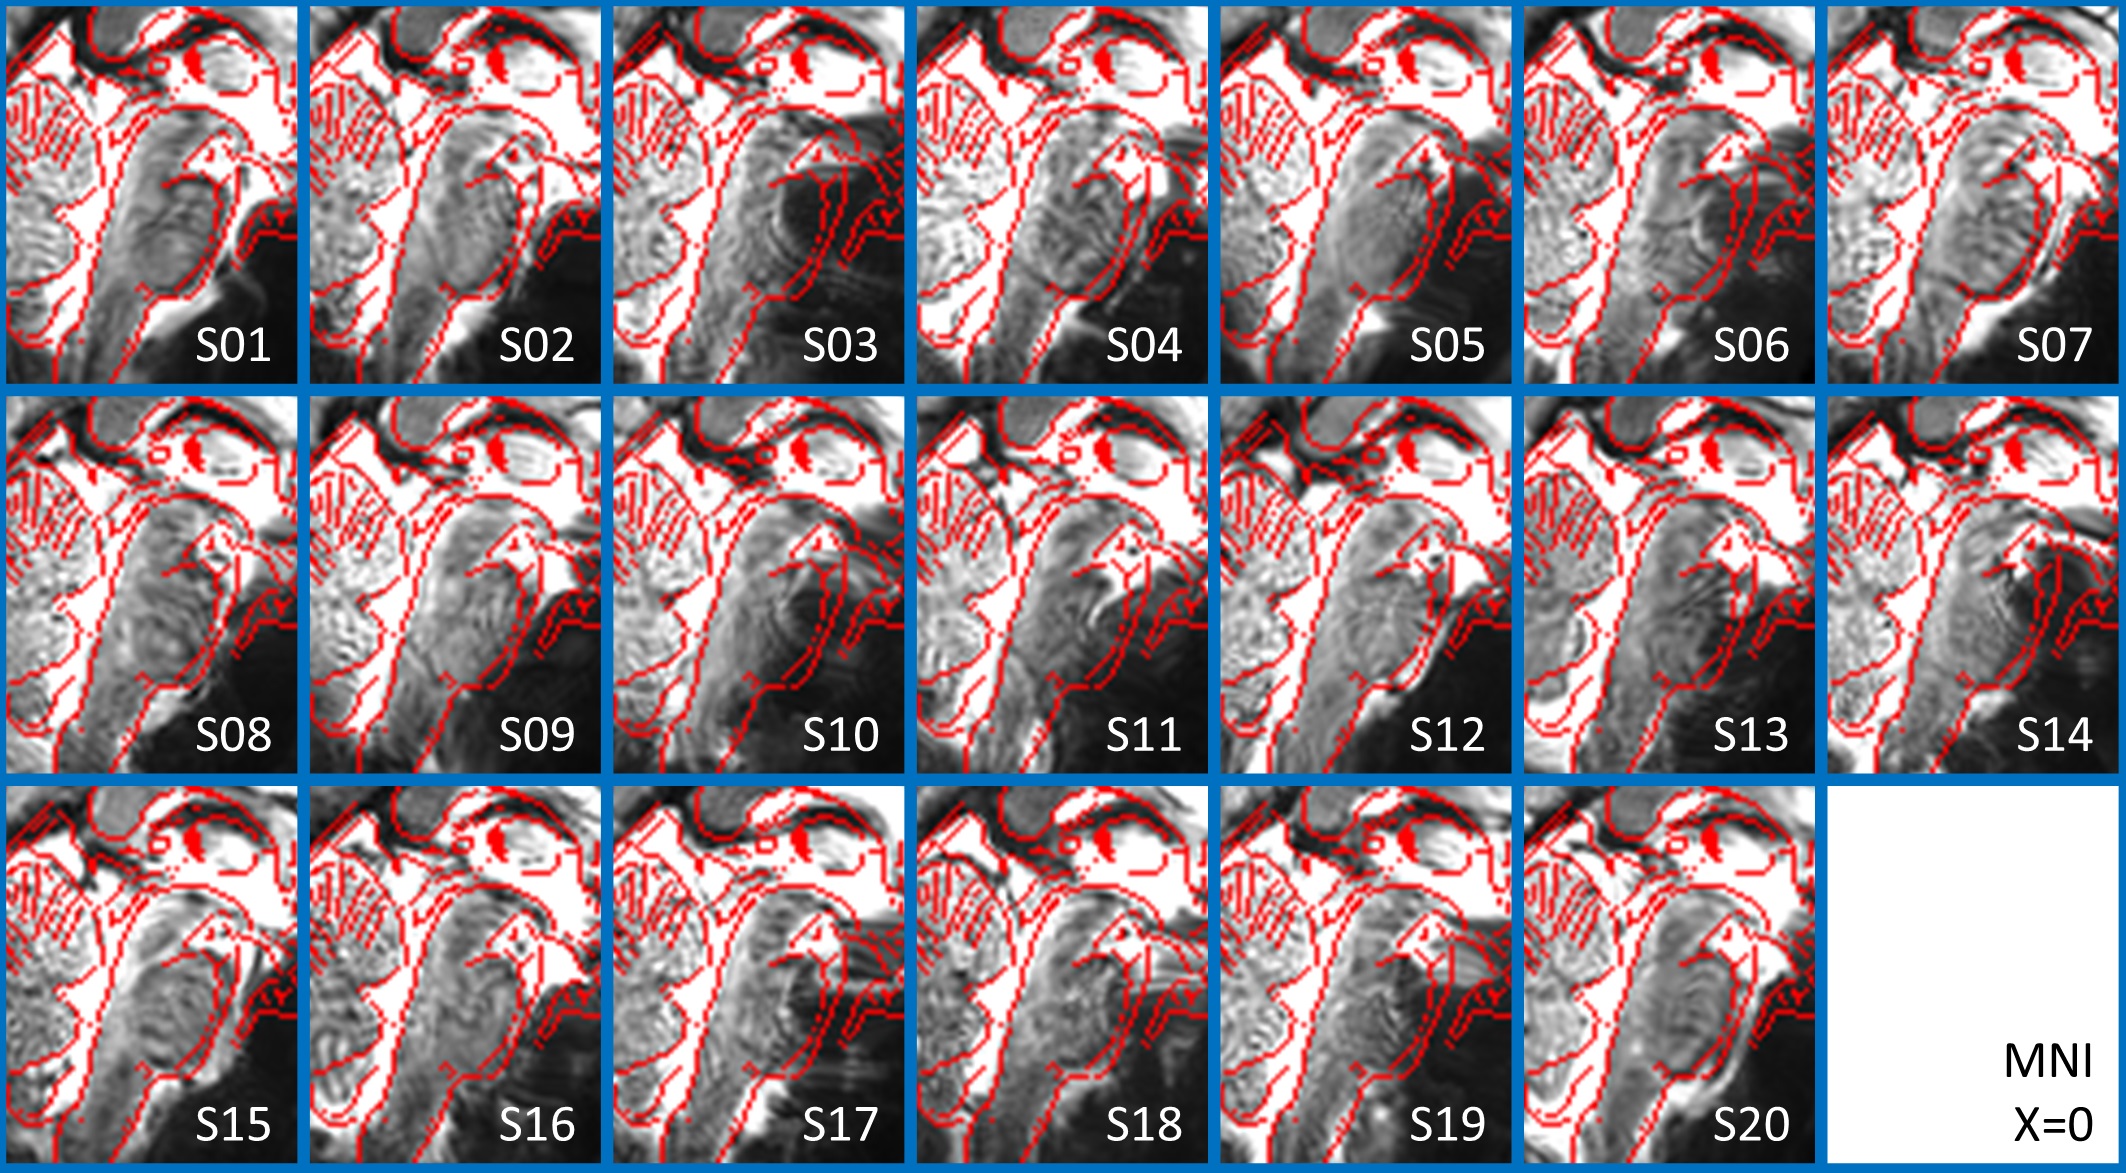
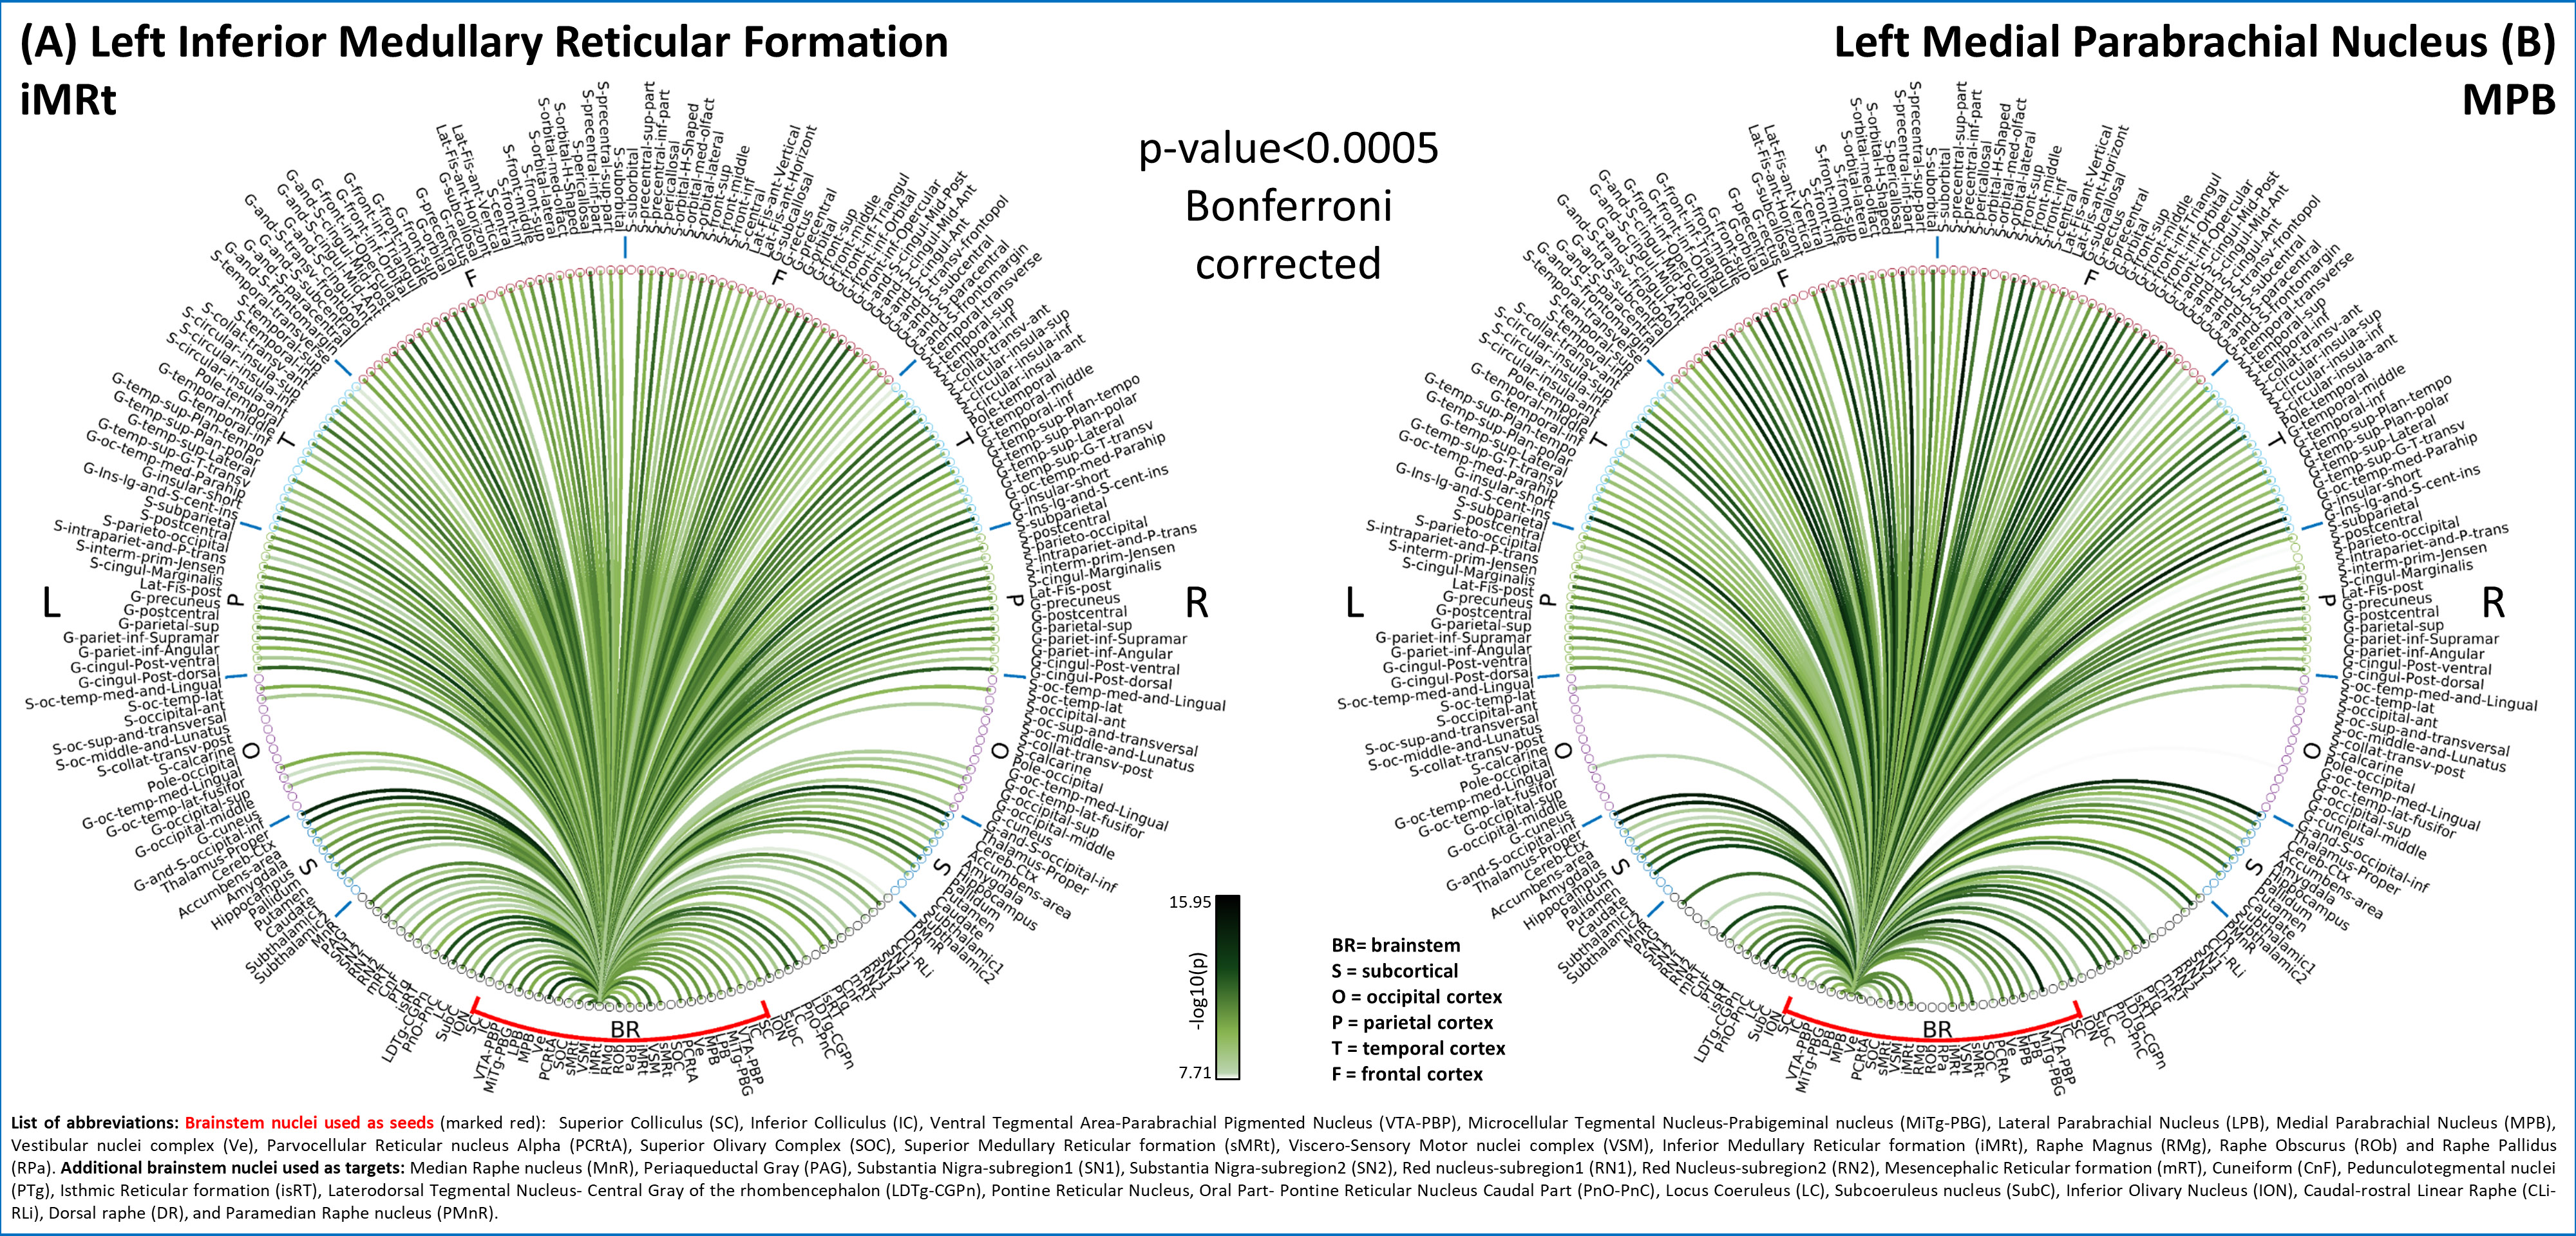
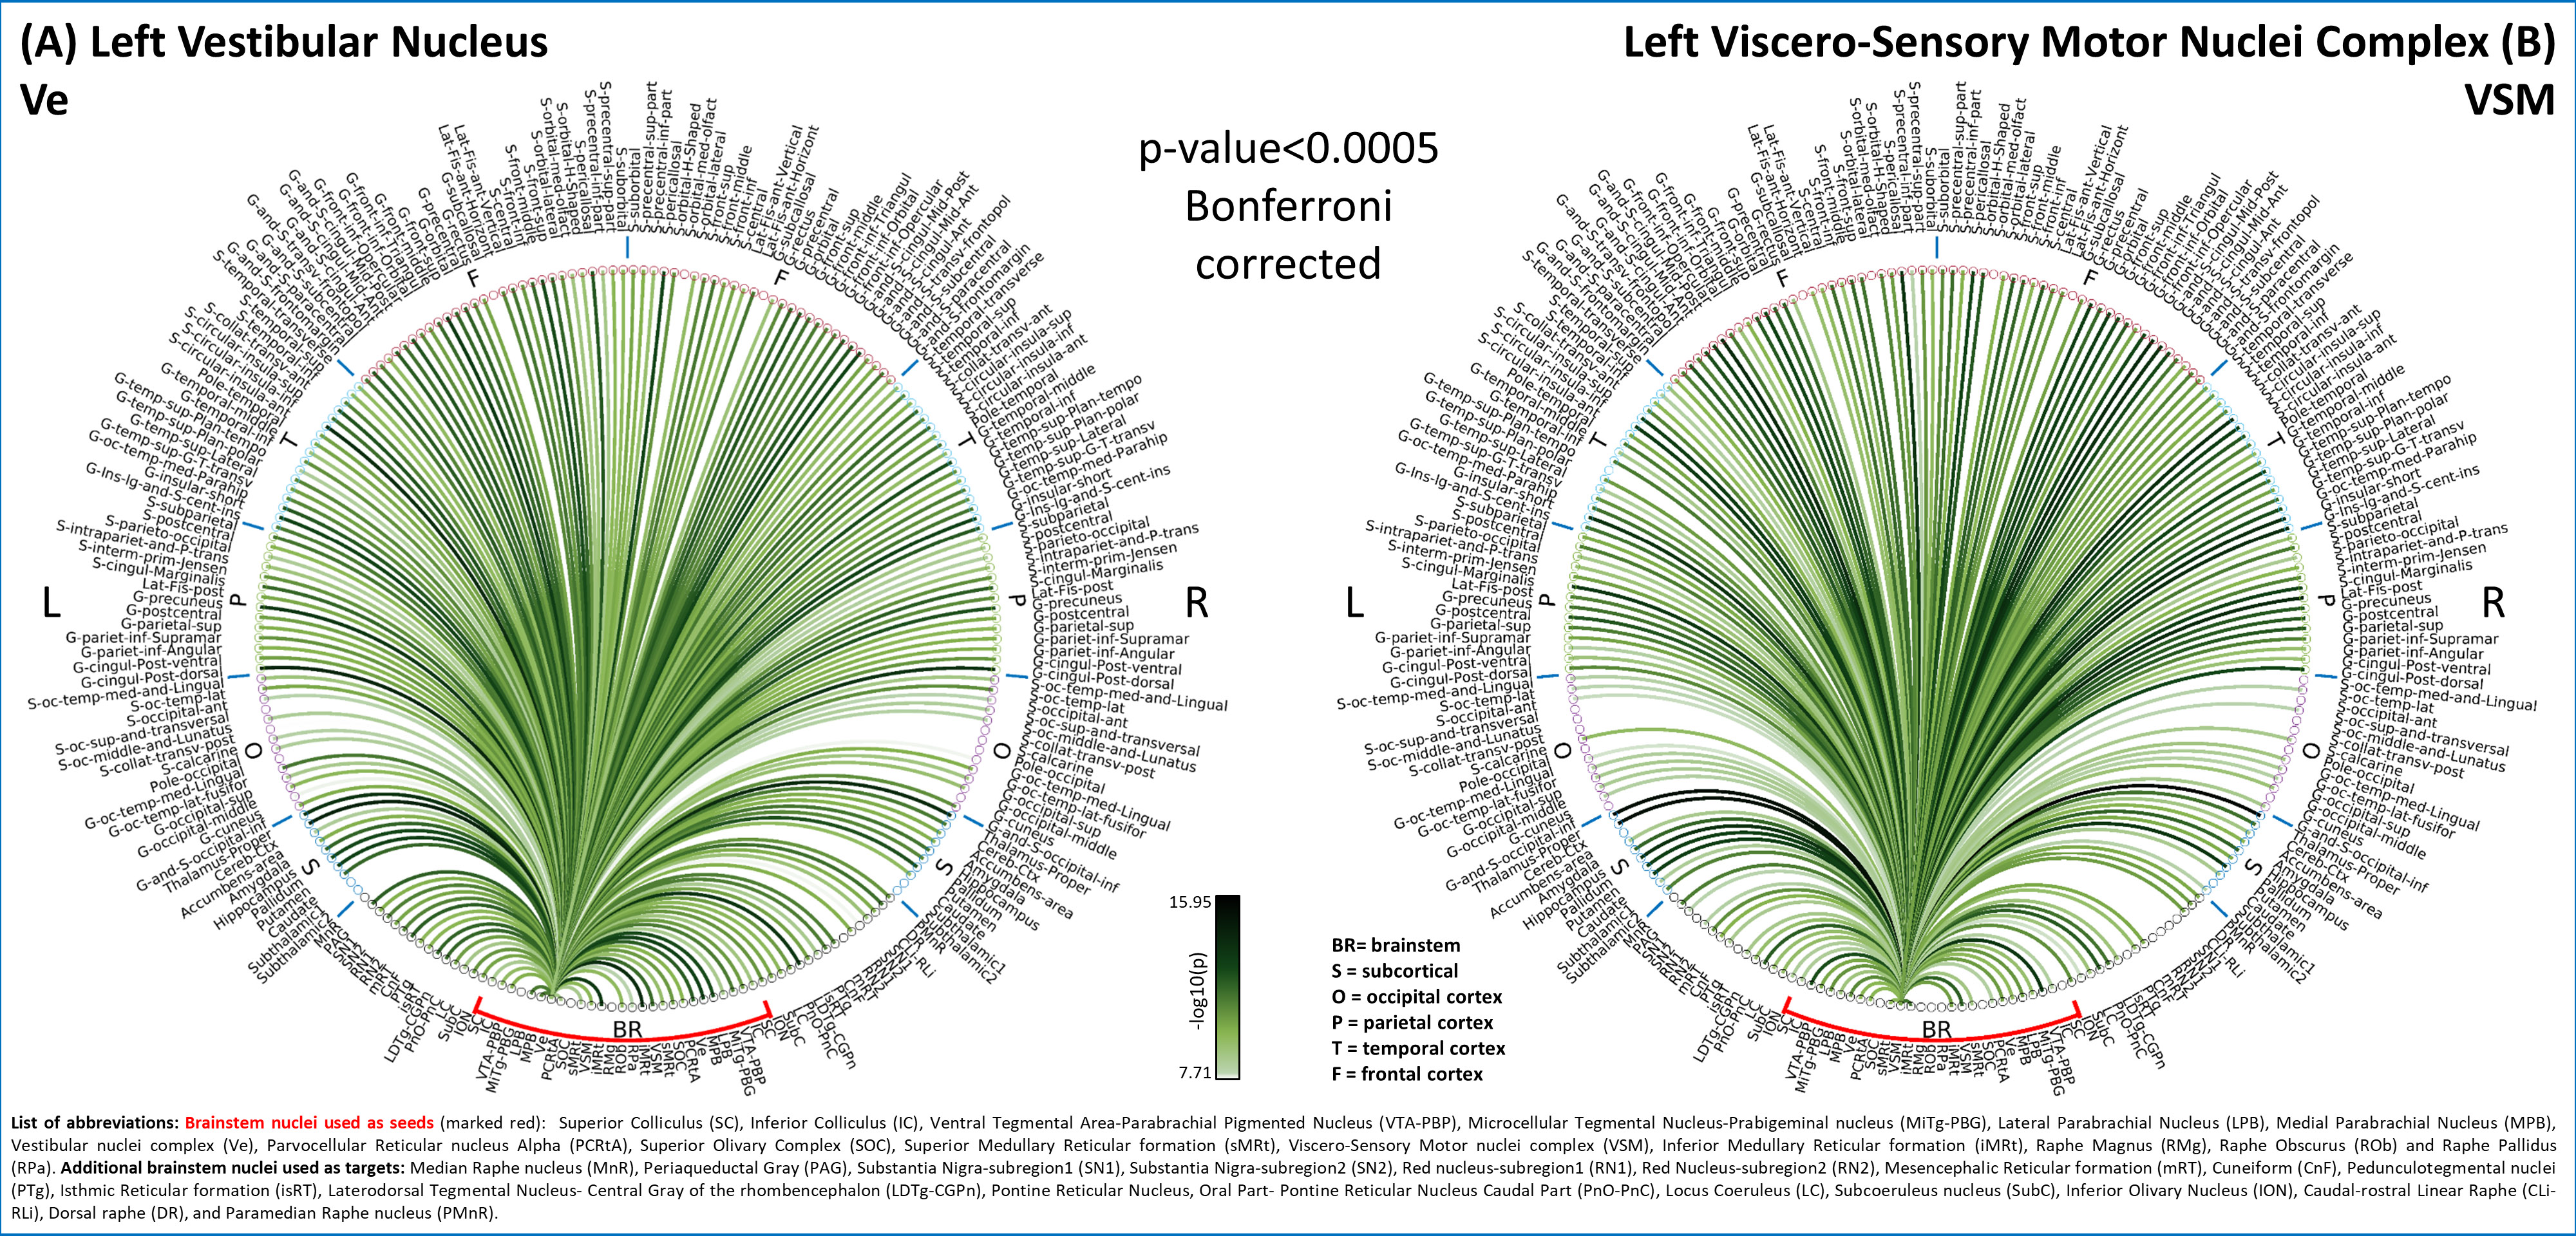
In Figure 1, we show the coregistration quality of fMRI data to MNI space. In Figure 2A-B we display the connectivity matrix and circular connectome of all the seeds. In Figure 2C, we show the seed laterality index (range: 1.3-17%), connectivity degree (range: 119-223.5) and network hubs. In Figure 3-4, we report the connectomes of four sample seeds. With regard to the results translatability at 3 Tesla, we found a correlation coefficient of 0.8 between 7 Tesla and 3 Tesla correlation values, and respectively 89.4%, 72% and 93% of common links (p<0.05 Bonferroni corrected) with all the targets, brainstem only targets and non-brainstem targets (Figure 5).Discussion
The brainstem connectome displayed highly significant connections both with nearby brainstem and subcortical nuclei, as well as distant cortical targets, in line with previous studies11. Left and right seeds displayed mirrored connectomes, indicating robustness of our results. The comparison between 7 Tesla and 3 Tesla results speaks favorably for the translatability of our connectomic approach; nevertheless, common connections decreased for more stringent thresholds indicating lower significance of 3 Tesla results, especially in the brainstem. Limitations of this study include the possible presence of residual physiological noise, and the polysynaptic measure of the Pearson-based correlation analysis, to be tackled in further investigation.Conclusion
We provided a wide and detailed functional connectome of 15 brainstem nuclei in living humans, displaying high significance and stability across subjects. This connectome might serve as a baseline for studies of pathological conditions involving autonomic, limbic, nociceptive and sensory functions.Acknowledgements
MGH-Claflin-Distinguished-Scholar; Harvard-Mind-Brain-Behavior-Faculty-Award; NIH-NIBIB-K01EB019474; NIH-NIDCD-R21-DC015888; NIH-NIA-R01AG063982; Italian Ministry of Health PE-2013-02355372.References
1. Wackerhagen C, Veer IM, Erk S, et al. Amygdala functional connectivity in major depression – disentangling markers of pathology, risk and resilience. Psychol Med. 2019;1-11.
2. Baker JT, Dillon DG, Patrick LM, et al. Functional connectomics of affective and psychotic pathology. Proc Natl Acad Sci. 2019;116(18):9050-9059.
3. Teipel S, Grothe MJ, Zhou J, et al. Measuring Cortical Connectivity in Alzheimer’s Disease as a Brain Neural Network Pathology: Toward Clinical Applications. J Int Neuropsychol Soc. 2016;22(2):138-163.
4. Gao L, Wu T. The study of brain functional connectivity in Parkinson’s disease. Transl Neurodegener. 2016;5(1):18.
5. Macefield VG, Henderson LA. Identification of the human sympathetic connectome involved in blood pressure regulation. Neuroimage. 2019;202:116119.
6. Heinricher MM, Ingram SL. The Brainstem and Nociceptive Modulation. In: The Senses: A Comprehensive Reference. Elsevier. 2008;593-626.
7. Beissner F. Functional MRI of the Brainstem: Common Problems and their Solutions. Clin Neuroradiol. 2015;25(S2):251-257.
8. Bianciardi M, Toschi N, Edlow BL, et al. Toward an In Vivo Neuroimaging Template of Human Brainstem Nuclei of the Ascending Arousal, Autonomic, and Motor Systems. Brain Connect. 2015;5(10):597-607.
9. Tustison NJ, Cook PA, Klein A, et al. Large-scale evaluation of ANTs and FreeSurfer cortical thickness measurements. Neuroimage. 2014;99:166-179.
10. Glover GH, Li TQ, Ress D. Image-based method for retrospective correction of physiological motion effects in fMRI: RETROICOR. Magn Reson Med. 2000;44(1):162-167.
11. Olszewski G, Baxter DW. Olszewski and Baxter’s Cytoarchitecture of the Human Brainstem. Büttner-Ennever JA, Horn AKE, eds.; 2014.
12. Courville J, Faraco-Cantin F, Marcon L. Projections from the reticular formation of the medulla, the spinal trigeminal and lateral reticular nuclei to the inferior olive. Neuroscience. 1983;9(1):129-139.
13. Yates BJ, Bolton PS, Macefield VG. Vestibulo-Sympathetic Responses. In: Comprehensive Physiology. John Wiley & Sons, Inc. 2014;851-887.
14. Nasse J, Terman D, Venugopal S, Hermann G, Rogers R, Travers JB. Local circuit input to the medullary reticular formation from the rostral nucleus of the solitary tract. Am J Physiol Integr Comp Physiol. 2008;295(5):R1391-R1408.
15. Sandkühler J, Gebhart GF. Relative contributions of the nucleus raphe magnus and adjacent medullary reticular formation to the inhibition by stimulation in the periaqueductal gray of a spinal nociceptive reflex in the pentobarbital-anesthetized rat. Brain Res. 1984;305(1):77-87.
16. Krout KE, Jansen AS, Loewy AD. Periaqueductal gray matter projection to the parabrachial nucleus in rat. J Comp Neurol. 1998;401(4):437-454.
17. Qiao Y, Zhang C, Li Z, Niu Z, Li J, Li J. Collateral Projections from the Lateral Parabrachial Nucleus to the Central Amygdaloid Nucleus and the Ventral Tegmental Area in the Rat. Anat Rec. 2019;302(7):1178-1186.
18. Frank SM, Greenlee MW. The parieto-insular vestibular cortex in humans: more than a single area? J Neurophysiol. 2018;120(3):1438-1450.
19. Horn AKE. Neuroanatomy of Central Vestibular Connections. In: The Senses: A Comprehensive Reference. Elsevier. 2020;21-37.
20. Hitier M, Besnard S, Smith PF. Vestibular pathways involved in cognition. Front Integr Neurosci. 2014;8:59.
21. Balaban CD, Yates BJ. Vestibuloautonomic Interactions: A Teleologic Perspective. In: The Vestibular System. Springer-Verlag. 2004; 19:286-342.
Figures