0569
Whole-brain vascular connectome: a new approach to investigate the functional brain networks using large-scale angioarchitecture
Michael Bernier1,2, Jingyuan E Chen1,2, Olivia Viessmann1,2, Nina E Fultz1,3, Maxime Chamberland4, Rebecca K Leaf5, Lawrence L Wald1,2,6, and Jonathan R Polimeni1,2,6
1Department of Radiology, A. A. Martinos Center for Biomedical Imaging, Massachusetts General Hospital, Boston, MA, United States, 2Radiology, Harvard Medical School, Boston, MA, United States, 3Department of Engineering, University of Boston, Boston, MA, United States, 4Cardiff University Brain Research Imaging Centre (CUBRIC), Cardiff, United Kingdom, 5Division of Hematology, Massachusetts General Hospital, Boston, MA, United States, 6Division of Health Sciences and Technology, Massachusetts Institute of Technology, Boston, MA, United States
1Department of Radiology, A. A. Martinos Center for Biomedical Imaging, Massachusetts General Hospital, Boston, MA, United States, 2Radiology, Harvard Medical School, Boston, MA, United States, 3Department of Engineering, University of Boston, Boston, MA, United States, 4Cardiff University Brain Research Imaging Centre (CUBRIC), Cardiff, United Kingdom, 5Division of Hematology, Massachusetts General Hospital, Boston, MA, United States, 6Division of Health Sciences and Technology, Massachusetts Institute of Technology, Boston, MA, United States
Synopsis
Blood vessels influence nearby fMRI signals, and patterns of vascular anatomy partly shape the patterns of the BOLD response. To better understand the relationship between large-scale brain networks and vascular anatomy, here we developed an approach for estimating the topology of the vascular network and quantifying how vessel pathways connect between brain regions. We used a blood-pool contrast agent to enhance the vessels, and developed a new method for vessel tracking similar to what is conventionally used to estimate structural connectivity in diffusion MRI. We demonstrate an application this framework by estimating vascular connectivity matrices for the human brain.
Introduction
It is well known that blood vessels influence proximal fMRI signals, and that vascular geometry and topology—in part—shape the patterns of the BOLD response [1], [2]. For example, previous studies have shown that estimates of resting-state connectivity are strongly affected by large cerebral blood vessel [3]. While there is extensive evidence that the large-scale networks observed in fMRI reflect large-scale patterns of neural activity [4]–[6], the extent to which these patterns may mirror the topology of brain angioarchitecture is unknown, requiring a more detailed knowledge of vascular anatomy. Consequently, we sought to characterize the human brain vasculature by estimating the topology and connection density of the vascular network. This was motivated by the observations that hemodynamic signals appear to track the vascular anatomy [7], and therefore some components of observed functional connectivity patterns may be mediated by distant vascular pathways. Investigating this first requires a robust vessel detection and segmentation, which we addressed by employing the blood-pool contrast agent Ferumoxytol [8] and established the tools to segment mesoscale vasculature across the entire brain [9]. Here, we take the next step of subsequently investigate the vessels pathways by developing a new method for vessel tracking, akin to established methods for structural connectivity estimates with diffusion-weighted MR data. While previous studies have employed intensity-based tensor methods for tracking vessels [10], [11], our new approach was developed to handle the smaller vessels detected and to address spurious small disconnections. We finally applied this framework to estimate vascular connectivity matrices for the human brain.Methods
Four anemic but neurologically healthy (44±7 y.o., 3F) volunteers participated after providing written informed consent. Each volunteer was scanned at 3T (TimTrio, Siemens Healthineers), after injection with 510mg of Ferumoxytol. Each session consisted of an anatomical T1-weighted MP2RAGE acquisition (TR/TI1/TI2/TE=5000/700/2500/2.5ms, 1mm³) and a 15-minute whole-head 3D T2* multi-echo GRE acquisition (192×192×96mm FOV, 7 echoes, TR=2000s, TEs=4.88/9.76/14.64/19.52/24.40/29.28/34.16ms, 0.6mm³, flip angle=17°) used for vascular segmentation. The T1 were processed using FreeSurfer, and non-linearly registered to the MNI space to allow projection of the RecoBundle white-matter bundle atlas [12], [13]. Vascular segmentation was performed on the first echoe using an updated Braincharter segmentation tool [14] as done previously [9] to obtain a “vesselness score” defining the vessel tree, from which the centerline was computed by morphology.We developed a novel vascular tractography analysis by emulating a multi-shell diffusion MRI acquisition (two shells, 30 directions each) by generating a filterbank of 30 three-dimensional spatial kernels of two different cubic grid sizes (7³ and 13³), each of which consisted of an oriented filter of a particular antialiased and normalized directional vector. Thus, after convolution of the inverted "vesselness score" image (acting as b=0) with each of the 60 filters, a darker signal indicated a stronger diffusion in its corresponding direction. We then used DSI Studio [15], [16] to perform a using generalized q-sampling imaging (diffusion sampling length ratio of 1.25) [16]. A deterministic fiber tracking algorithm [16] was used, using the vessel-tree centerline as seed region, until 200,000 tracks were generated. The anisotropy and angular threshold (15°–90°) were allowed to vary randomly, and the step size was set to 5 mm to bridge discontinuities in the vascular segmentation. The geometry of the resulting fiber trajectories was smoothed by averaging the propagation direction with 80% of the previous direction. Tracks with a length shorter than 200 mm or longer than 1000 mm were discarded. Finally, the tracts were used to estimate a connectivity matrix between brain regions as defined by the WM atlas RecoBundle [12], [13] and the Freesurfer Destrieux2009 GM atlas.
Results
Figure 1 illustrates the segmented vessels in 3D, as well as an example set of oriented filters used to convert the vesselness images into images mimicking diffusion-weighted images. Figure 2 illustrates the reconstructed tracts for one subject as well as its correspondence with the vascular segmentation. Figure 3 shows the potential of the method by depicting two connectome matrices computed using Freesurfer’s gray-matter parcellation and RecoBundle’s white-matter bundles, respectively.Discussion and Conclusion
Here we have quantified the large-scale geometry of the human brain vasculature by treating the vessels as paths and mapping their connectivity between brain regions. It is evident that the vascular geometry varies across individuals [17], but the extent of this across-subject variability is still undetermined; hence it is possible that the vascular connectivity is more consistent across individuals, which will be addressed with further work. Moreover, common assumptions that are valid in diffusion tractography are not valid for our vascular data, such as the existence of branching and sharp turns in the vasculature, and thus our model based on spherical harmonics has a greater potential of capturing the complex vascular structures compared to tensor-based models [18].Our vascular connectivity estimate approach could help to address several open questions, such as quantifying the resemblance between white-matter vasculature and fiber bundles we previously uncovered [9]. Also, our ongoing work is seeking to compare vascular connectivity with functional connectivity to characterize their interrelationship; while the vasculature might impose structured patterns of physiological noise in the fMRI data, it has been recently suggested that the large-scale angioarchitecture might reflect meaningful patterns in brain organization[19], [20].
Acknowledgements
This work was supported in part by the NIH NIBIB (grants P41-EB030006 and R01-EB019437), NINDS (grant R21-NS106706), by the BRAIN Initiative (NIH NIMH grant R01-MH111419), and by the MGH/HST Athinoula A. Martinos Center for Biomedical Imaging; and was made possible by the resources provided by NIH Shared Instrumentation Grants S10-RR023043 and S10-RR019371. We thank our colleagues at Siemens Heathineers for use of the Works-In-Progress package #944References
[1] S. M. Kazan et al., “Vascular autorescaling of fMRI (VasA fMRI) improves sensitivity of population studies: A pilot study.,” Neuroimage, vol. 124, no. Pt A, pp. 794–805, Jan. 2016, doi: 10.1016/j.neuroimage.2015.09.033. [2] N. Vigneau-Roy, M. Bernier, M. Descoteaux, and K. Whittingstall, “Regional variations in vascular density correlate with resting-state and task-evoked blood oxygen level-dependent signal amplitude,” Hum. Brain Mapp., vol. 35, no. 5, pp. 1906–1920, 2014, doi: 10.1002/hbm.22301. [3] S. Tak, J. R. Polimeni, D. J. J. Wang, L. Yan, and J. J. Chen, “Associations of resting-state fMRI functional connectivity with flow-BOLD coupling and regional vasculature.,” Brain Connect., vol. 5, no. 3, pp. 137–46, Apr. 2015, doi: 10.1089/brain.2014.0299. [4] M. J. Brookes et al., “Investigating the electrophysiological basis of resting state networks using magnetoencephalography,” Proc. Natl. Acad. Sci. U. S. A., vol. 108, no. 40, pp. 16783–16788, Oct. 2011, doi: 10.1073/pnas.1112685108. [5] M. L. Schölvinck, A. Maier, F. Q. Ye, J. H. Duyn, and D. A. Leopold, “Neural basis of global resting-state fMRI activity,” Proc. Natl. Acad. Sci. U. S. A., vol. 107, no. 22, pp. 10238–10243, Jun. 2010, doi: 10.1073/pnas.0913110107. [6] Y. Ma et al., “Resting-state hemodynamics are spatiotemporally coupled to synchronized and symmetric neural activity in excitatory neurons,” Proc. Natl. Acad. Sci. U. S. A., vol. 113, no. 52, pp. E8463–E8471, Dec. 2016, doi: 10.1073/pnas.1525369113. [7] Y. Tong and B. de B. Frederick, “Tracking cerebral blood flow in BOLD fMRI using recursively generated regressors,” Hum. Brain Mapp., vol. 35, no. 11, pp. 5471–5485, Nov. 2014, doi: 10.1002/hbm.22564. [8] K.-L. Nguyen et al., “Multicenter Safety and Practice for Off-Label Diagnostic Use of Ferumoxytol in MRI,” Radiology, p. 190477, Oct. 2019, doi: 10.1148/radiol.2019190477. [9] M. Bernier et al., “Human cerebral white-matter vasculature imaged using the blood-pool contrast agent Ferumoxytol: bundle-specific vessels and vascular density,” Proc Intl Soc Mag Reson Med, vol. 28, p. 0016, 2020. [10] S. Cetin, A. Demir, A. Yezzi, M. Degertekin, and G. Unal, “Vessel tractography using an intensity based tensor model with branch detection,” IEEE Trans. Med. Imaging, vol. 32, no. 2, pp. 348–363, 2013, doi: 10.1109/TMI.2012.2227118. [11] S. Cetin and G. Unal, “A higher-order tensor vessel tractography for segmentation of vascular structures,” IEEE Trans. Med. Imaging, vol. 34, no. 10, pp. 2172–2185, Oct. 2015, doi: 10.1109/TMI.2015.2425535. [12] E. Garyfallidis et al., “Recognition of white matter bundles using local and global streamline-based registration and clustering,” Neuroimage, vol. 170, pp. 283–295, Apr. 2018, doi: 10.1016/j.neuroimage.2017.07.015. [13] S. Zhang and K. Arfanakis, “Evaluation of standardized and study-specific diffusion tensor imaging templates of the adult human brain: Template characteristics, spatial normalization accuracy, and detection of small inter-group FA differences,” Neuroimage, vol. 172, pp. 40–50, May 2018, doi: 10.1016/j.neuroimage.2018.01.046. [14] M. Bernier, S. C. Cunnane, and K. Whittingstall, “The morphology of the human cerebrovascular system,” Hum. Brain Mapp., vol. 39, no. 12, pp. 4962–4975, Dec. 2018, doi: 10.1002/hbm.24337. [15] F.-C. Yeh, T. D. Verstynen, Y. Wang, J. C. Fernández-Miranda, and W.-Y. I. Tseng, “Deterministic Diffusion Fiber Tracking Improved by Quantitative Anisotropy,” PLoS One, vol. 8, no. 11, p. e80713, Nov. 2013, doi: 10.1371/journal.pone.0080713. [16] F. C. Yeh, V. J. Wedeen, and W. Y. I. Tseng, “Generalized q-sampling imaging,” IEEE Trans. Med. Imaging, vol. 29, no. 9, pp. 1626–1635, Sep. 2010, doi: 10.1109/TMI.2010.2045126. [17] M. Bernier, S. C. Cunnane, and K. Whittingstall, “The morphology of the human cerebrovascular system,” Hum. Brain Mapp., Sep. 2018, doi: 10.1002/hbm.24337. [18] I. Aganj, C. Lenglet, and G. Sapiro, “ODF maxima extraction in spherical harmonic representation via analytical search space reduction,” in Lecture Notes in Computer Science (including subseries Lecture Notes in Artificial Intelligence and Lecture Notes in Bioinformatics), 2010, vol. 6362 LNCS, no. PART 2, pp. 84–91, doi: 10.1007/978-3-642-15745-5_11. [19] M. G. Bright, J. R. Whittaker, I. D. Driver, and K. Murphy, “Vascular physiology drives functional brain networks,” Neuroimage, vol. 217, Aug. 2020, doi: 10.1016/j.neuroimage.2020.116907. [20] J. E. Chen et al., “Resting-state ‘physiological networks,’” Neuroimage, vol. 213, Jun. 2020, doi: 10.1016/j.neuroimage.2020.116707.Figures
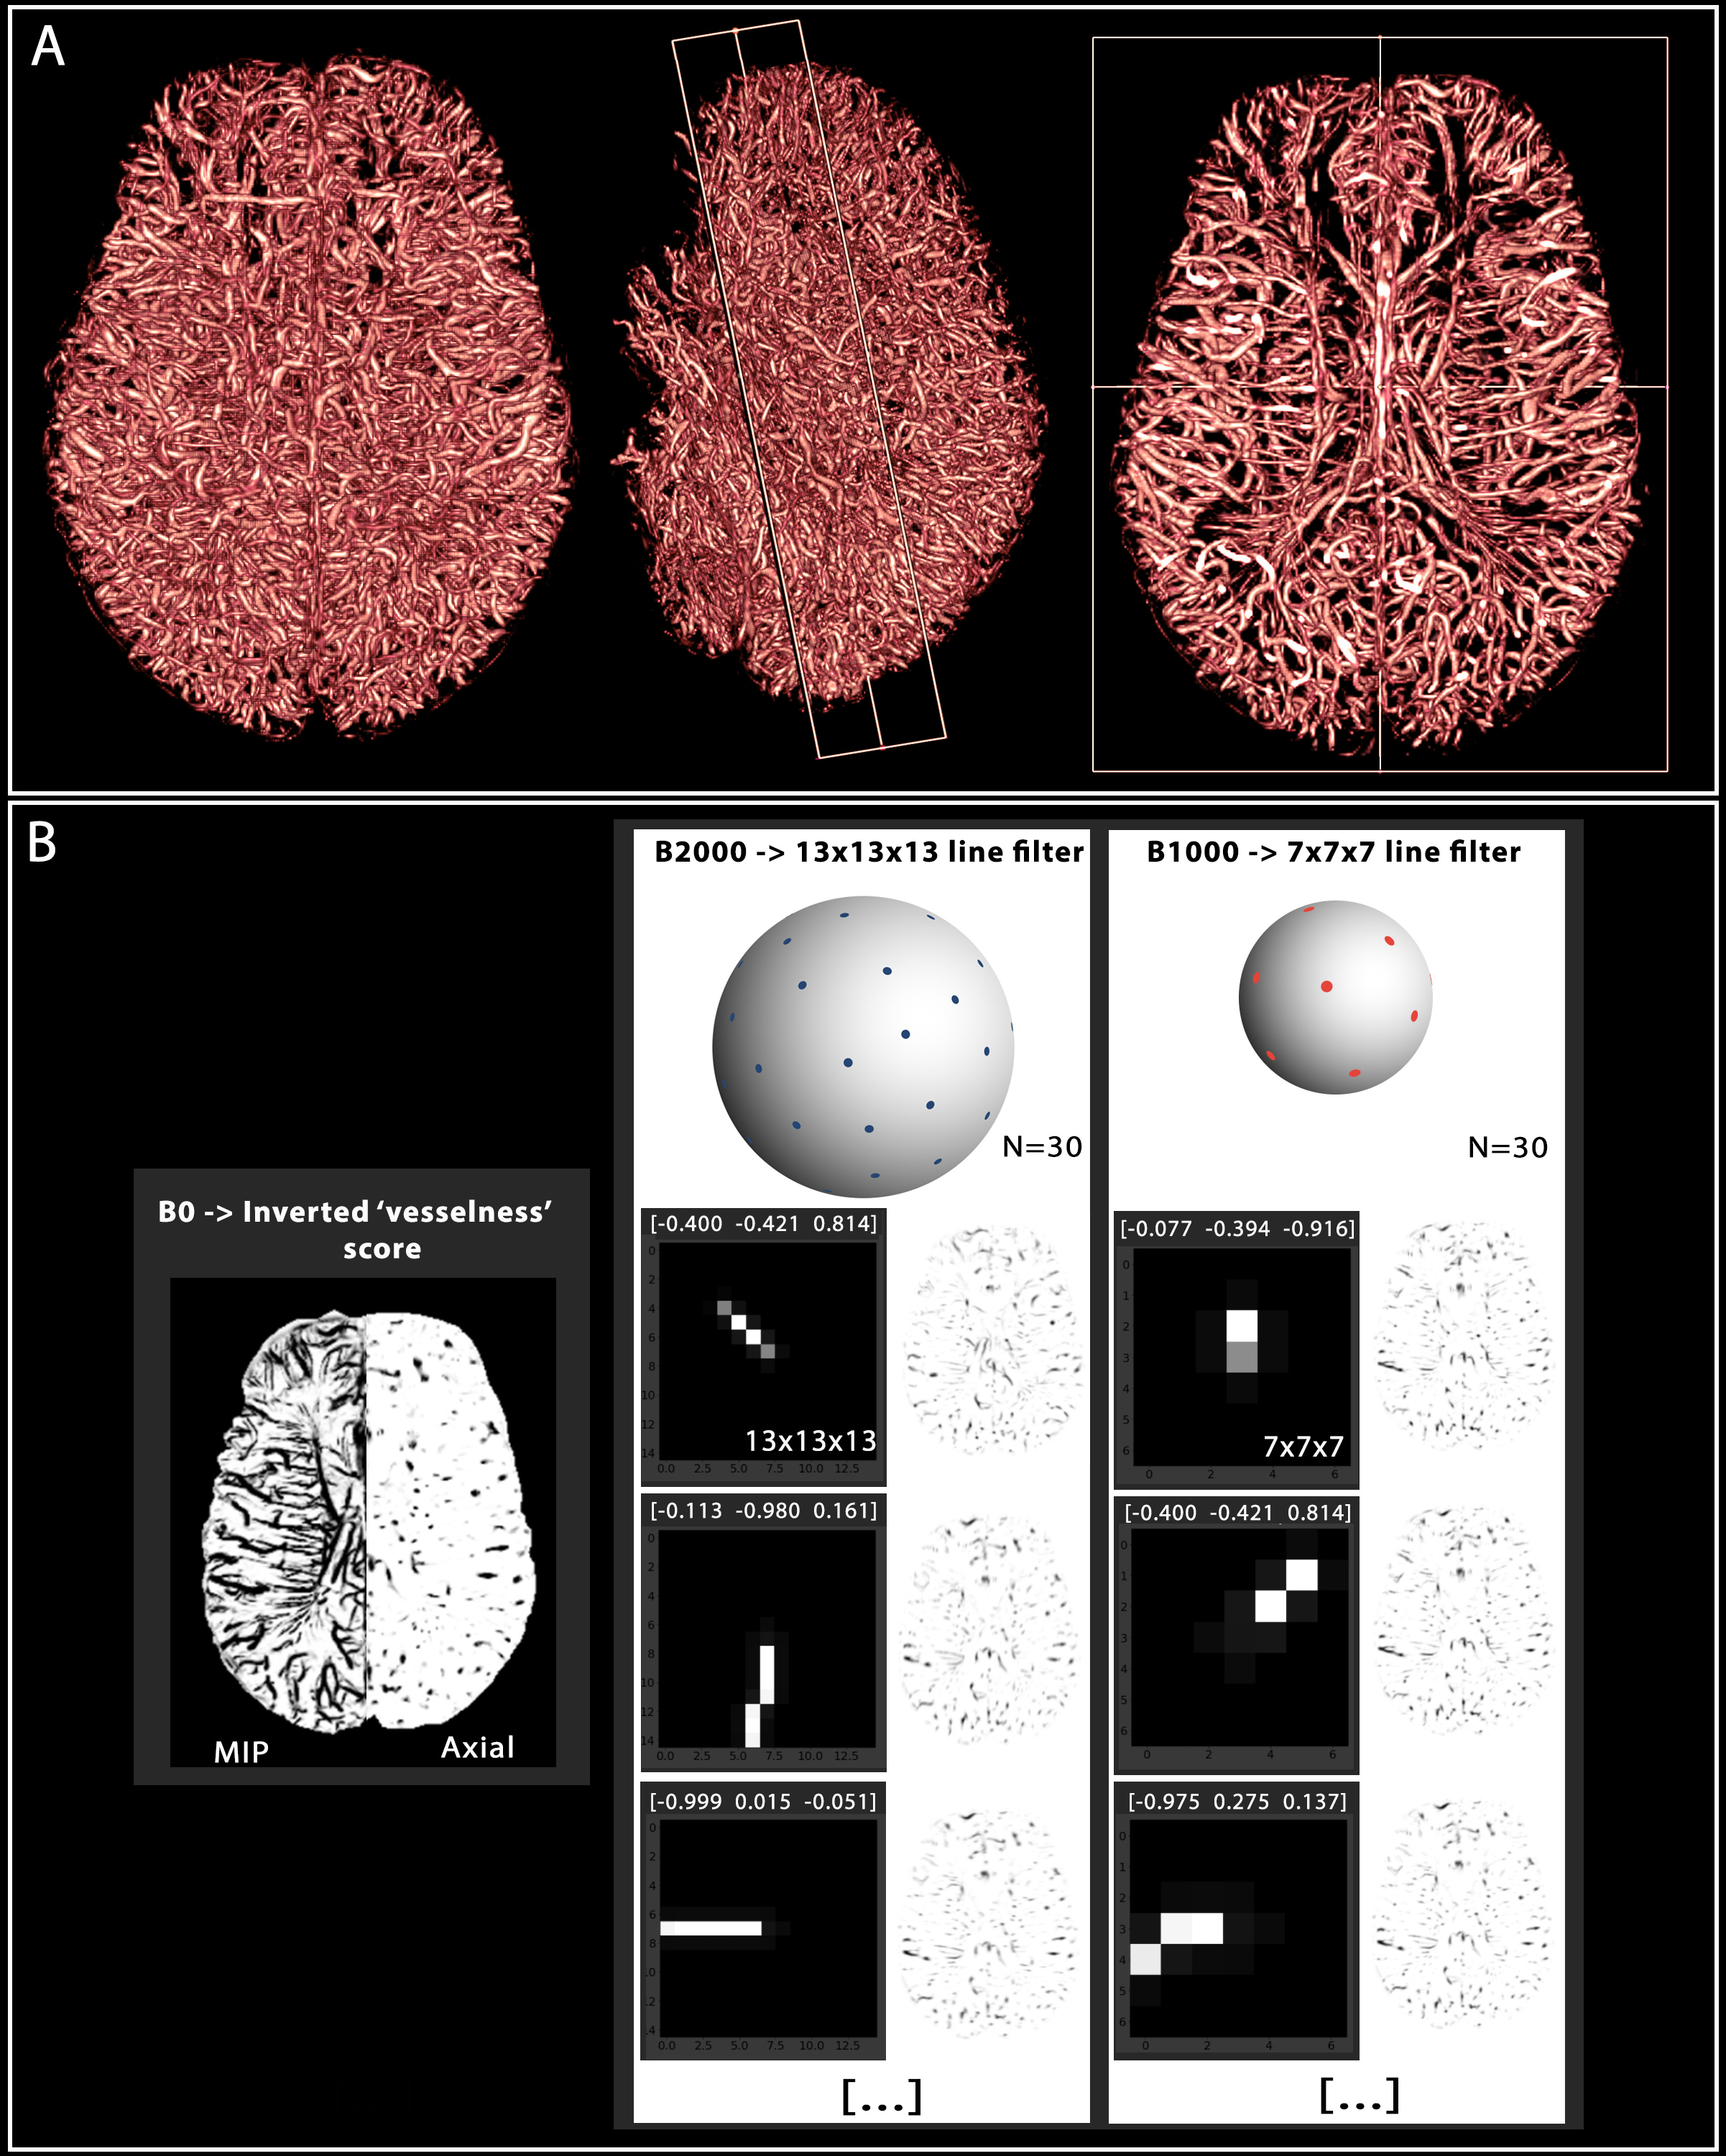
1. Vascular
segmentation and multidirectional filters. (A) 3D volumetric view
of the segmented meso-scale veins and arteries enhanced by Ferumoxytol. The axial cut on the right depicts anatomical patterns of
the vessels in both the WM and GM. (B) Using the
‘vesselness’ score from A as a ‘b=0’ image, we also show the two different
filter sizes (with three representative 3D filters projected along the z axis) representing the multi-shell approach (30 directions each). The filters are labeled by the x-y-z components
of their orientation vector, and their resulting images on the right.
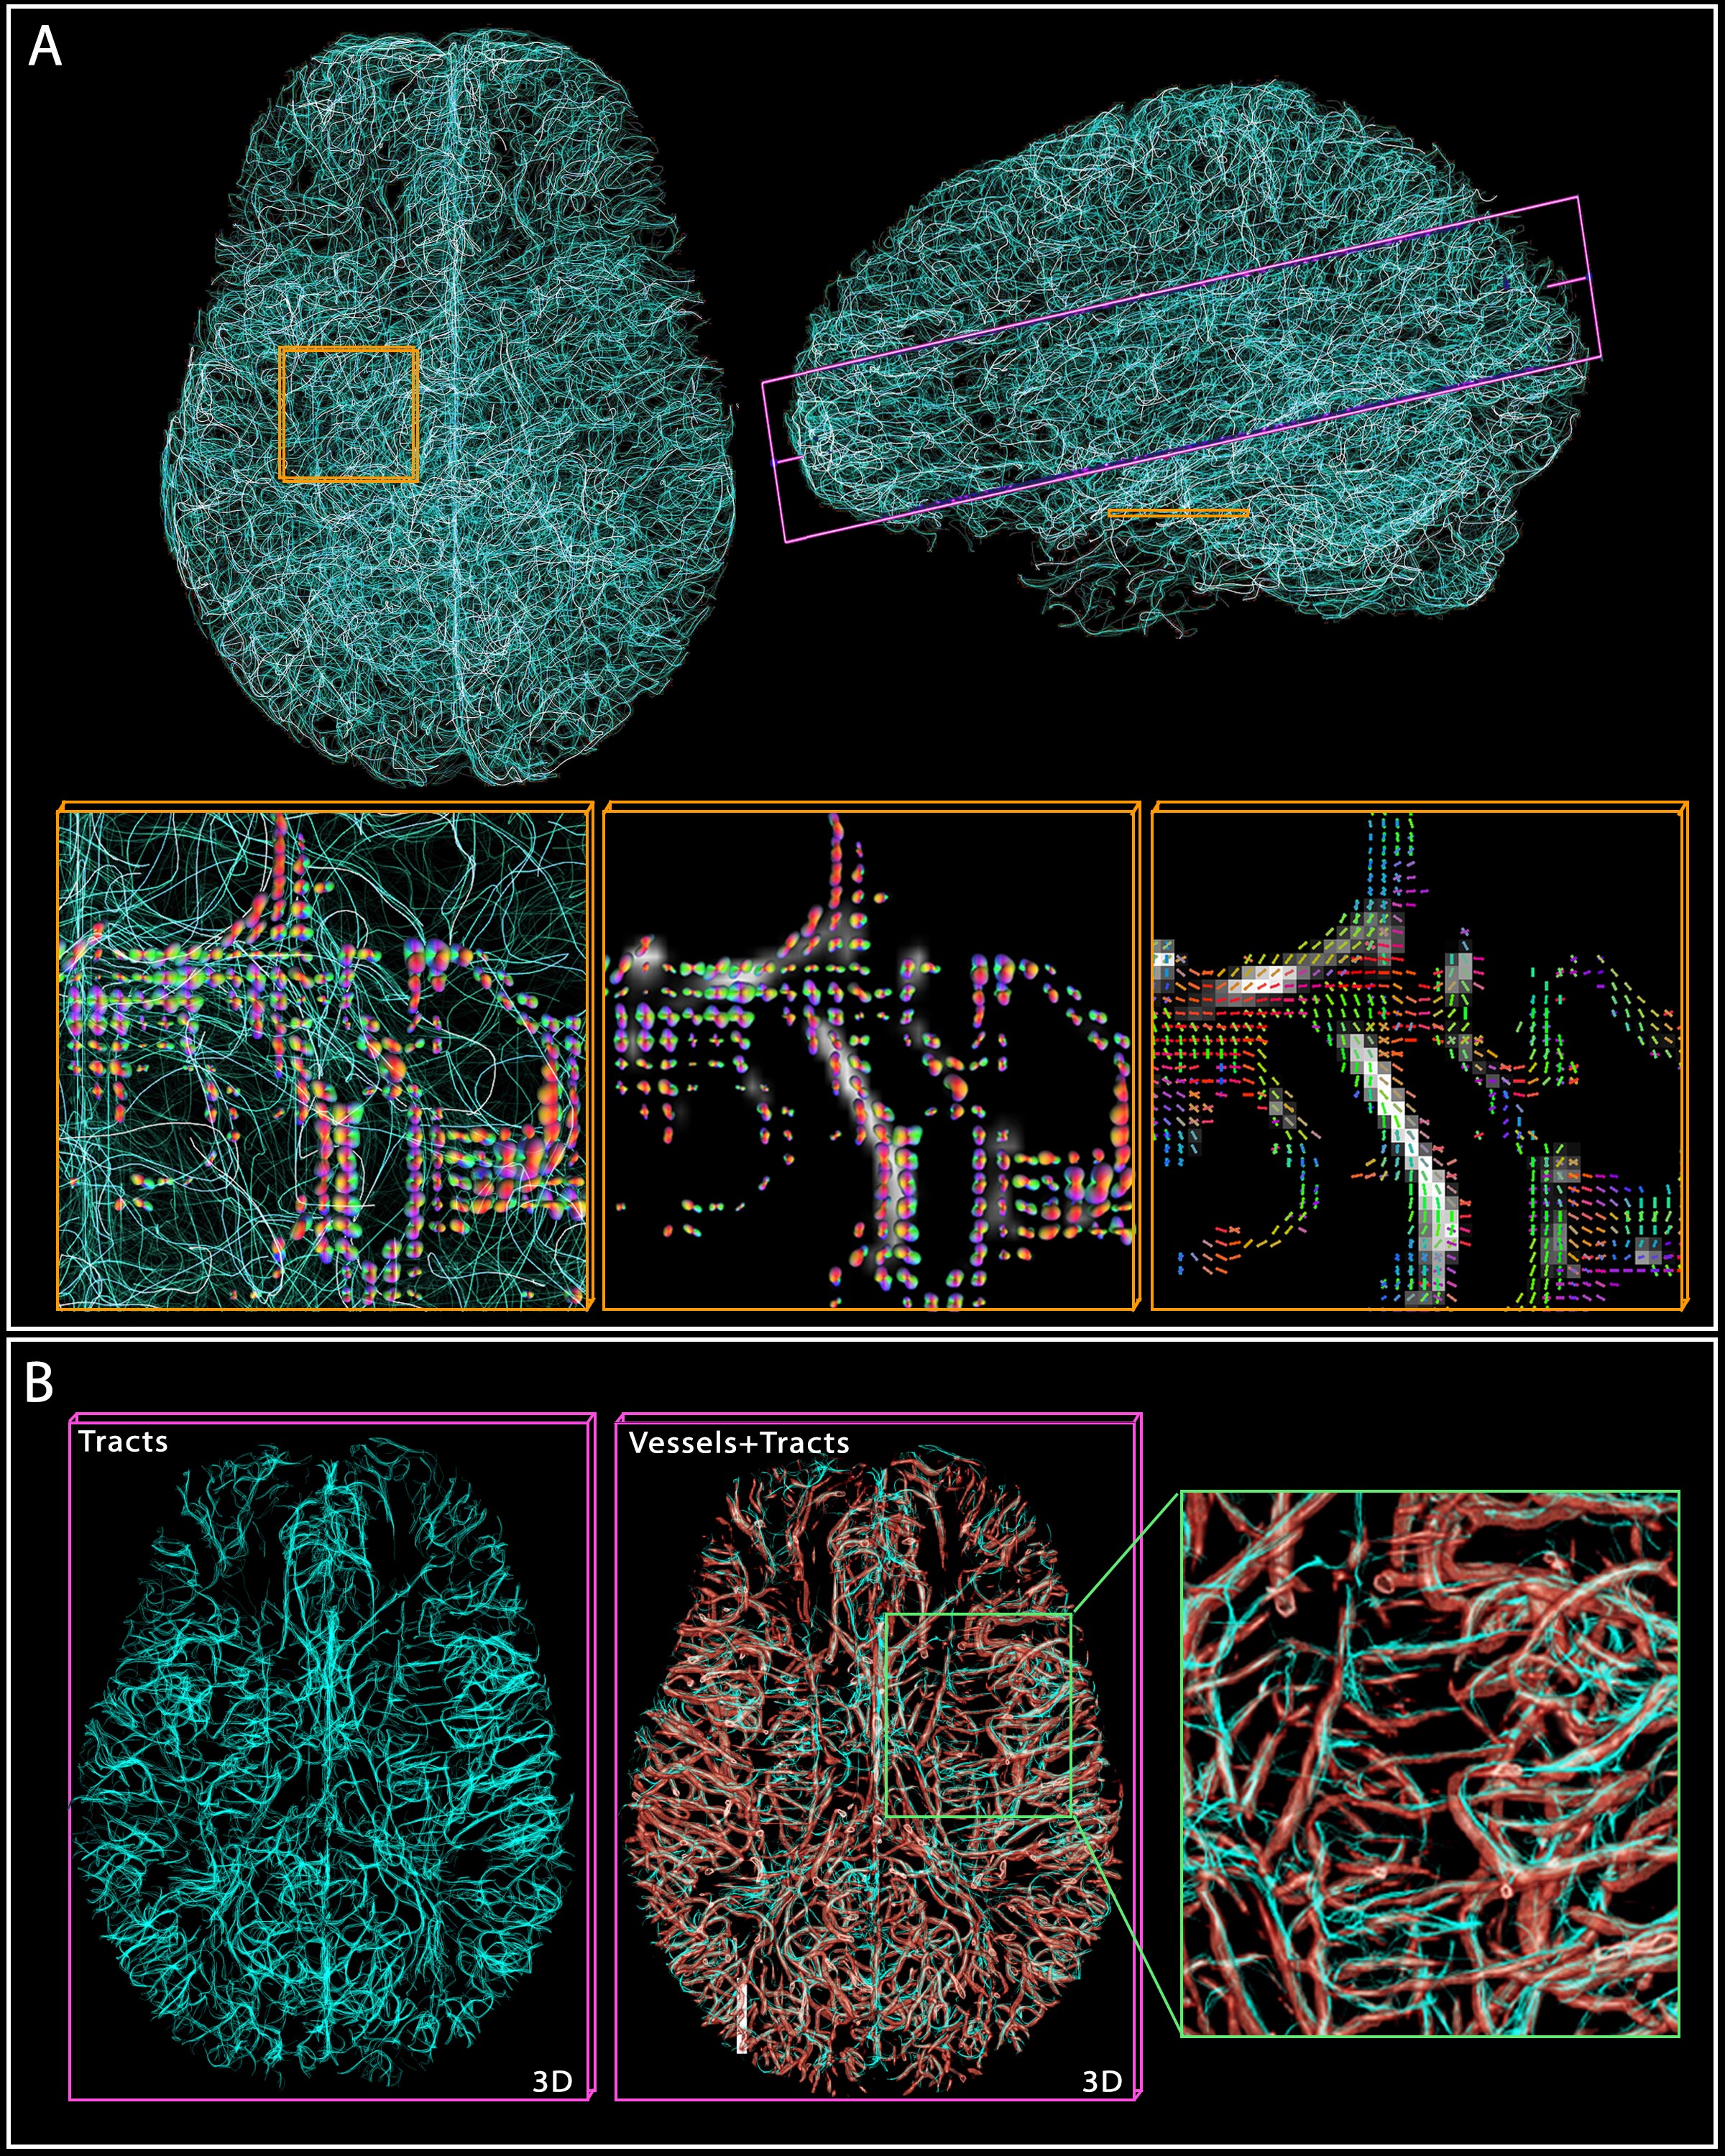
2. Vascular tractography. (A) shows 10k tracts reconstructed from the 200k computed, with two cross-sections
highlighted in yellow and purple. In yellow, the tracts and ‘vesselness’ scores
are overlaid by the ODF at crossings, while the rightmost shows the
main directions (tensor) of the ODFs. (B) In the purple cross-section, the
tracts and vessels are overlaid with transparency to demonstrate the
correspondence.
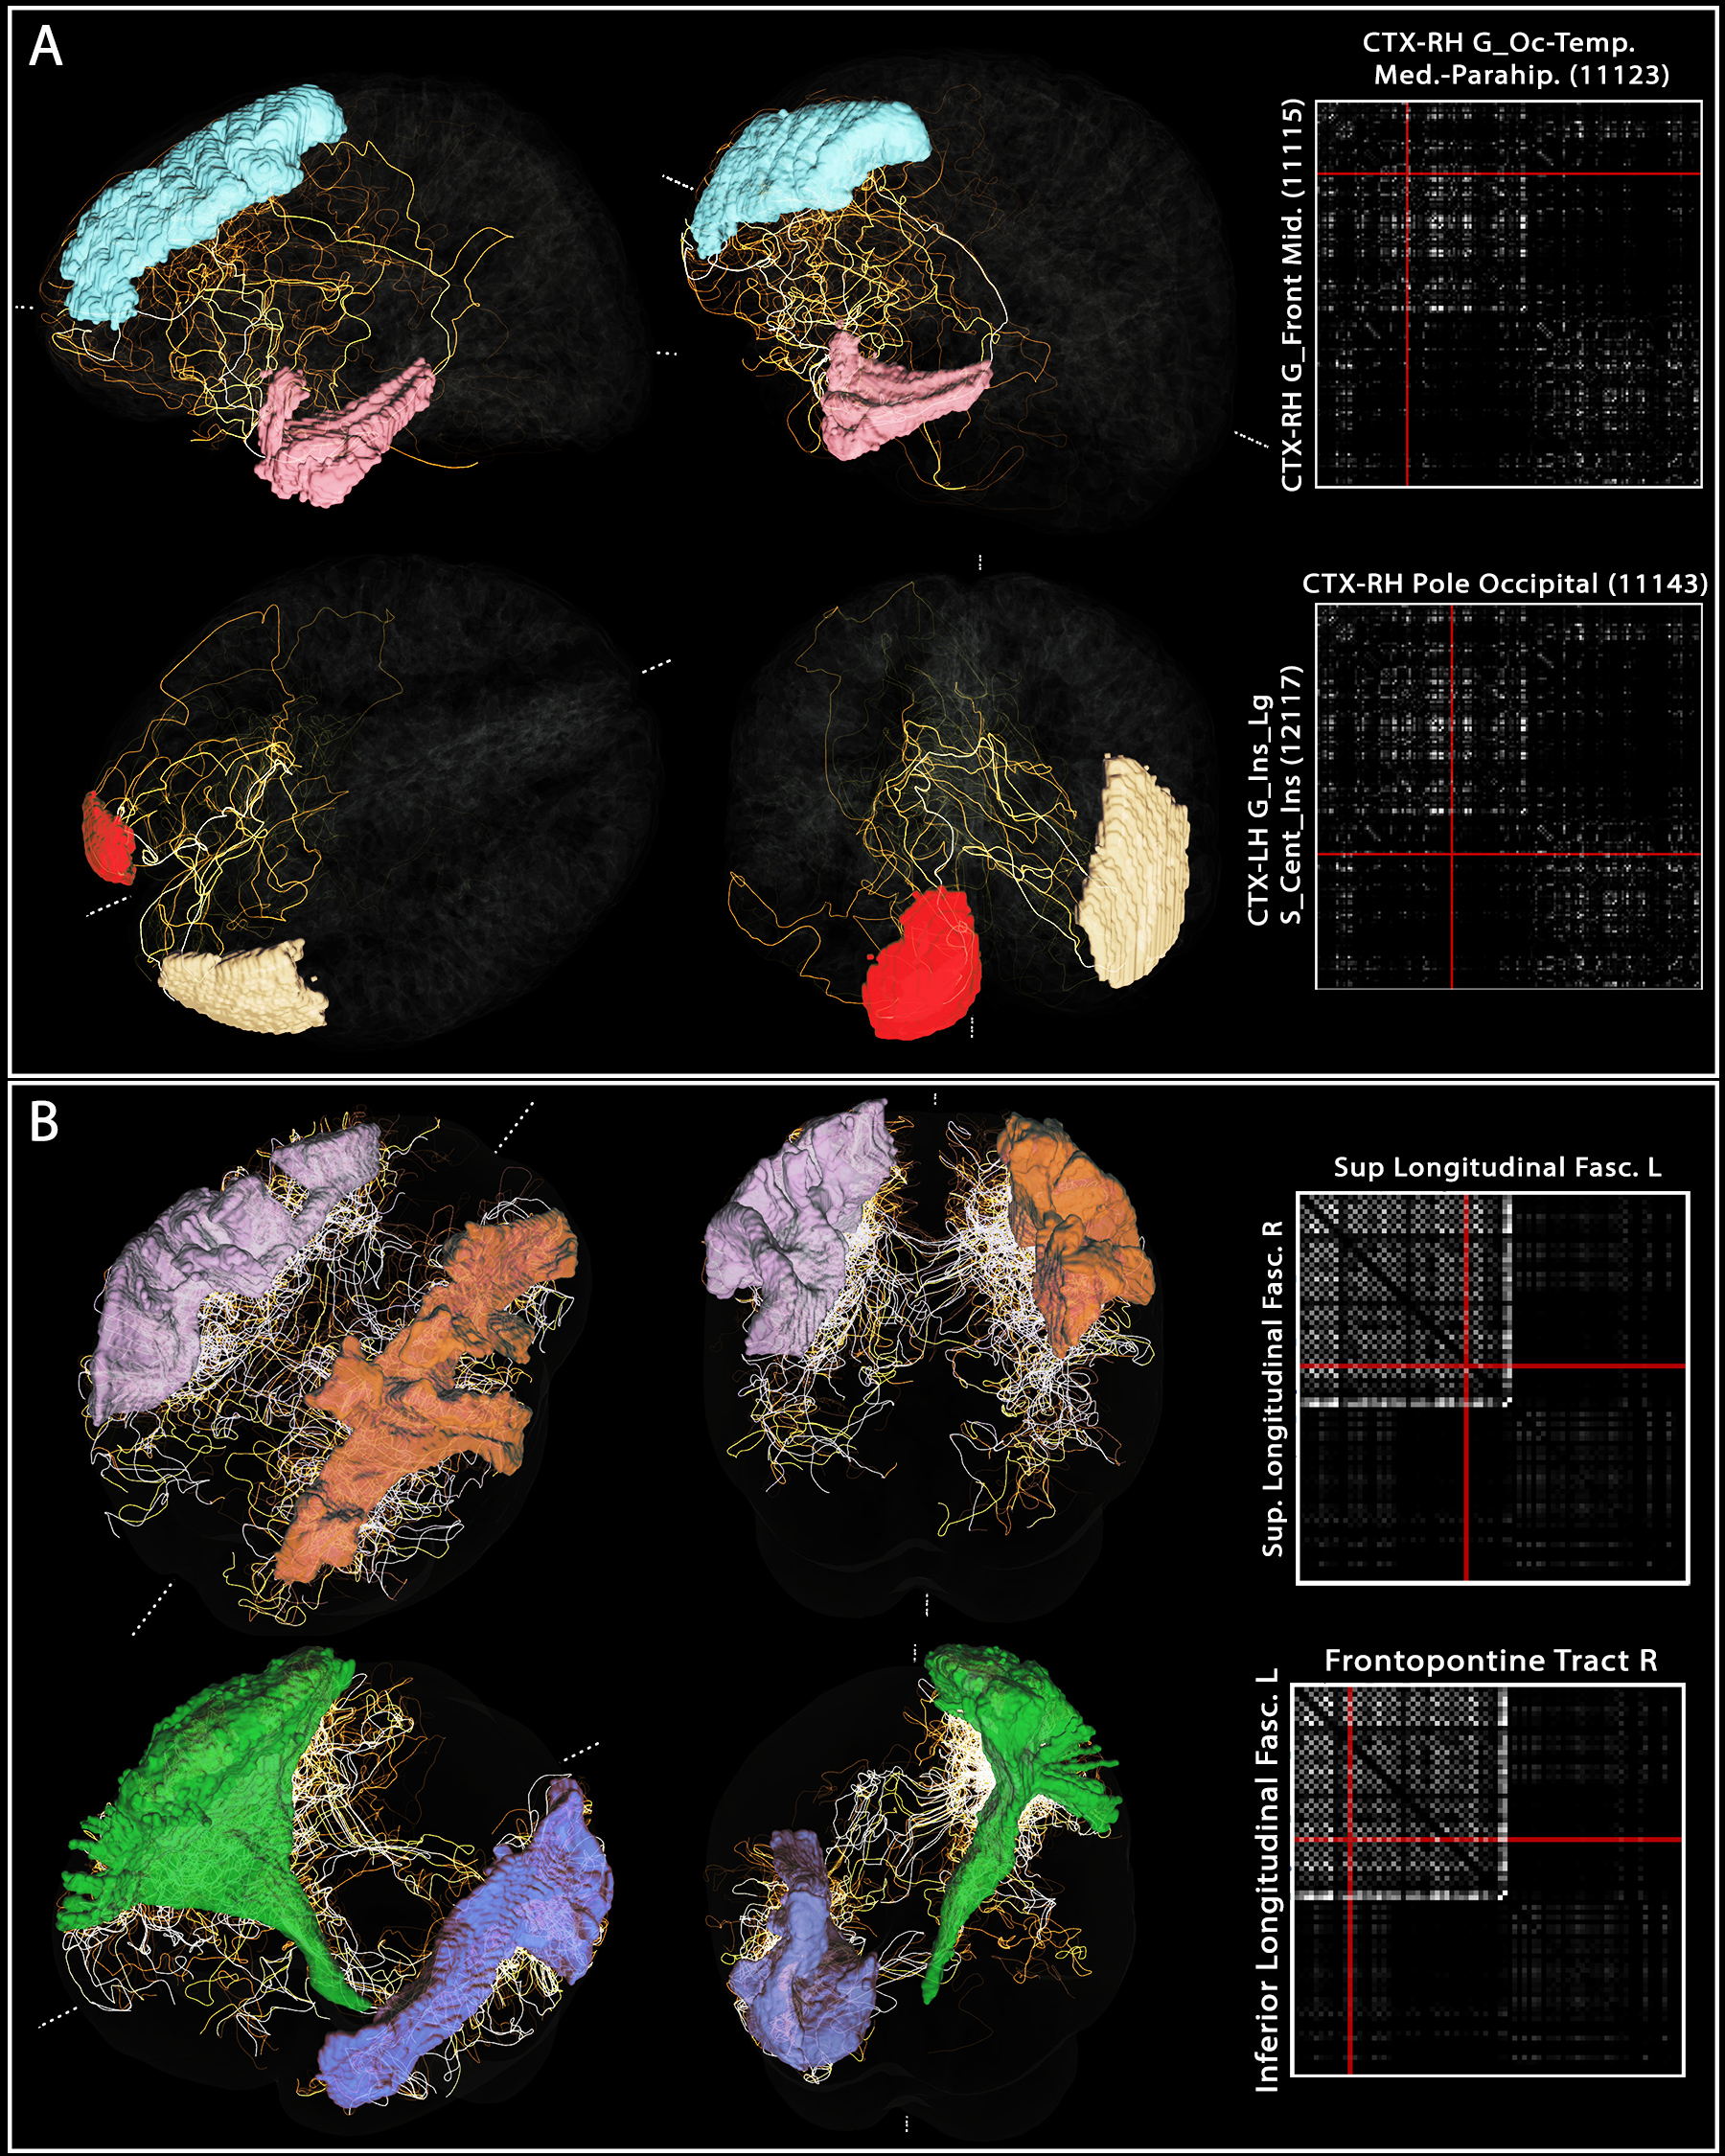
3. Example “vascular connectome” and specific
vascular pathways connecting pairs of brain regions. For both (A) Freesurfer’s Destrieux 2009 GM parcellation
and (B) Recobundle White-Matter bundle atlas, the connectome obtained for one
subject is shown. For each, two example region-to-region connections were
selected from the tracts computed previously to illustrate the complex pathway
connecting those regions.