0558
Quantitative T1 mapping by multi-slice multi-shot inversion recovery EPI: correction of fat suppression MT effects.1Sir Peter Mansfield Imaging Centre, UP, University of Nottingham, Nottingham, United Kingdom, 2Max Planck Institute for Human Cognitive and Brain Sciences, Leibzig, Germany, 3NIHR Nottingham Biomedical Research, University of Nottingham, Nottingham, United Kingdom
Synopsis
Multi-slice inversion–recovery EPI (MS-IR-EPI) combined with slice order shifting across multiple acquisitions can provide a fast method for high spatial resolution T1 mapping. However, magnetization transfer (MT) effects of spectrally-selective fat-suppression pulses used in in-vivo imaging shorten measured T1-values. Here we model the effect of fat-suppression pulses on measured T1 and use this model to remove the MT contribution, improving the accuracy of T1 quantification. MT-corrected high spatial resolution T1 maps of the human brain generated with MS-IR-EPI at 7T are compared with those generated with the widely implemented MP2RAGE sequence and standard single slice IR-EPI.
Introduction
High spatial resolution quantitative T1 maps can be obtained using 2D multi-slice multi-shot inversion recovery EPI (MS-IR-EPI)1 combined with slice order shifting across multiple acquisitions2. Although this sequence provides T1 maps which are homogenous across slices, the magnetization transfer (MT) effects of the spectrally selective fat-suppression (FS) pulses can shorten the fitted T1-values3. Here, we propose a model in the T1 quantification to correct for MT effects due to the FS pulses. Corrected MS-IR-EPI T1-values are compared with T1-values derived from MP2RAGE and standard single slice IR-EPI methods.Methods
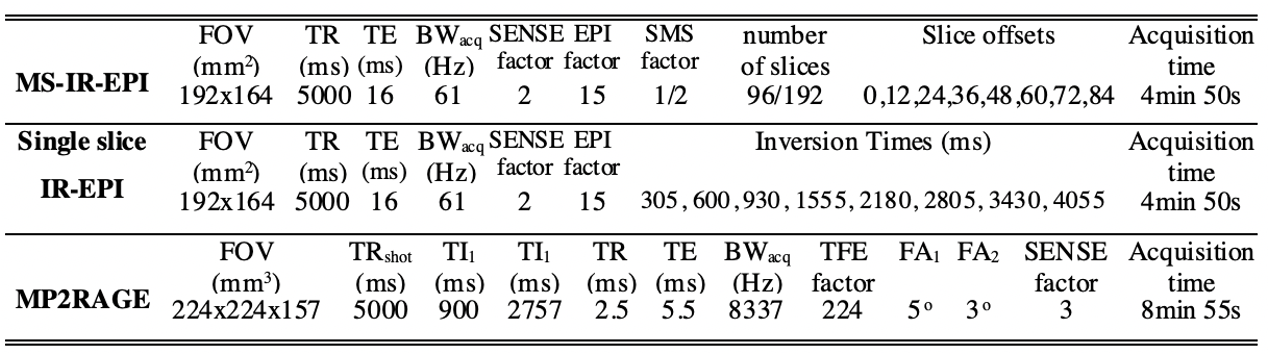
Three subjects were scanned on a 7T Philips Achieva scanner to measure longitudinal relaxation rate, R1, derived from MS-IR-EPI (0.7mm isotropic) at a range of nominal SPIR (spectral pre-saturation with inversion recovery) FS pulse flip angles (FA)=[30,40,50,60,70]o . Additional data sets with no FS (0o) as well as a B1-map were also acquired. R1 was modelled as a function of myelin density, m, and the B1-field distribution, X: R1=a×m +b×FA×X×m, where a and b are constants. For each subject, a voxel-wise linear fit of R1 versus FA×X was performed to estimate a×m and b×m from least-squares regression, and thus evaluate (b/a) for each voxel. A corrected R1 map (R 1,corr) was then computed for each data set collected with a given FA of fat-suppression from: R1,corr=R1/(1+b/a×FA×X). R1 maps were corrected using a (i) voxel specific (b/a) parameter (voxel-wise correction) or (ii) constant (b/a) value (defined from the mode of the histogram of (b/a) values) for each voxel (global correction). Five subjects participated in a second experiment to compare whole head 0.7mm isotropic resolution T1 maps derived from MS-IR-EPI (SMS=3, SPIR FA=70o) with those derived from MP2RAGE corrected for B1-inhomogeneities and single slice T1 maps derived from a standard IR-EPI acquisition (see Figure 1 for protocol parameters). An additional acquisition using SPIR with FA=40o was performed for two subjects (who did not participate in the previous experiment) to compute subject-specific global (b/a) parameters for removal of MT effects due to the FS pulses.Results
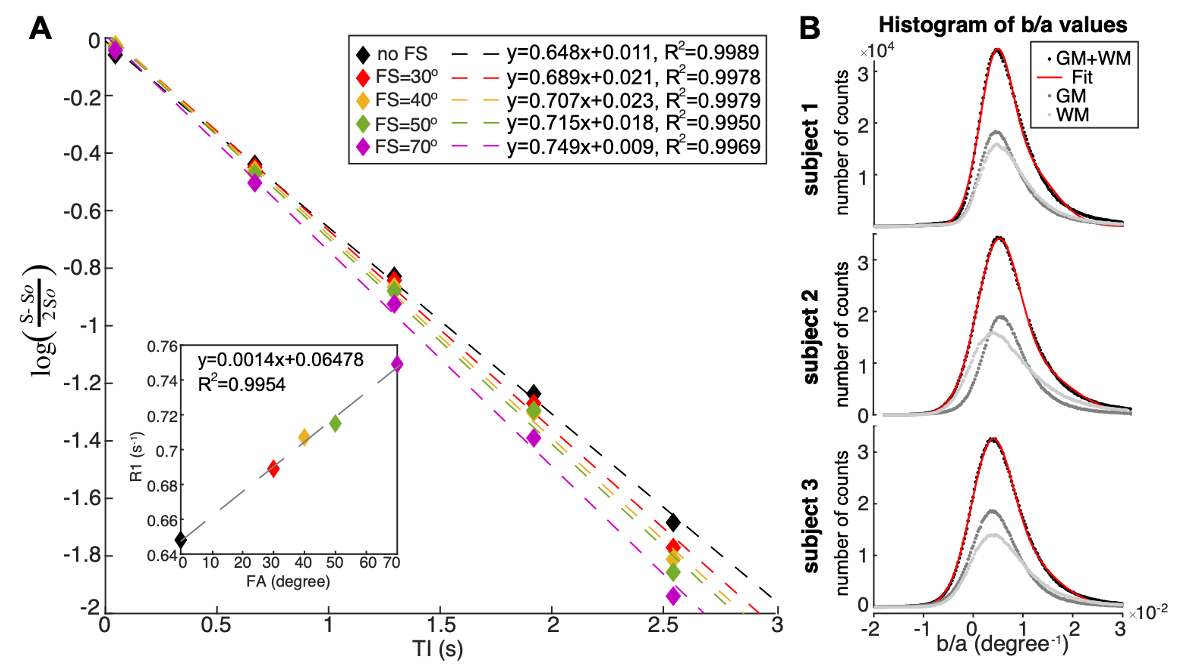
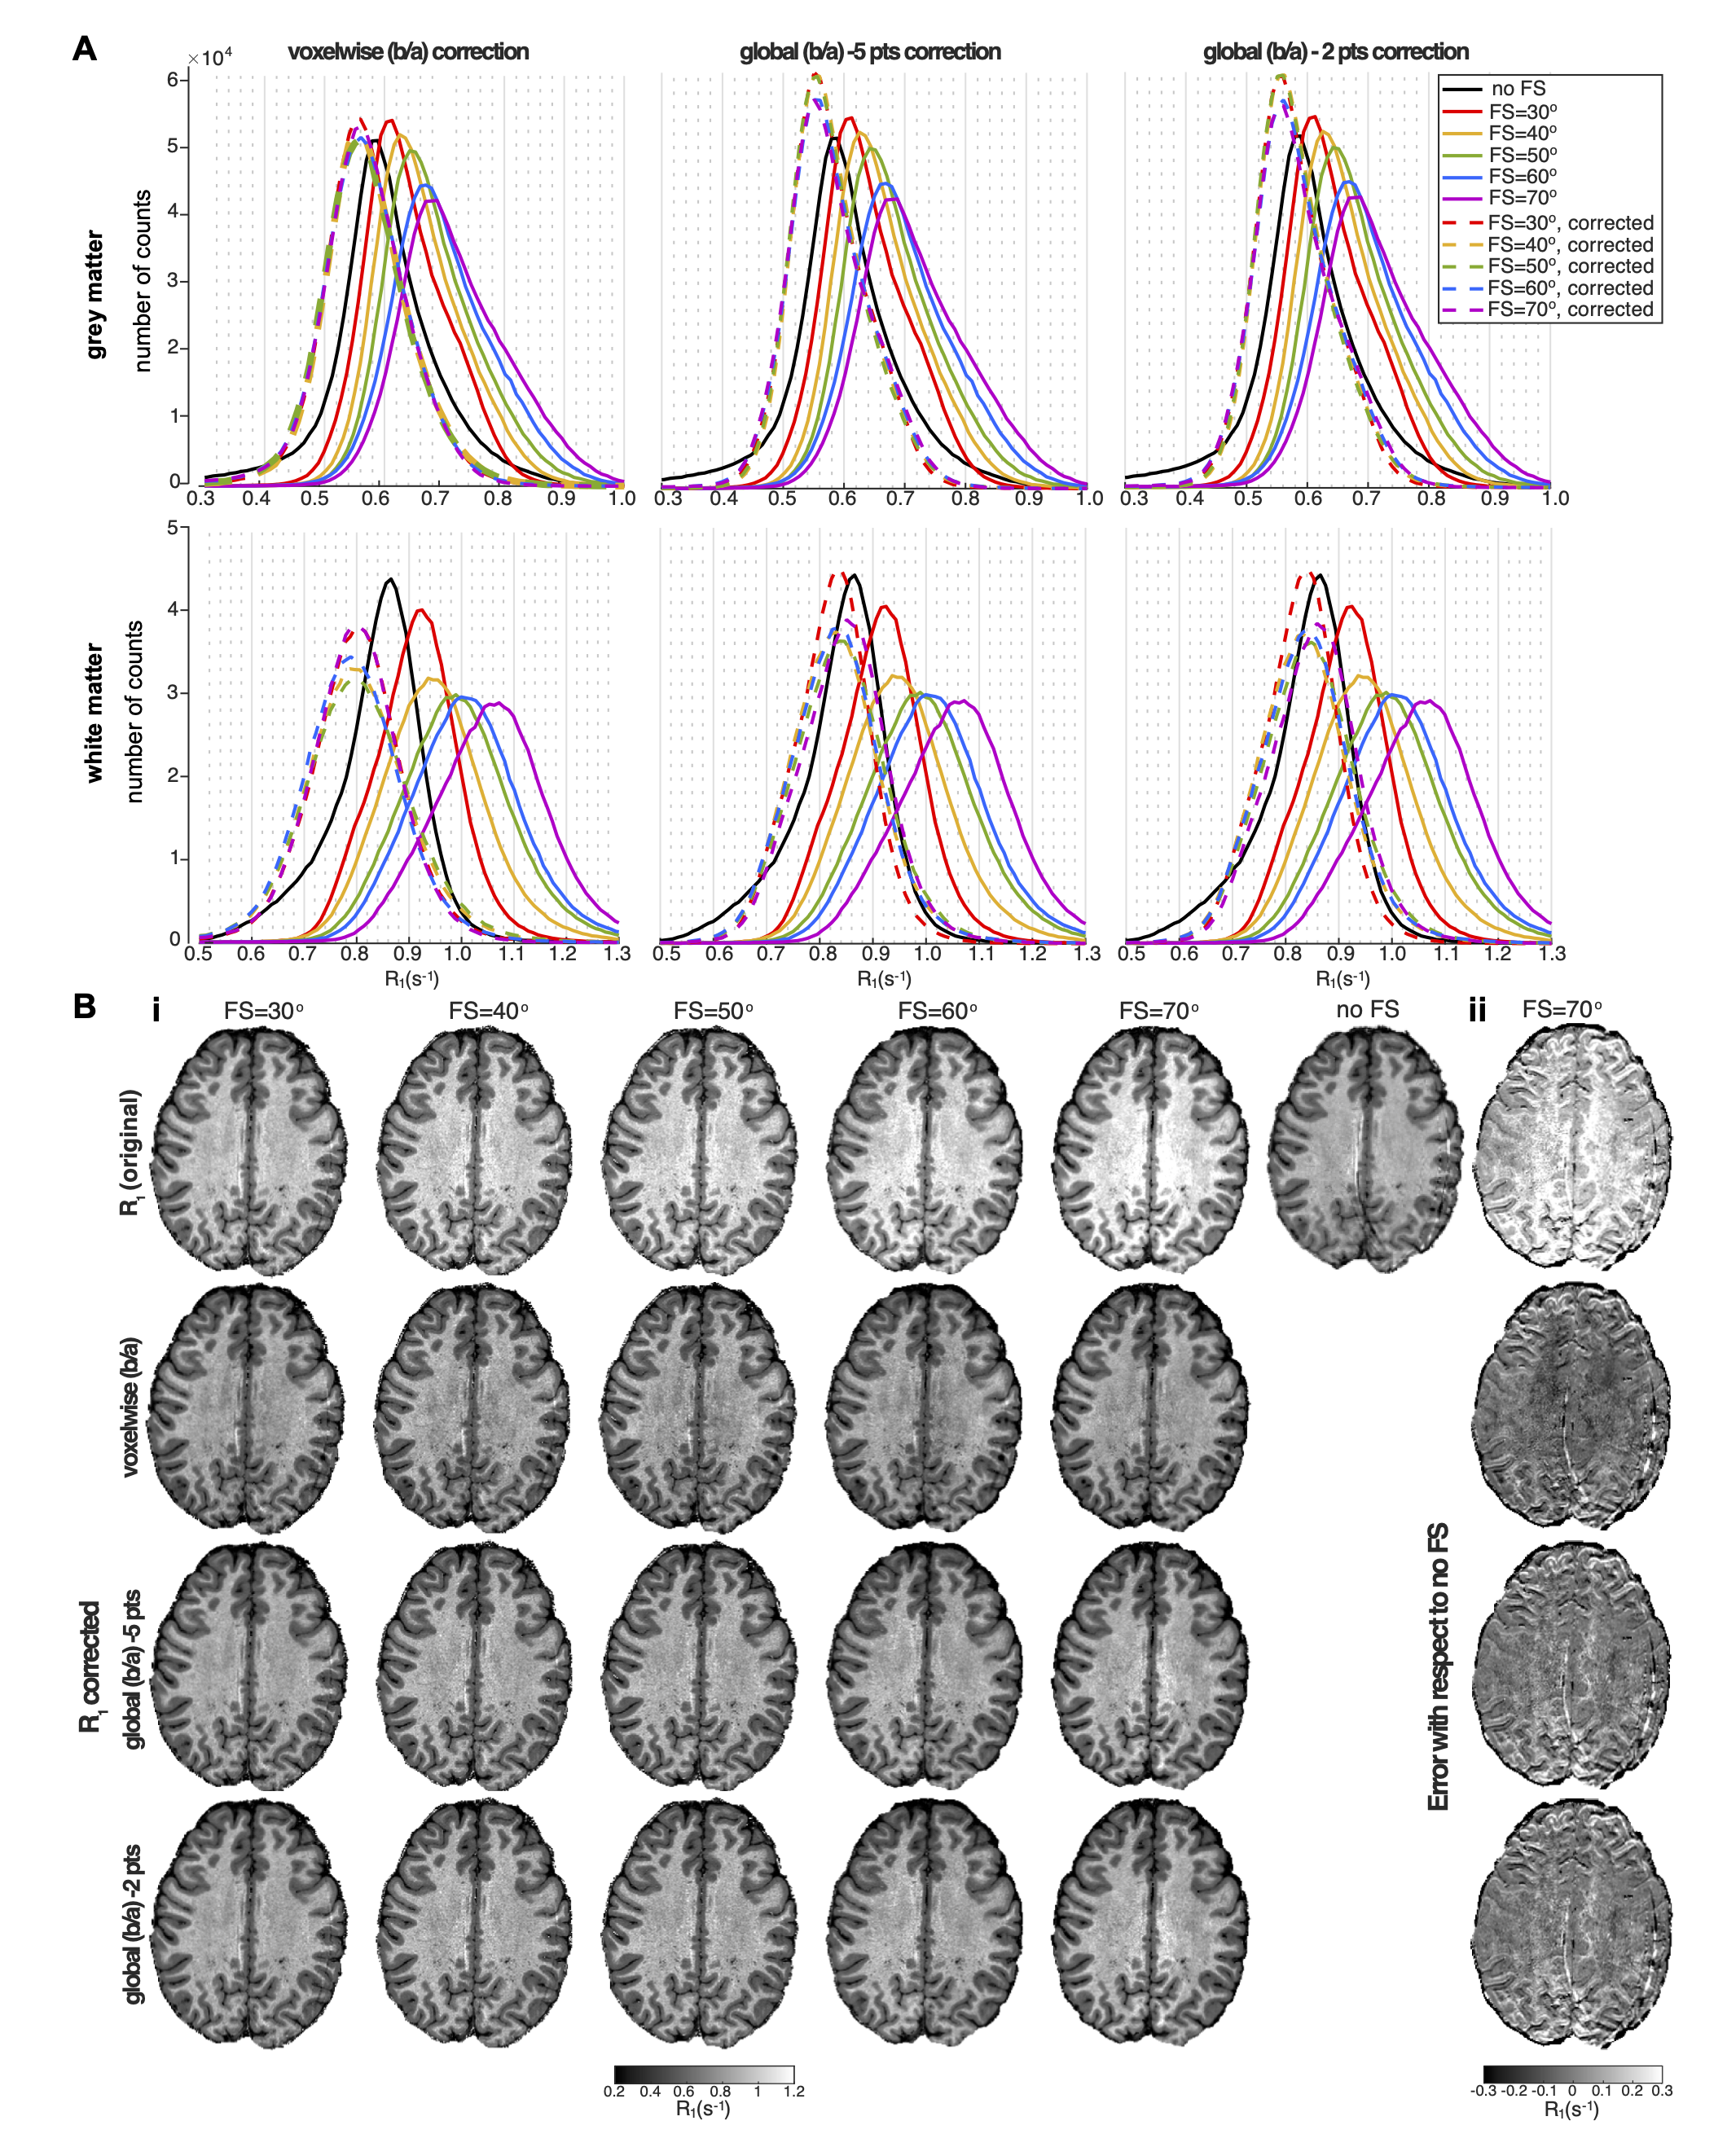
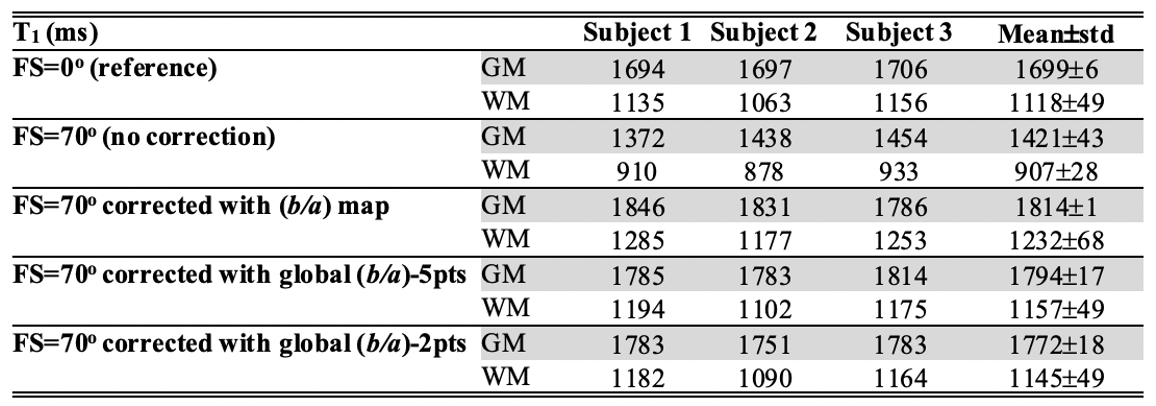
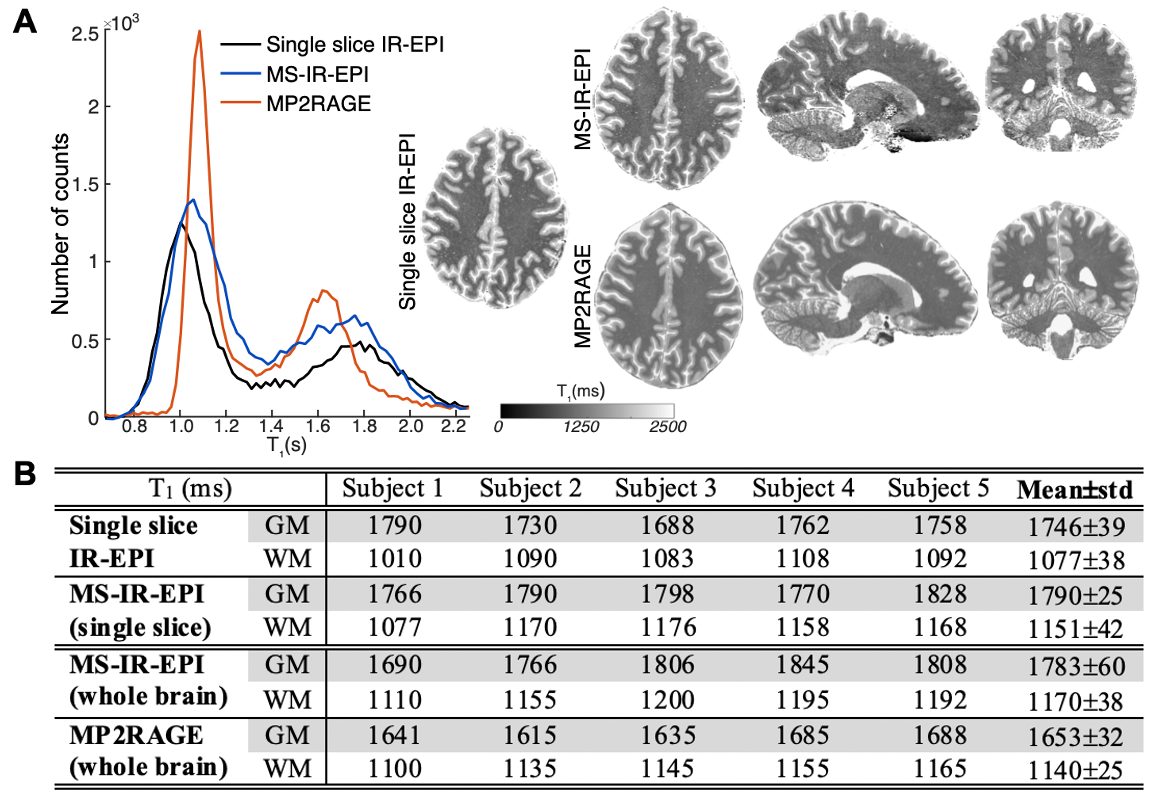
The proposed model correction assumes that the decay of water proton longitudinal magnetisation in brain tissue is mono-exponential. Logarithmic plots of the MS-IR-EPI signal intensity (ROI in corpus callosum) versus inversion time (TI) (Figure 2A) show a very strong linear relation (R2>0.99) for each data set acquired at different FS levels, and a strong linear correlation of the fitted R1-values versus fat-suppression FA (R2=0.9954, inset). The fitted (b/a) parameter values were fairly constant across the brain and subjects (0.0045±0.0002degree-1, derived from a two Gaussian mixture model fit (red line, Figure 2B)). Figure 3A shows spread of R1-histograms with no correction (solid colour lines), and the resulting similarity of R1-histograms for the different FS levels after (b/a) correction (dash colour lines) which are in close agreement to the R1-histogram of data collected without FS (black line). Figure 3B shows the close similarity of the corrected R1 maps (SPIR with FA=70o to effectively suppress fat artefact) to those maps acquired with no FS. Similar results were obtained when using a reduced dataset of two R1 maps with fat-suppression FAs=[40o,70o] to derive a global (b/a) correction parameter and perform voxel-wise correction (Figure 3&4). Figure 5 shows that after correction, the GM peak for MS-IR-EPI (blue) is similar to a standard single slice IR-EPI (black line), but the WM peak T1 is longer (by 6.3% across subjects). MP2RAGE yields a WM peak T1 similar to that of MS-IR-EPI, but a shorter GM peak (T1=1653/1783ms measured with MP2RAGE/MS-IR-EPI for the whole brain volume across subjects).Discussion
A model has been described to correct MT effects due to SPIR fat-suppression of a given FA from estimated R1 maps. We recommend a global (b/a) correction, because voxel-wise correction introduces propagated noise in the corrected R1 maps. The success of the global correction method implies that the relationship between the longitudinal relaxation described by intrinsic T1 and the magnetization transfer rate remains constant across brain voxels, an assumption which holds if T1 and MT are dominated by the membrane lipid content (rather than iron or proteins) and supported by findings that T1 and MT become uniform in brain tissue cleared of lipids4. Given the stability of the global (b/a) correction parameter across subjects, the mean value across a group of subjects could be used as a MT correction parameter for all acquisitions (once determined for the desired version of the MS-IR-EPI protocol on a specific MR scanner). T1-values after correction are similar than those obtained with single slice IR-EPI and close to values previously reported using IR-SE5 and MP2RAGE6-8 (using TRshot≥6s). T1-values derived for GM from our MP2RAGE data were shorter than for the MS-IR-EPI data, but similar to reported T1-values (1660±35ms)9 obtained using MP2RAGE with TRshot=5s. This suggest a TRshot=5s is too short to accurately measure GM T1 using MP2RAGE, but this is accurately measured in GM using MS-IR-EPI with TR=5s.Conclusion
Accurate T1 quantification is possible in the presence of SPIR fat suppression pulses using our proposed method to correct MT effects. This method could be applied to other T1 mapping methods once the (b/a) parameter (which is specific to each protocol, site and vendor) has been characterized.Acknowledgements
This work was funded by a Leverhulme Trust fellowship to RSP and supported by the UK Medical Research Council [grant number MR/M022722/1].
References
1. Sanchez Panchuelo RM, Turner R., Mougin OE and Francis ST. A 2D multi- shot IR EPI T1 mapping. Proc. Intl. Soc. Mag. Reson. Med., Paris, 2018; #26.
2. Ordidge RJ, Gibbs P, Chapman B, et al. High‐ speed multislice T1 mapping using inversion‐recovery echo‐planar imaging. Magn. Reson. Med. 1990; 16, 238–245.
3. Shin W, Gu H and Yang Y. Incidental magnetization transfer contrast by fat saturation preparation pulses in multislice look-locker echo planar imaging. Magn. Reson. Med. 2009;62, 520–526.
4. Leuze C, Aswendt M, Ferenczi E, et al. The separate effects of lipids and proteins on brain MRI contrast revealed through tissue clearing. Neuroimage, 2017; 156, 412-422.
5. Dieringer MA., Deimling M, Santoro D, et al. Rapid parametric mapping of the longitudinal relaxation time T1 using two-dimensional variable flip angle magnetic resonance imaging at 1.5 Tesla, 3 Tesla, and 7 Tesla. PLoS One, 2014;9(3), e91318.
6. Marques JP, Kober T, Krueger G, et al. MP2RAGE, a self bias-field corrected sequence for improved segmentation and T1-mapping at high field. NeuroImage, 2010;49(2): 1271–81.
7. Caan MWA., Bazin PL, Marques JP, et al. MP2RAGEME: T1, T2*, and QSM mapping in one sequence at 7 tesla. Hum. Brain Mapp. 2019;40,1786-1798.
8. Metere R, Kober T, Möller HE and Schäfer A. Simultaneous Quantitative MRI Mapping of T1, T2* and Magnetic Susceptibility With Multi-Echo MP2RAGE. PLoS One, 2017;12, e0169265.
9. Kashyap S, Ivanov D, Havlicek M, et al. Impact of acquisition and analysis strategies on cortical depth-dependent fMRI. Neuroimage, 2018;168, 332-344.
Figures