0554
Rapid Parametric Mapping Using the Unsuppressed Water Signals in Metabolic Imaging of the Brain1Department of Electrical and Computer Engineering, University of Illinois at Urbana-Champaign, Urbana, IL, United States, 2Beckman Institute for Advanced Science and Technology, University of Illinois at Urbana-Champaign, Urbana, IL, United States, 3School of Biomedical Engineering, Shanghai Jiao Tong University, Shanghai, China
Synopsis
Both quantitative MR parametric mapping and MRSI take long scan times. SPICE has recently demonstrated a unique capability for simultaneous metabolic imaging and water imaging. Taking advantage of the unsuppressed water signals acquired using SPICE, we extended the SPICE technique with a new feature for fast parametric mapping. With one-minute extra scan time, T1 and T2 maps at 1.0×1.0×2.0 mm3 resolution were successfully obtained. This new capability enables simultaneous high-resolution parametric mapping and metabolic imaging of the human brain in a total 8-minute scan.
Introduction
Both quantitative MR relaxometry and metabolic imaging using MRSI have long been of great interest in both scientific research and clinics. But traditional imaging methods for each modality require long scan times (more than 20 minutes), and they are usually acquired and processed separately, thus leading to longer total scan times.1,2 Recently, advanced methods have been developed for fast parametric mapping like MRF and EPTI,3,4 and SPICE has demonstrated the capability of simultaneous high-resolution imaging of water and metabolite signals.5-8 In this work, we proposed a new method to achieve fast T1 and T2 mapping with metabolic imaging leveraging these advances. The basic SPICE sequence was extended with variable flip angles and T2-preparation pulses for T1 and T2 mapping; and the auxiliary data with limited and sparse coverage of (k, t)-space were integrated with the unsuppressed water signals from the SPICE scan in image reconstruction. As a result, quantitative T1 and T2 maps at 1.0×1.0×2.0 mm3 resolution were obtained in only one-minute extra scan time.Methods
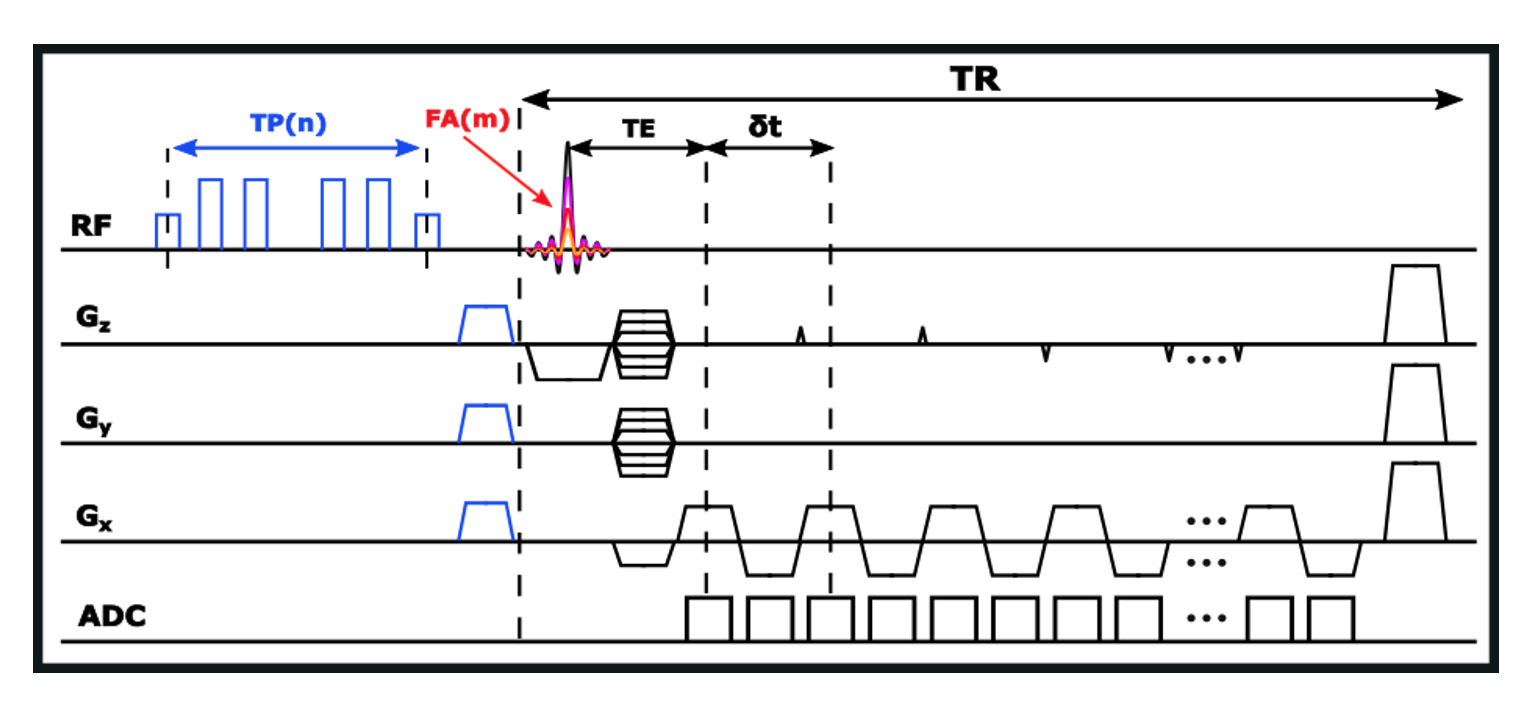
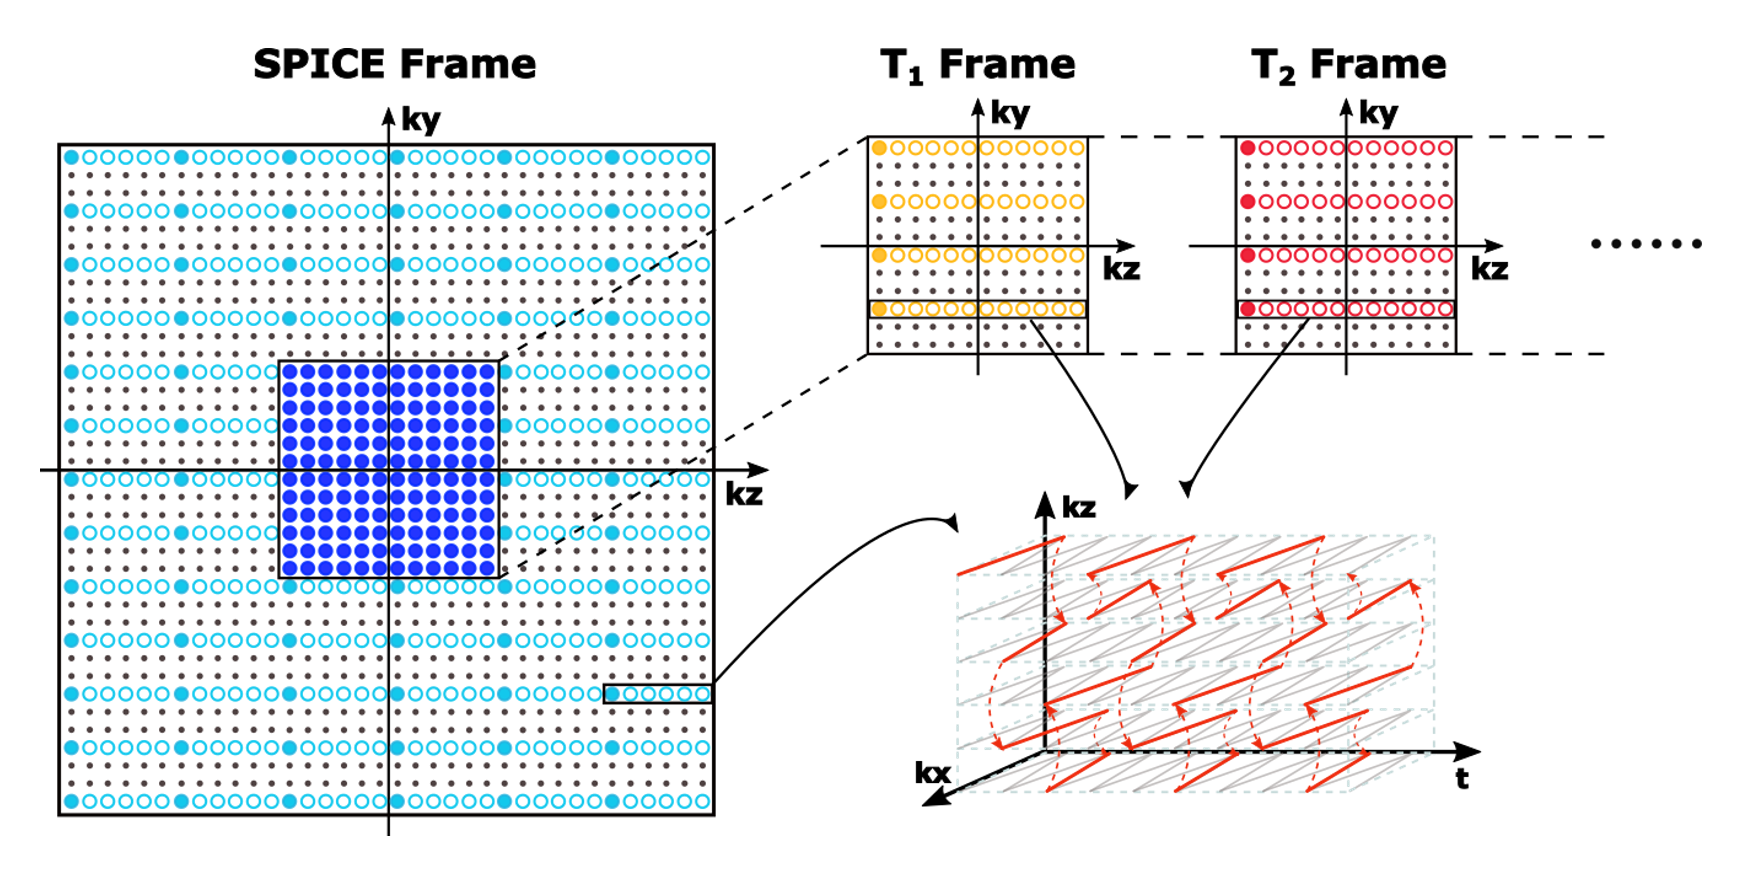
Extended SPICE sequence for T1, T2 mapping: As illustrated in Figure 1, the proposed acquisition sequence kept the basic features of the SPICE sequence while extending it with variable flip angles and T2-preparation modules for T1 and T2 mapping. The excitation pulses with different flip angles (FAs) were used to collect signals with different T1 weightings while the preparation pulses with different preparation times (TPs) were used for measuring signals with different T2 weightings. The T2 preparation pulses included three pairs of hard pulses to reduce sensitivity to B0 and B1 inhomogeneities. Figure 2 shows the proposed sampling of (k, t)-space: first, the SPICE sequence was used to acquire the metabolite signals and high-resolution water signals;7 then it was followed by the T1 frames with different FAs and T2 frames with different TPs; (k, t)-spaces of both the T1 and T2 frames were sparsely sampled using CAIPIRINHA trajectories (effective acceleration factors were 72, with a factor of 3 in ky and a factor of 24 in (kz, t)-space). The acquisition parameters of the current implementation were: FOV: 240×240×72 mm3, TR/TE: 160/1.6 ms, echospace: 1.76 ms, matrix size of SPICE frame = 110×218×72, matrix size of the central region of SPICE frame and T1/T2 frames = 110×78×24, TP = 0/20/40/60/80 ms and FA = 12/17/22/27/32˚, scan time: 7 min for SPICE frame, 1 min for T1 and T2 frames in total.Reconstruction from sparse and limited (k, t)-space data: Since the T1/T2 frames and the SPICE frame shared the same acquisition setup except for the use of variable flip angles or T2-preparation, the differences between the signals of different frames were only T1/T2 weightings which did not affect their temporal patterns. Therefore, the relationship between the spatiotemporal functions of the signals in the SPICE frame (denoted as $$$\rho_r(x,t)$$$ ) and in the T1/T2 frames (denoted as $$$\rho_i(x,t)$$$ ) could be expressed using a low-order generalized series (GS) model:9
$$\rho_i(\mathbf{x},t)=\rho_r(\mathbf{x},t)\cdot \sum_{n_i=-N_i/2}^{N_i/2}c_{n_i}(\mathbf{x})e^{i2{\pi}{n_i}{\Delta}ft}$$
where $$$i$$$ denotes a specific T1/T2 frame, $$$c_{n_i}(\mathbf{x})$$$ the model coefficients and $$$N_i$$$ the GS model order. Reconstruction of $$$\rho_i(\mathbf{x},t)$$$ from the sparsely measured data (denoted as $$$d_i$$$) became solving the following optimization problem:
$$\widehat{c}_i= \mathrm{arg}\mathrm{min}_{c_i}{\left \| d_i-{\Omega}{FBS}(G(\rho_r)c_i)) \right \|^2_2+R(c_i)}$$
where $$$\widehat{c}_i$$$ and $$$\rho_r$$$ are the vector forms of $$$\left \{ c_{n_i}(\mathbf{x}) \right \}$$$ and $$$\rho_r(\mathbf{x},t)$$$, $$$\Omega,F,B,S,G,R$$$ represent operators associated with k-space sampling, Fourier transform, field inhomogeneity effect, coil sensitivity weighting, GS modeling and regularization, respectively. After the GS coefficients $$$\widehat{c}_i$$$ were determined, the reconstructed signals $$$\widehat{\rho}_i(\mathbf{x},t)$$$ could be synthesized using the GS model and the reference SPICE signals. With the reconstructed signals of all the T1/T2 frames, T1, T2 and PD maps could be generated by fitting to the relaxation model.
The generation of metabolite maps from the SPICE frame followed the existing methods.5-12
Results
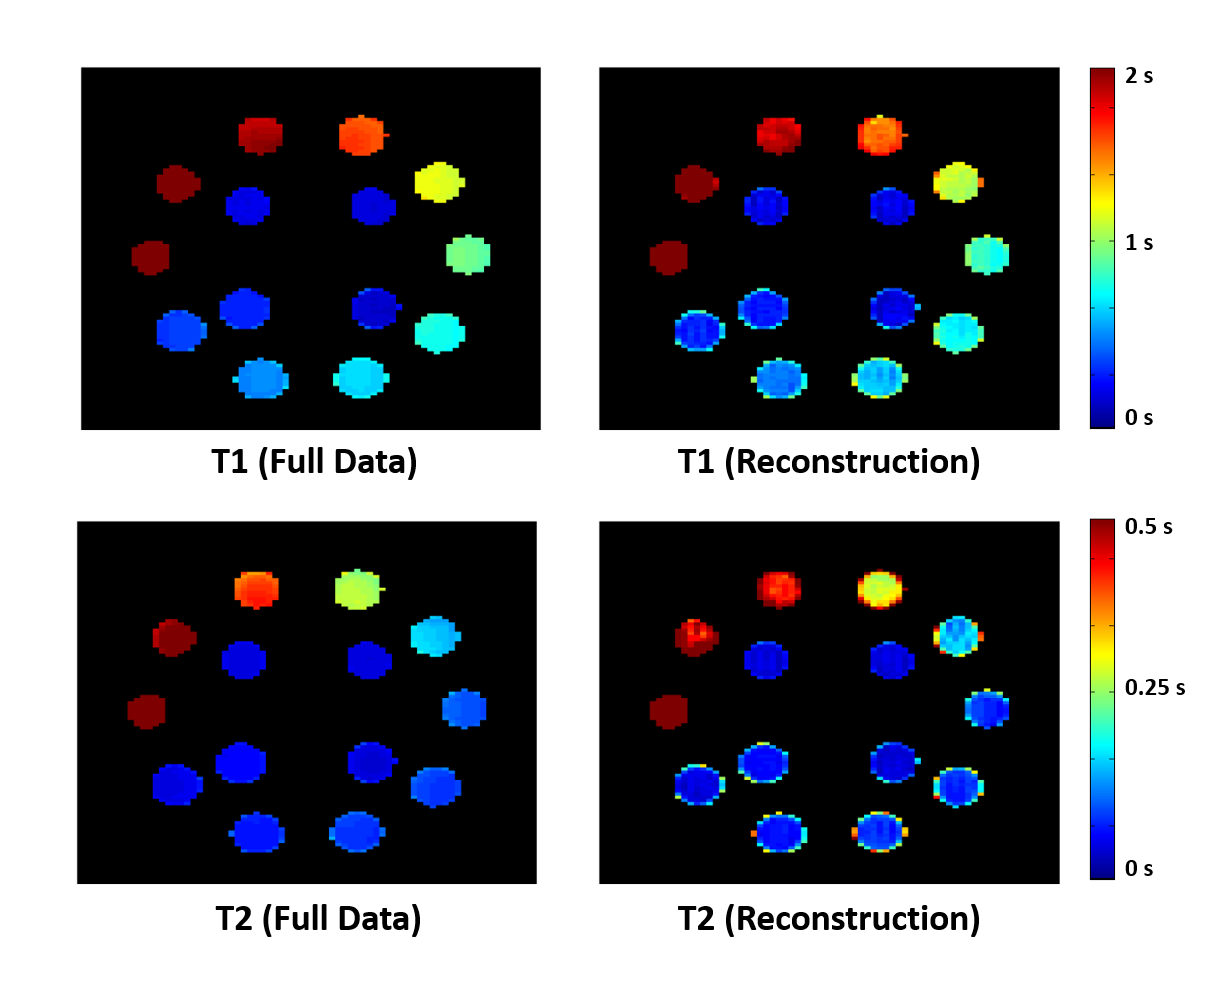
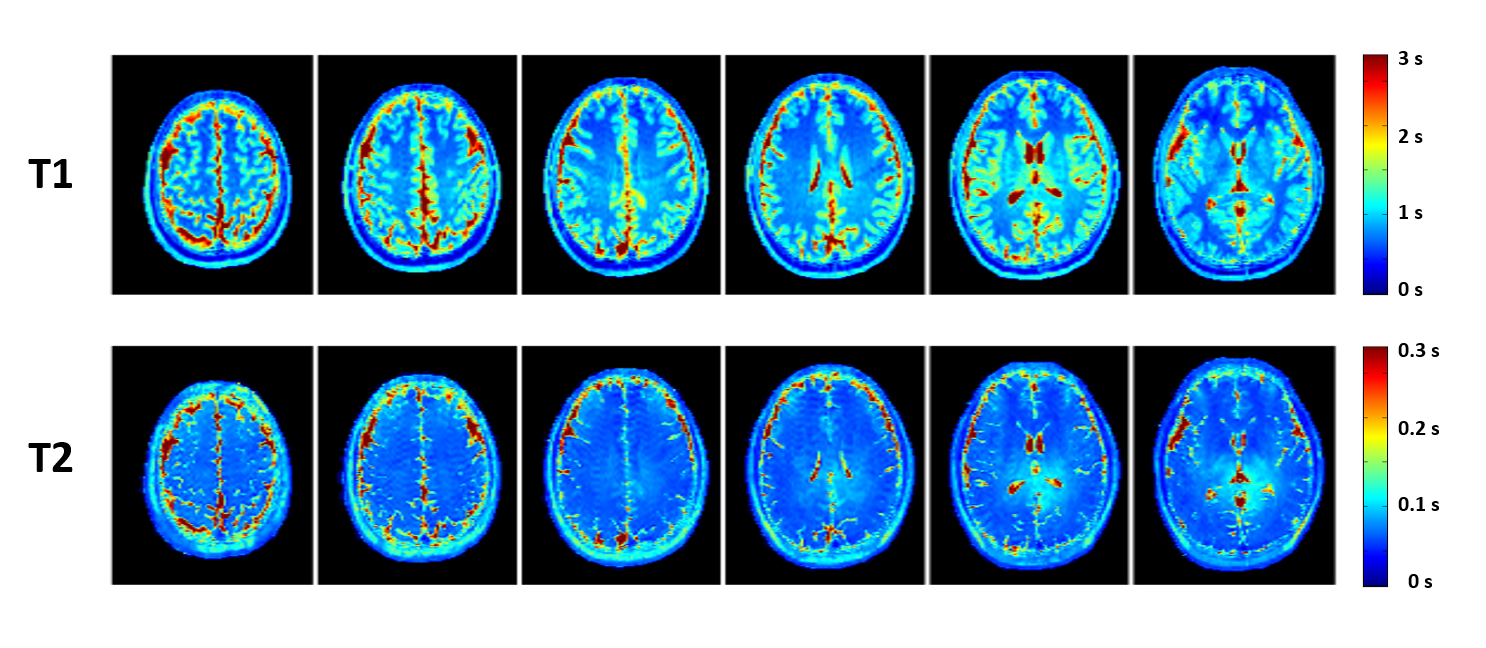
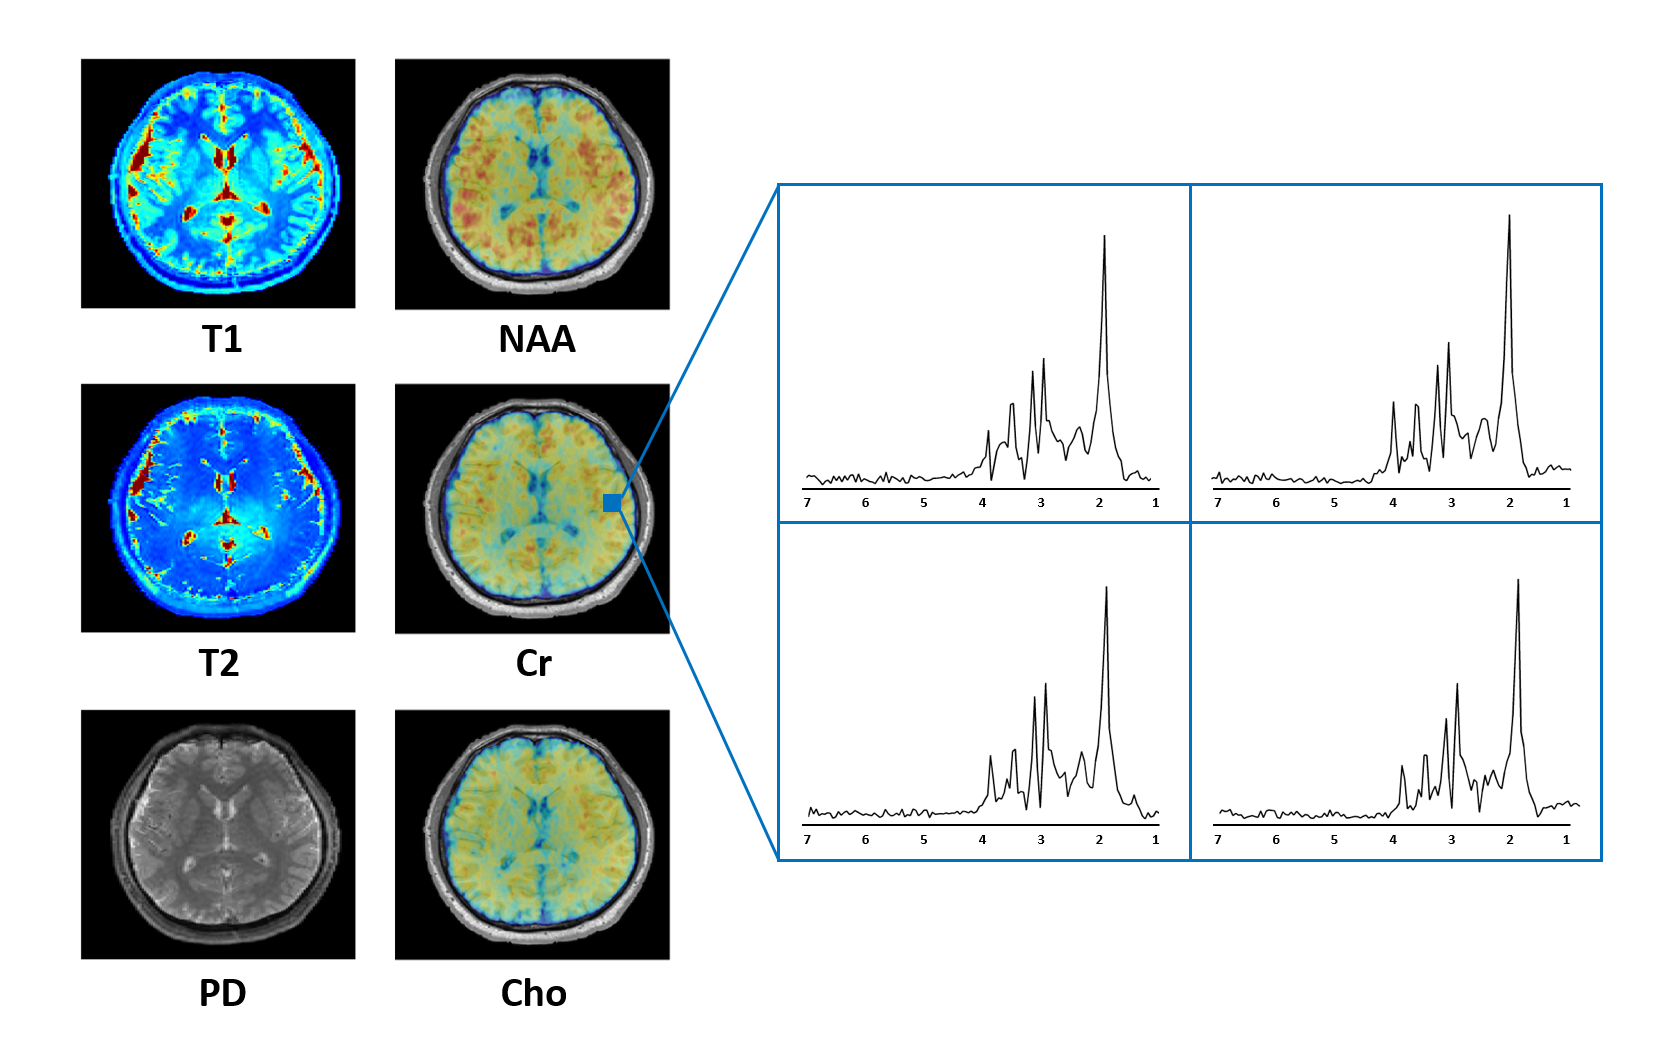
Both phantom and in vivo experiments on healthy subjects were carried out on a 3T Siemens scanner. Figure 3 shows the T1 and T2 maps generated from the NIST/ISMRM system phantom. The T1 and T2 maps reconstructed from the sparse data were compared with those estimated from fully sampled data, which showed good consistency. Figure 4 shows some representative T1 and T2 maps obtained from a healthy subject using the proposed method. Note that the extra scan time for obtaining the T1 and T2 maps at 1.0×1.0×2.0 mm3 resolution was one minute. Figure 5 shows a complete set of results from an 8-minute scan, including the quantitative T1, T2, PD maps and spatiospectral distributions of metabolite signals (NAA, Cr, Cho, …).Conclusion
Quantitative T1 and T2 maps of the brain at 1.0×1.0×2.0 mm3 resolution were successfully obtained in one-minute extra scan time along with SPICE. This new capability enables simultaneous high-resolution parametric mapping and metabolic imaging of the human brain, which can provide quantitative T1, T2, PD maps at 1.0×1.0×2.0 mm3 resolution and metabolite signals (NAA, Cr, Cho, …) at 2.0×3.0×3.0 mm3 resolution in a total 8-minute scan.Acknowledgements
This work reported in this paper was supported, in part, by the National Institutes of Health (R21-EB023413).References
1. Deoni SC. (2010). Quantitative relaxometry of the brain. Top Magn Reson Imaging. 2010;21(2):101-113.
2. Posse S, Otazo R, Dager S, et al. MR spectroscopic imaging: principles and recent advances. J. Magn. Reson. Imaging. 2013;37(6):1301-1325.
3. Ma D, Gulani V, Seiberlich N, et al. Magnetic resonance fingerprinting. Nature. 2013;495(7440):187-192.
4. Wang F, Dong Z, Reese TG, et al. Echo planar time‐resolved imaging (EPTI). Magn Reson Med. 2019;81(6):3599-3615.
5. Lam F, Liang ZP. A subspace approach to high‐resolution spectroscopic imaging. Magn Reson Med. 2014;71(4):1349-1357.
6. Peng X, Lam F, Li Y, et al. Simultaneous QSM and metabolic imaging of the brain using SPICE. Magn Reson Med. 2018;79(4):13-21.
7. Guo R, Zhao Y, Li Y, et al. Simultaneous QSM and metabolic imaging of the brain using SPICE: Further improvements in data acquisition and processing. Magn Reson Med. 2020;85(2):970– 977.
8. Guo R, Zhao Y, Li Y, et al. Simultaneous metabolic and functional imaging of the brain using SPICE. Magn Reson Med. 2019;82(6):1993– 2002.
9. Liang ZP, Lauterbur PC. A generalized series approach to MR spectroscopic imaging. IEEE Trans Med Imaging. 1991;10(2):132-137.
10. Liang ZP. Spatiotemporal imaging with partially separable functions. Proc IEEE Int Symp Biomed Imaging. 2007:988–991.
11. Ma C, Lam F, Johnson CL, et al. Removal of nuisance signals from limited and sparse 1H MRSI data using a union‐of‐subspaces model. Magn Reson Med. 2016;75(2):488-497.
12. Li Y, Lam F, Clifford B, et al. A subspace approach to spectral quantification for MR spectroscopic imaging. IEEE Trans Biomed Eng. 2017;64(10):2486-2489
Figures